<b>Bruhwiler</b>, L., A. M. <b>Michalak</b>, R. Birdsey, J. B. Fisher, R. A. Houghton, D. N. Huntzinger, and J. B. Miller, 2018: Chapter 1: Overview of the global carbon cycle. In Second State of the Carbon Cycle Report (SOCCR2): A Sustained Assessment Report [Cavallaro, N., G. Shrestha, R. Birdsey, M. A. Mayes, R. G. Najjar, S. C. Reed, P. Romero-Lankao, and Z. Zhu (eds.)]. U.S. Global Change Research Program, Washington, DC, USA, pp. 42-70, https://doi.org/10.7930/SOCCR2.2018.Ch1.
Overview of the Global Carbon Cycle
In the Earth System, carbon is stored in rocks (as carbonates), sediments, ocean and freshwaters, soils and terrestrial biomass, and the atmosphere. By far the larger reservoir of carbon is the deep water of the ocean, which is thought to contain about 80% of the Earth System’s carbon (excluding rock; see Figure 1.2). Oceanic sediments are thought to contain 4%. Ocean surface waters and the atmosphere each hold about 2% of the Earth system’s carbon reservoirs. Oil, gas, and coal reserves are thought to contribute another 3%. Soils and permafrost hold 5% and 4% of global carbon, respectively, while carbon stored in vegetation adds about 1%. The global carbon cycle includes the mechanical, chemical, and biological processes that transfer carbon among these reservoirs (see Figure 1.2). Reservoirs of carbon in the Earth system often are also referred to as “pools” or “stocks,” and transfers of carbon between reservoirs are known as “fluxes.” Some of these carbon fluxes are sensitive to climate, and their resulting responses to climate change are known as “carbon cycle–climate feedbacks.” A positive feedback can occur when carbon fluxes to the atmosphere increase as a result of, for example, increasing temperatures. More carbon in the atmosphere leads to further climate warming, possibly further increasing carbon fluxes to the atmosphere. Carbon cycle–climate feedbacks will be discussed further in Section 1.4.
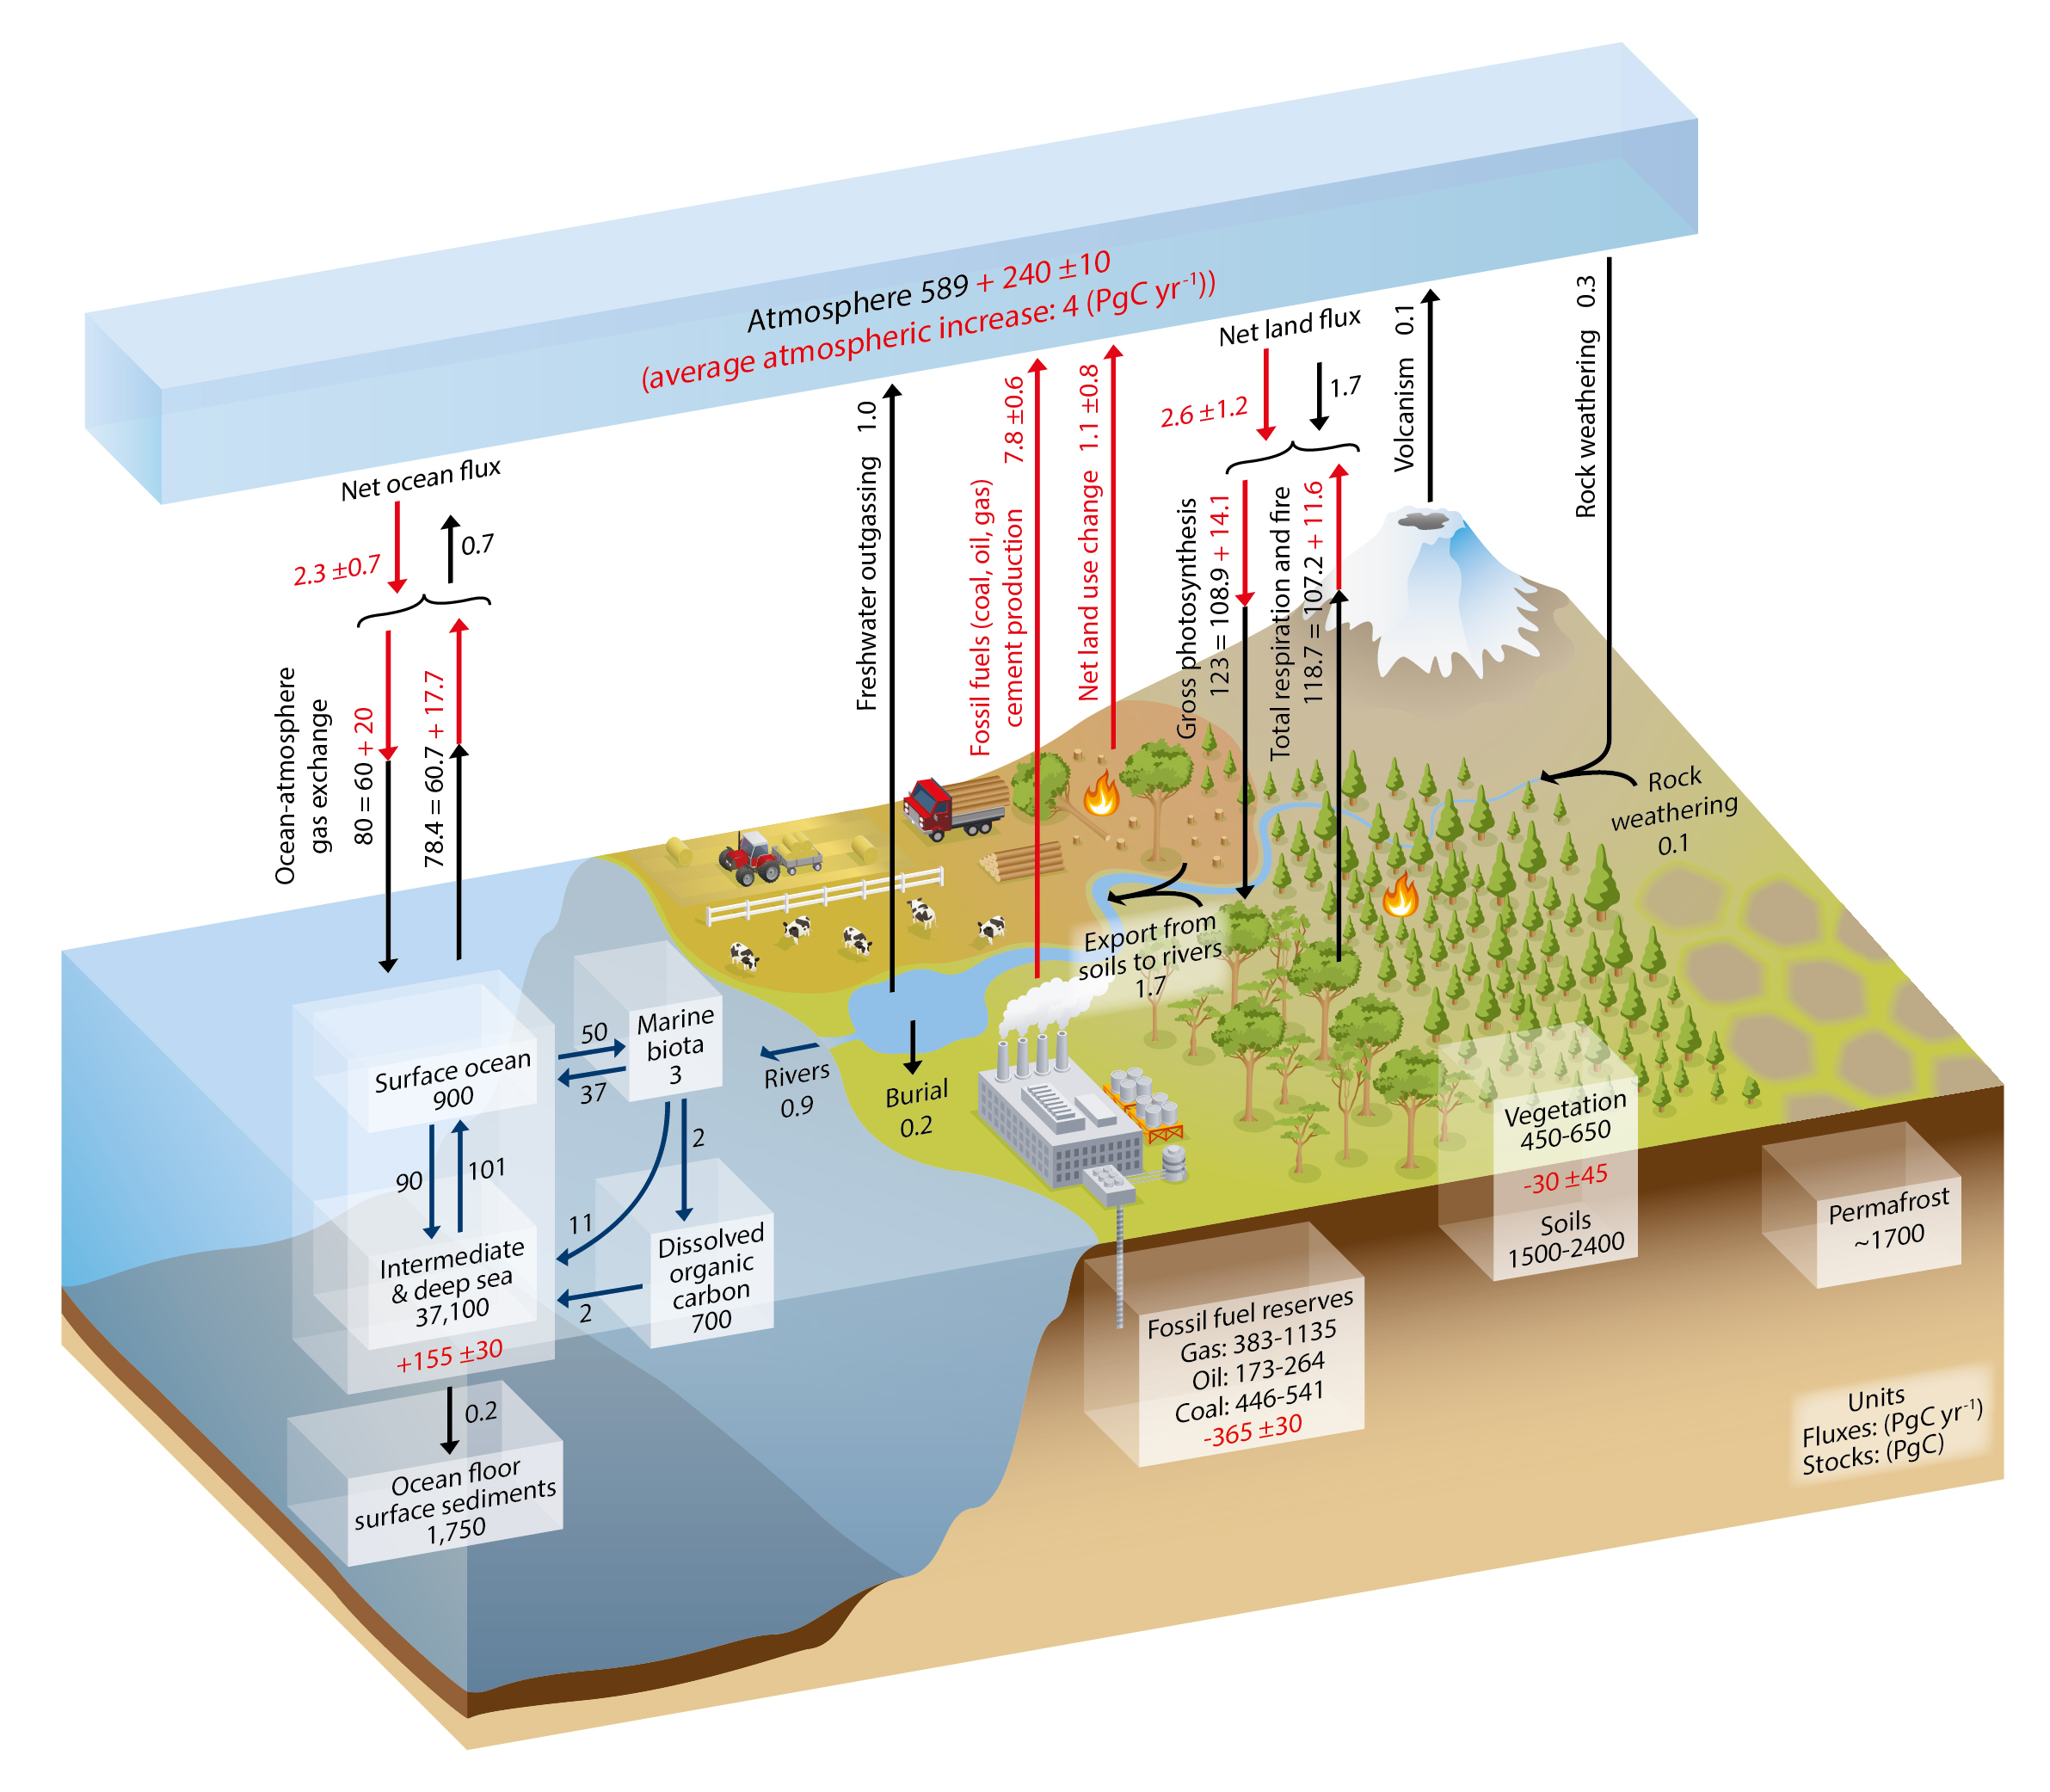
Figure 1.2: A Simplified Pictorial Illustration of the Global Carbon Cycle
1.2.1 Carbon Dioxide
The global carbon cycle comprises a fast carbon cycle, having relatively rapid exchanges among the ocean, terrestrial biosphere, and atmosphere, and a slow carbon cycle, involving exchanges with geological reservoirs such as deep soils, the deeper ocean, and rocks. Equilibration between the terrestrial biosphere and ocean occurs on millennial timescales, while redistribution of CO2 among geological reservoirs requires tens to hundreds of thousands of years or longer. Figure 1.2 provides a pictorial representation of the exchanges of carbon among the main reservoirs, together with associated timescales.
Reservoirs for the fast components of the carbon cycle include the ocean, land vegetation and soils, freshwaters, shallow oceanic sediments, and the atmosphere. Based on estimates from the Intergovernmental Panel on Climate Change Fifth Assessment Report (IPCC AR5; IPCC 2013), about 830 petagrams of carbon (Pg C; 2000 to 2009 average) were present in the atmosphere, while 450 to 650 Pg C are stored in the terrestrial biosphere. Larger reservoirs of carbon exist in soils (1,500 to 2,400 Pg C; IPCC 2013), and soil organic carbon (SOC) densities are highest in moist boreal and tropical latitudes. Scharlemann et al. (2014) pointed out that these numbers are uncertain due to limited depth and sparse distribution of sampled or observed SOC profiles. The Arctic permafrost soils are estimated to contain 1,339 to 1,580 Pg C in the top 3 m of the soil column, with another 400 Pg C possible in deep soils (Schuur et al., 2015). Ocean waters and shallow sediments contain about 40,500 Pg C. The “fast-exchange” reservoirs of the ocean surface and marine biota hold only 900 Pg C and 3 Pg C, respectively. Turnover times for these fast- and slow-exchange reservoirs range from decades to millennia.
Exchange of carbon between the atmosphere and the terrestrial biosphere occurs via photosynthesis and respiration. Carbon is removed from the atmosphere by photosynthesis and fixed in leaves, roots, stems, and woody biomass. It is returned to the atmosphere through autotrophic (plant) respiration and heterotrophic (microbial) respiration of plant litter and soil carbon. Fire and other disturbances such as insect outbreaks and timber harvesting can be thought of as accelerated respiration processes, and the amount entering the atmosphere from these processes varies from year to year. Removal of CO2 by photosynthesis is thought to have been slightly higher in the preindustrial atmosphere than emissions added from respiration and natural disturbances. Global total photosynthesis at that time is thought to have exceeded global respiration and emissions from natural disturbances so that net removal from the atmosphere by the land was about 1.7 Pg C per year. This removal is estimated to have been approximately in balance with outgassing from the ocean and freshwaters (Ciais et al., 2013; see Figure 1.2).
Gas exchange between the atmosphere and ocean depends on the difference between the partial pressure of CO2 in surface water and that of CO2 in the atmosphere (∆pCO2). Carbon dioxide dissolves in ocean water to form carbonic acid (H2CO3), which then forms bicarbonate (HCO3–) and carbonate (CO32–). These coupled reactions chemically buffer ocean water, thus regulating ocean pCO2 and pH. Because pCO2 can vary spatially, carbon outgasses from the ocean waters in some regions and is taken up in others. In regions where there is upwelling of nutrient-rich water and ocean waters are warm (e.g., in parts of the tropics), carbon is outgassed. In the North Atlantic, cold, sinking water removes carbon from the atmosphere. The Southern Ocean (latitudes south of 44°S) is another area where carbon is taken up. Carbon also is exchanged between land and ocean reservoirs via river transport to the coastal ocean.
Year-to-year variability of the global ocean CO2 sink was thought to be small, at only about ±0.2 Pg C per year or 9% of annual ocean uptake (Wanninkhof et al., 2013); however, recent work by Landschutzer et al. (2016), based on comprehensive measurements of global ∆pCO2 of ocean surface water, suggests that substantial decadal and interannual variability can exist. They found that during the 1990s, the global ocean sink was likely to have been significantly smaller than after year 2000 (–0.8 ± 0.5 Pg C per year and –2.0 ± 0.5 Pg C per year, respectively). They proposed 1) that these decadal variations are driven by extratropics and are linked with the atmospheric northern and southern annular modes and 2) that interannual variability is driven by the tropical ocean. The variability of the global land sink is larger, varying by 3 to 4 Pg C per year, and most of this variability likely occurs in the tropics (Baker et al., 2006). This global atmospheric CO2 interannual variability arises primarily from land sink variability because of the strong anticorrelation between CO2 and δ13C (e.g., Alden et al., 2010). Terrestrial net carbon exchange gives rise to significant δ13C variability, whereas air-sea gas exchange does not. The El Niño Southern Oscillation (ENSO) is thought to be a significant driver of tropical carbon flux variability for both the ocean and terrestrial ecosystems. During the warm phase of ENSO, the ocean takes up more carbon because of reduced upwelling and outgassing from the eastern Tropical Pacific. On land, ENSO is associated with outgassing from the terrestrial biosphere, a phenomenon likely associated with drought and warmer global temperatures. Indeed, the strong ENSO of 2016 pushed measured CO2 concentrations at Mauna Loa to above 400 ppm, where they have remained (Betts et al., 2016).
The slow, or geological, carbon cycle operates on timescales of tens of millennia and longer. Fluxes to the atmosphere from volcanism, CO2 removal from the atmosphere by chemical weathering, and ocean sediment formation together are a factor of 10 smaller than the fluxes of the fast carbon cycle. A vast amount of carbon is also stored in sedimentary rocks (100 × 106 Pg C), with an estimated 4,000 Pg C stored as hydrocarbons (Ciais et al., 2013).
Ice core evidence suggests that during glacial periods atmospheric CO2 was present at about 180 to 200 ppm. During interglacial periods, atmospheric CO2 abundance was higher, between 270 to 290 ppm (Lüthi et al., 2008; Petit et al., 1999). The current atmospheric levels of 400 ppm are well outside the range that existed during the period resolved by ice cores; that is, 800,000 years before present. The most recent glacial period ended about 12,000 years ago, with the most recent glacial maximum occurring about 22,000 years ago. Even older evidence from Arctic lake sediments suggests that around 3.5 million years ago, Arctic summer temperatures were about 8°C warmer than today with atmospheric CO2 levels around 400 ppm (Brigham-Grette et al., 2013). Contemporary CO2 has surpassed 400 ppm, suggesting that the current Arctic is not yet in equilibrium with rapidly rising greenhouse gas concentrations and may become much warmer in the future.
Estimates for recent decades show significant trends and variability in the main components of the global carbon cycle (see Table 1.1). Only about half of human-driven emissions from fossil fuel burning, industry (e.g., cement manufacturing), and land-use change remains in the atmosphere, although the growth in atmospheric CO2 is highly variable depending on emissions and the strength of uptake by land and ocean (see Table 1.1). Emissions have risen by about 70% from the 1980s to the most recent decade (2007 to 2016), while land and ocean have taken up 3.0 ± 0.8 and 2.4 ± 0.5 Pg C per year, respectively (Le Quéré et al., 2017). Of this amount, North America represents a rather substantial share of global carbon uptake (0.31 Pg C per year; see Ch. 2: The North American Carbon Budget). Figure 1.3a shows global average atmospheric CO2 derived from in situ surface air samples. The steep rise in CO2 reflects anthropogenic emissions, while the annual cycle reflects the seasonal uptake of vegetation, predominantly in the Northern Hemisphere.
Table 1.1. Historica and Decadalb Global Mean Emissions and Their Partitioning to the Carbon Reservoirs of Atmosphere, Ocean, and Land
|
1750–2011 Cumulative Pg Cc |
1980–1989 Pg C per Year |
1990–1999 Pg C per Year |
2000–2009 Pg C per Year |
2007–2016 Pg C per Year |
2016 Pg C per Year |
|
|---|---|---|---|---|---|---|
| Emissions | ||||||
| Fossil Fuels and Industry | 375 ± 30 | 5.5 ± 0.3 | 6.3 ± 0.3 | 7.8 ± 0.4 | 9.4 ± 0.5 | 9.9 ± 0.5 | Land-Use Change | 180 ± 80 | 1.2 ± 0.7 | 1.3 ± 0.7 | 1.2 ± 0.7 | 1.3 ± 0.7 | 1.3 ± 0.7 |
| Partitioning to Carbon Reservoir | ||||||
| Growth in Atmospheric CO2c | 240 ± 10 | 3.4 ± 0.1 | 3.1 ± 0.1 | 4.0 ± 0.1 | 4.7 ± 0.1 | 6.0 ± 0.2 |
| Ocean Uptake | 160 ± 80 | 1.7 ± 0.5 | 1.9 ± 0.5 | 2.1 ± 0.5 | 2.4 ± 0.5 | 2.6 ± 0.5 |
| Land Uptake | 155 ± 30 | 2.0 ± 0.6 | 2.5 ± 0.5 | 2.9 ± 0.8 | 3.0 ± 0.8 | 2.7 ± 0.9 |
Notes
- Historic cumulative emissions and partitioning from the Intergovernmental Panel on Climate Change Fifth Assessment Report (Ciais et al., 2013).
- Decadal means from the Global Carbon Project (Le Quéré et al., 2017).
- Pg C, petagrams of carbon; CO2, carbon dioxide.
1.2.2 Methane
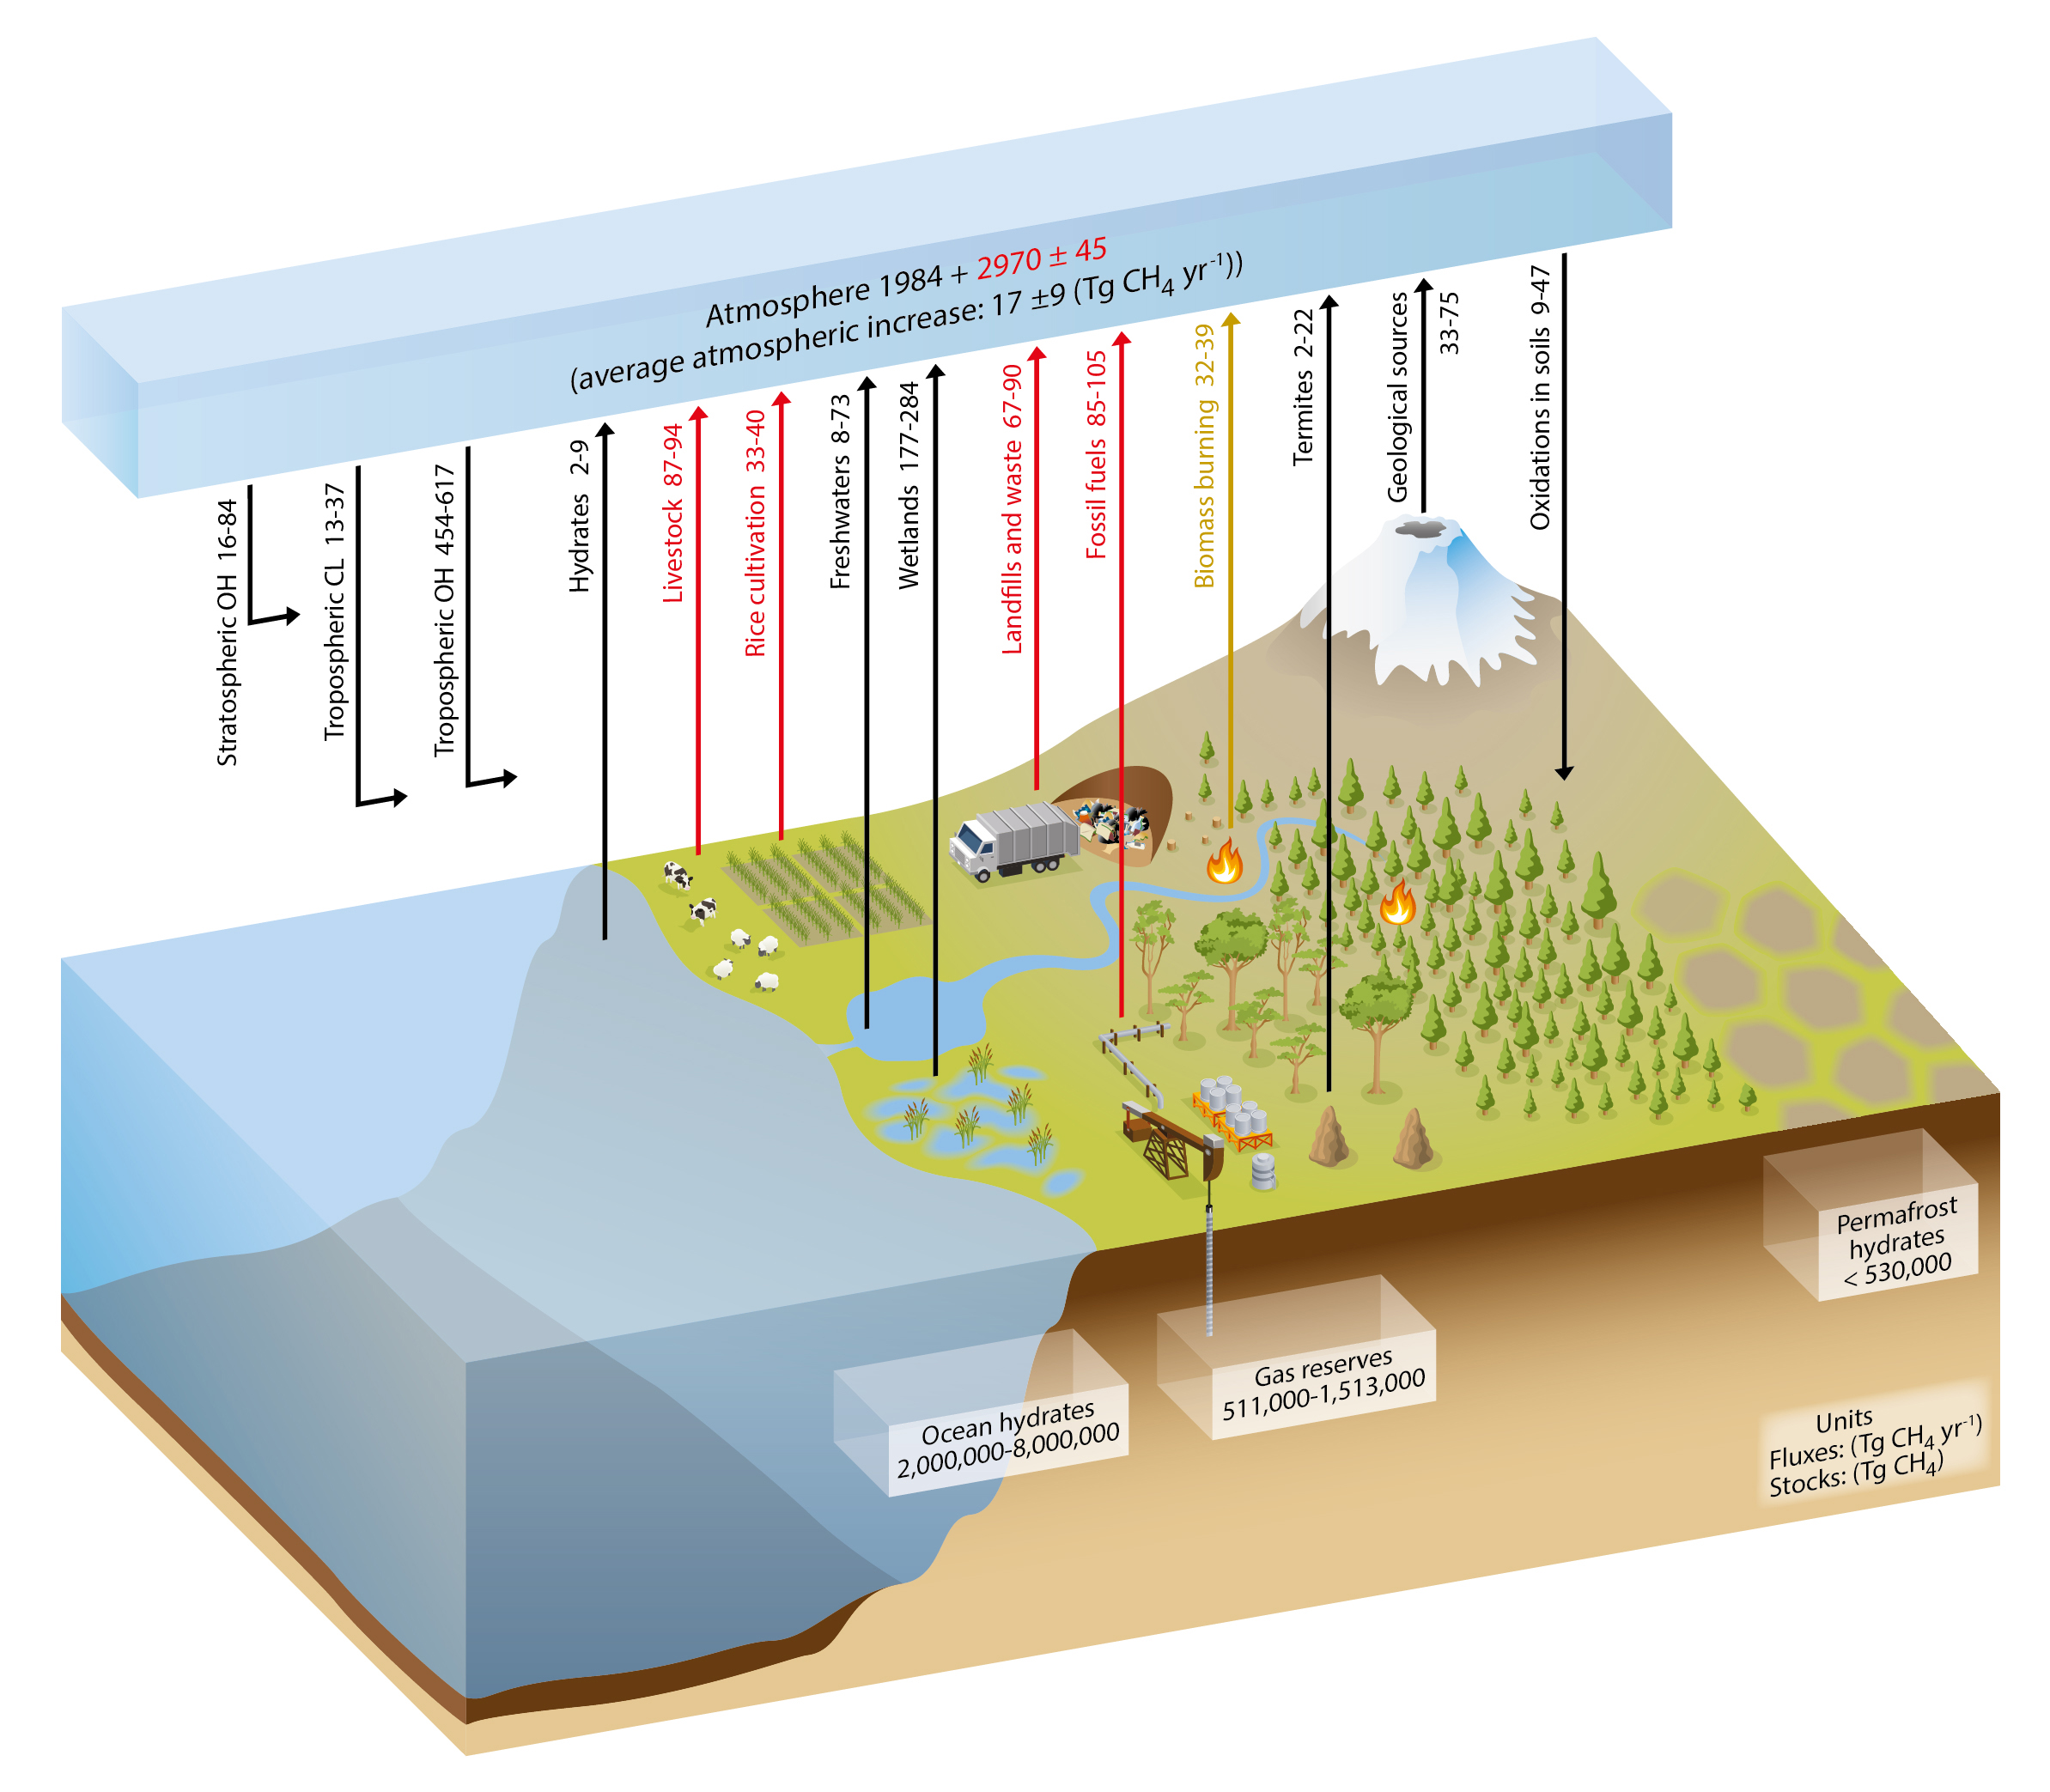
Total global CH4 emissions are approximately 550 teragrams (Tg) of CH4 per year (1 Tg CH4 per year = 1012 grams of CH4 per year; Saunois et al., 2016). Of this, roughly 40% comes from natural sources. The largest (and most uncertain) natural emissions of CH4 are from wetlands, defined as regions that are permanently or seasonally waterlogged. Natural wetlands include high-latitude bogs and fens, tropical swamps, and temperate wetlands. Saturated soils in warm tropical environments tend to produce the most CH4. However, warming Arctic temperatures raise concerns of increasing emissions from high-latitude wetlands and future decomposition of carbon currently stored in frozen Arctic soils (e.g., Schaefer et al., 2011; Schuur et al., 2015). Figure 1.4 provides a pictorial representation of the main components of the global methane cycle.
Estimates of global CH4 emissions from wetlands range from 127 to 227 Tg CH4 per year (Saunois et al., 2016), with most probable values between 167 and 185 Tg CH4 per year. Most emissions occur in tropical regions (Matthews 1989; Melton et al., 2013; Saunois et al., 2016). Currently, only about 25 Tg CH4 per year (i.e., 4% of global emissions) are thought to be emitted from high northern latitudes (AMAP 2015; Saunois et al., 2016). Because emissions are sensitive to temperature and precipitation, they exhibit significant seasonal cycles, especially at high latitudes, as well as interannual variability caused by moisture and temperature variability. Smaller amounts of CH4 are emitted from fires, the ocean, and enteric fermentation in termites and wild animals (20 Tg CH4 per year or less for each). In addition, up to 60 Tg CH4 per year may be emitted from geological sources, such as seeps, clathrates, mud volcanoes, and geothermal systems (Etiope et al., 2008; Schwietzke et al., 2016).
Unlike CO2, CH4 has an atmospheric chemical sink that nearly balances total global emissions. Removal of atmospheric CH4 by reaction with the hydroxyl radical (OH) results in a CH4 atmospheric lifetime of about 9 to 10 years. Observationally constrained estimates of CH4 lifetime suggest either small decreases of about 2% from 1980 to 2005 (Holmes et al., 2013) or stable CH4 lifetimes with the possibility of interannual variability of about 2% (Montzka et al., 2011). CH4 is a much more powerful greenhouse gas than CO2 (on a per mass basis and over 100 years, CH4 is about 25 times more effective at trapping heat than CO2).
Figure 1.3: Global Averages of Atmospheric Gases Derived from Surface Air Samples
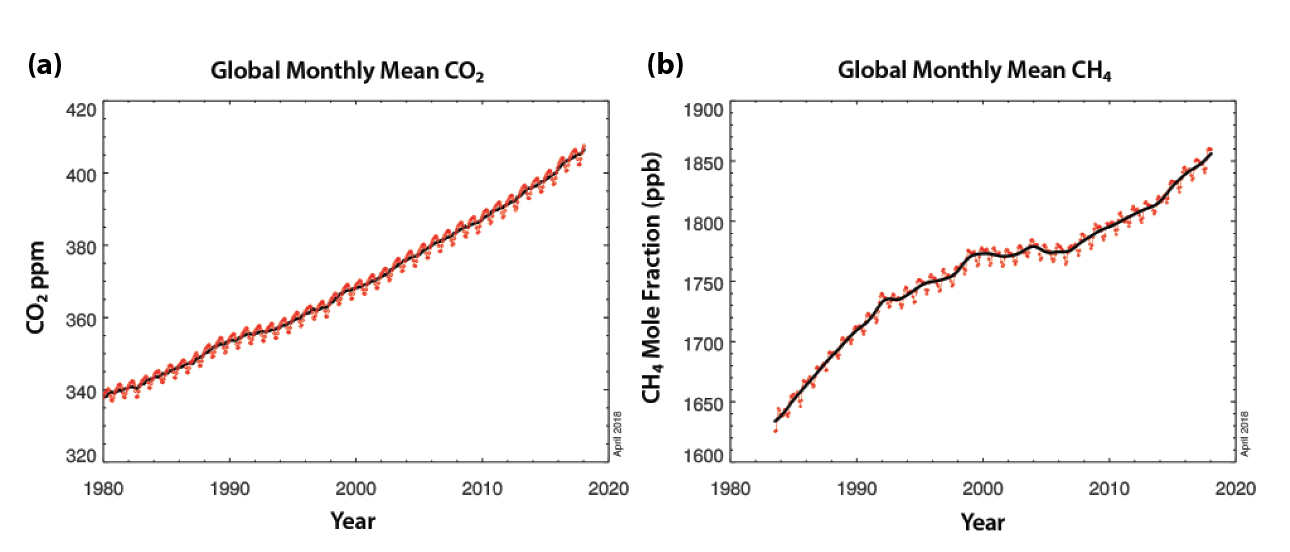
As shown in Figure 1.3b, atmospheric CH4 increased rapidly during the 1980s and early 1990s before its growth leveled off between the mid-1990s and early 2000s. Methane has resumed its increase in the atmosphere since 2006, and observations show that this growth has even accelerated since 2014. The changing atmospheric CH4 growth rate has been the subject of much debate, questioning why growth rate slowed for a decade starting in the mid-1990s. Several studies suggested that this slower rate was due to decreases in fugitive emissions from fossil fuel production (Aydin et al., 2011; Simpson et al., 2012) or to decreased emissions from anthropogenic microbial sources, such as rice agriculture (Kai et al., 2011). On the other hand, Dlugokencky et al. (1998, 2003) proposed that the slowing of CH4 growth in the atmosphere was due to an approach to a quasi–steady state, reached when global sources and sinks are in balance. Consistent with this view, the study of Schwietzke et al. (2016) found that emissions from oil and gas production have remained stable over the past several decades, implying increasing efficiency in fossil fuel production industries while their production was increasing over time.
Figure 1.4: A Pictorial Illustration of the Global Methane (CH4) Cycle
Dlugokencky et al. (2003) predicted that CH4 would approach a steady state in the atmosphere of about 1,780 ppb by the 2010s if there were no major changes in its budget. The methane budget did change, however, because the atmospheric growth of CH4 resumed its rise in 2006. The cause of the recent increase in CH4 growth also has been much debated. Based on global observations of the CH4 isotope, 13CH4, the global growth in CH4 appears likely to have been dominated by microbial sources in the tropics (wetlands or agriculture and waste), rather than fossil fuel production (Nisbet et al., 2016; Schaefer et al., 2016), as suggested by some studies (e.g., Rice et al., 2016). Other studies have argued that 13CH4 may not be a very strong constraint on the global methane budget and that changes in the atmospheric CH4 chemical sink are responsible for the global methane changes (Rigby et al., 2017; Turner et al., 2017). However, plausible chemical mechanisms that could explain the changes in the CH4 sink have not been identified. Using space-based retrievals of carbon monoxide, Worden et al. (2017) argued that the isotopic data record also can be consistent with increased fossil fuel emissions if global biomass-burning emissions have decreased twice as much as estimates based on space-based observations of burned areas. If the recent rise of global atmospheric CH4 is indeed due to increases in microbial emissions, then the question becomes whether anthropogenic or natural microbial sources are responsible. Some studies have suggested that anthropogenic microbial sources, such as livestock, are behind the increased atmospheric growth of CH4 (Schaefer et al., 2016; Saunois et al., 2016). If the increase is due to emissions from wetlands, especially in the tropics, then this raises the possibility that changing climate could be changing natural emissions.
See Full Chapter & References