Factors that control terrestrial carbon storage are changing. Surface air temperature change is amplified in high-latitude regions, as seen in the Arctic where temperature rise is about 2.5 times faster than that for the whole Earth. Permafrost temperatures have been increasing over the last 40 years. Disturbance by fire (particularly fire frequency and extreme fire years) is higher now than in the middle of the last century (very high confidence).
Soils in the northern circumpolar permafrost zone store 1,460 to 1,600 petagrams of organic carbon (Pg C), almost twice the amount contained in the atmosphere and about an order of magnitude more carbon than contained in plant biomass (55 Pg C), woody debris (16 Pg C), and litter (29 Pg C) in the boreal and tundra biomes combined. This large permafrost zone soil carbon pool has accumulated over hundreds to thousands of years. There are additional reservoirs in subsea permafrost and regions of deep sediments that are not added to this estimate because of data scarcity (very high confidence).
Following the current trajectory of global and Arctic warming, 5% to 15% of the soil organic carbon stored in the northern circumpolar permafrost zone (mean 10% value equal to 146 to 160 Pg C) is considered vulnerable to release to the atmosphere by the year 2100. The potential carbon loss is likely to be up to an order of magnitude larger than the potential increase in carbon stored in plant biomass regionally under the same changing conditions (high confidence, very likely).
Some Earth System Models project that high-latitude carbon releases will be offset largely by increased plant uptake. However, these findings are not always supported by empirical measurements or other assessments, suggesting that structural features of many models are still limited in representing Arctic and boreal zone processes (very high confidence, very likely).
Very High | Likely | As Likely As Not | Unlikely | Very Unlikely |
---|---|---|---|---|
≥ 9 in 10 | ≥ 2 in 3 | ≈ 1 in 2 | ≤ 1 in 3 | ≤ 1 in 10 |
Note: Confidence levels are provided as appropriate for quantitative, but not qualitative, Key Findings and statements. See Guide to this Report for more on uncertainty of numerical estimates.
<b>Schuur</b>, E. A. G., A. D. <b>McGuire</b>, V. <b>Romanovsky</b>, C. Schädel, and M. Mack, 2018: Chapter 11: Arctic and boreal carbon. In Second State of the Carbon Cycle Report (SOCCR2): A Sustained Assessment Report [Cavallaro, N., G. Shrestha, R. Birdsey, M. A. Mayes, R. G. Najjar, S. C. Reed, P. Romero-Lankao, and Z. Zhu (eds.)]. U.S. Global Change Research Program, Washington, DC, USA, pp. 428-468, https://doi.org/10.7930/ SOCCR2.2018.Ch11.
This assessment focuses on Arctic and boreal carbon pools and fluxes, particularly those included within the northern circumpolar permafrost (perennially frozen ground) zone, which includes tundra and a large fraction of the boreal biome. Current knowledge of the state of organic carbon in soils and vegetation is evaluated herein, along with the potential for these pools to change over time in response to disturbance regimes and changing climate. Changes in temperature and precipitation act as gradual “press” (i.e., continuous) disturbances that directly affect carbon stocks and fluxes by modifying the biological processes of photosynthesis and respiration (LTER 2007). Climate changes also can modify the occurrence and magnitude of biological disturbances such as insect outbreaks as well as abrupt physical disturbances such as fire, extreme drought, and soil subsidence and erosion resulting from ice-rich permafrost thaw. These “pulse” (i.e., discrete) disturbances often are part of the ongoing successional cycle in Arctic and boreal ecosystems, but changing rates of occurrence alter the landscape distribution of successional ecosystem states, in turn, affecting landscape carbon storage. This overview introduces recent and expected trends in these drivers; their combined impact on carbon pools and fluxes is detailed later in the chapter.
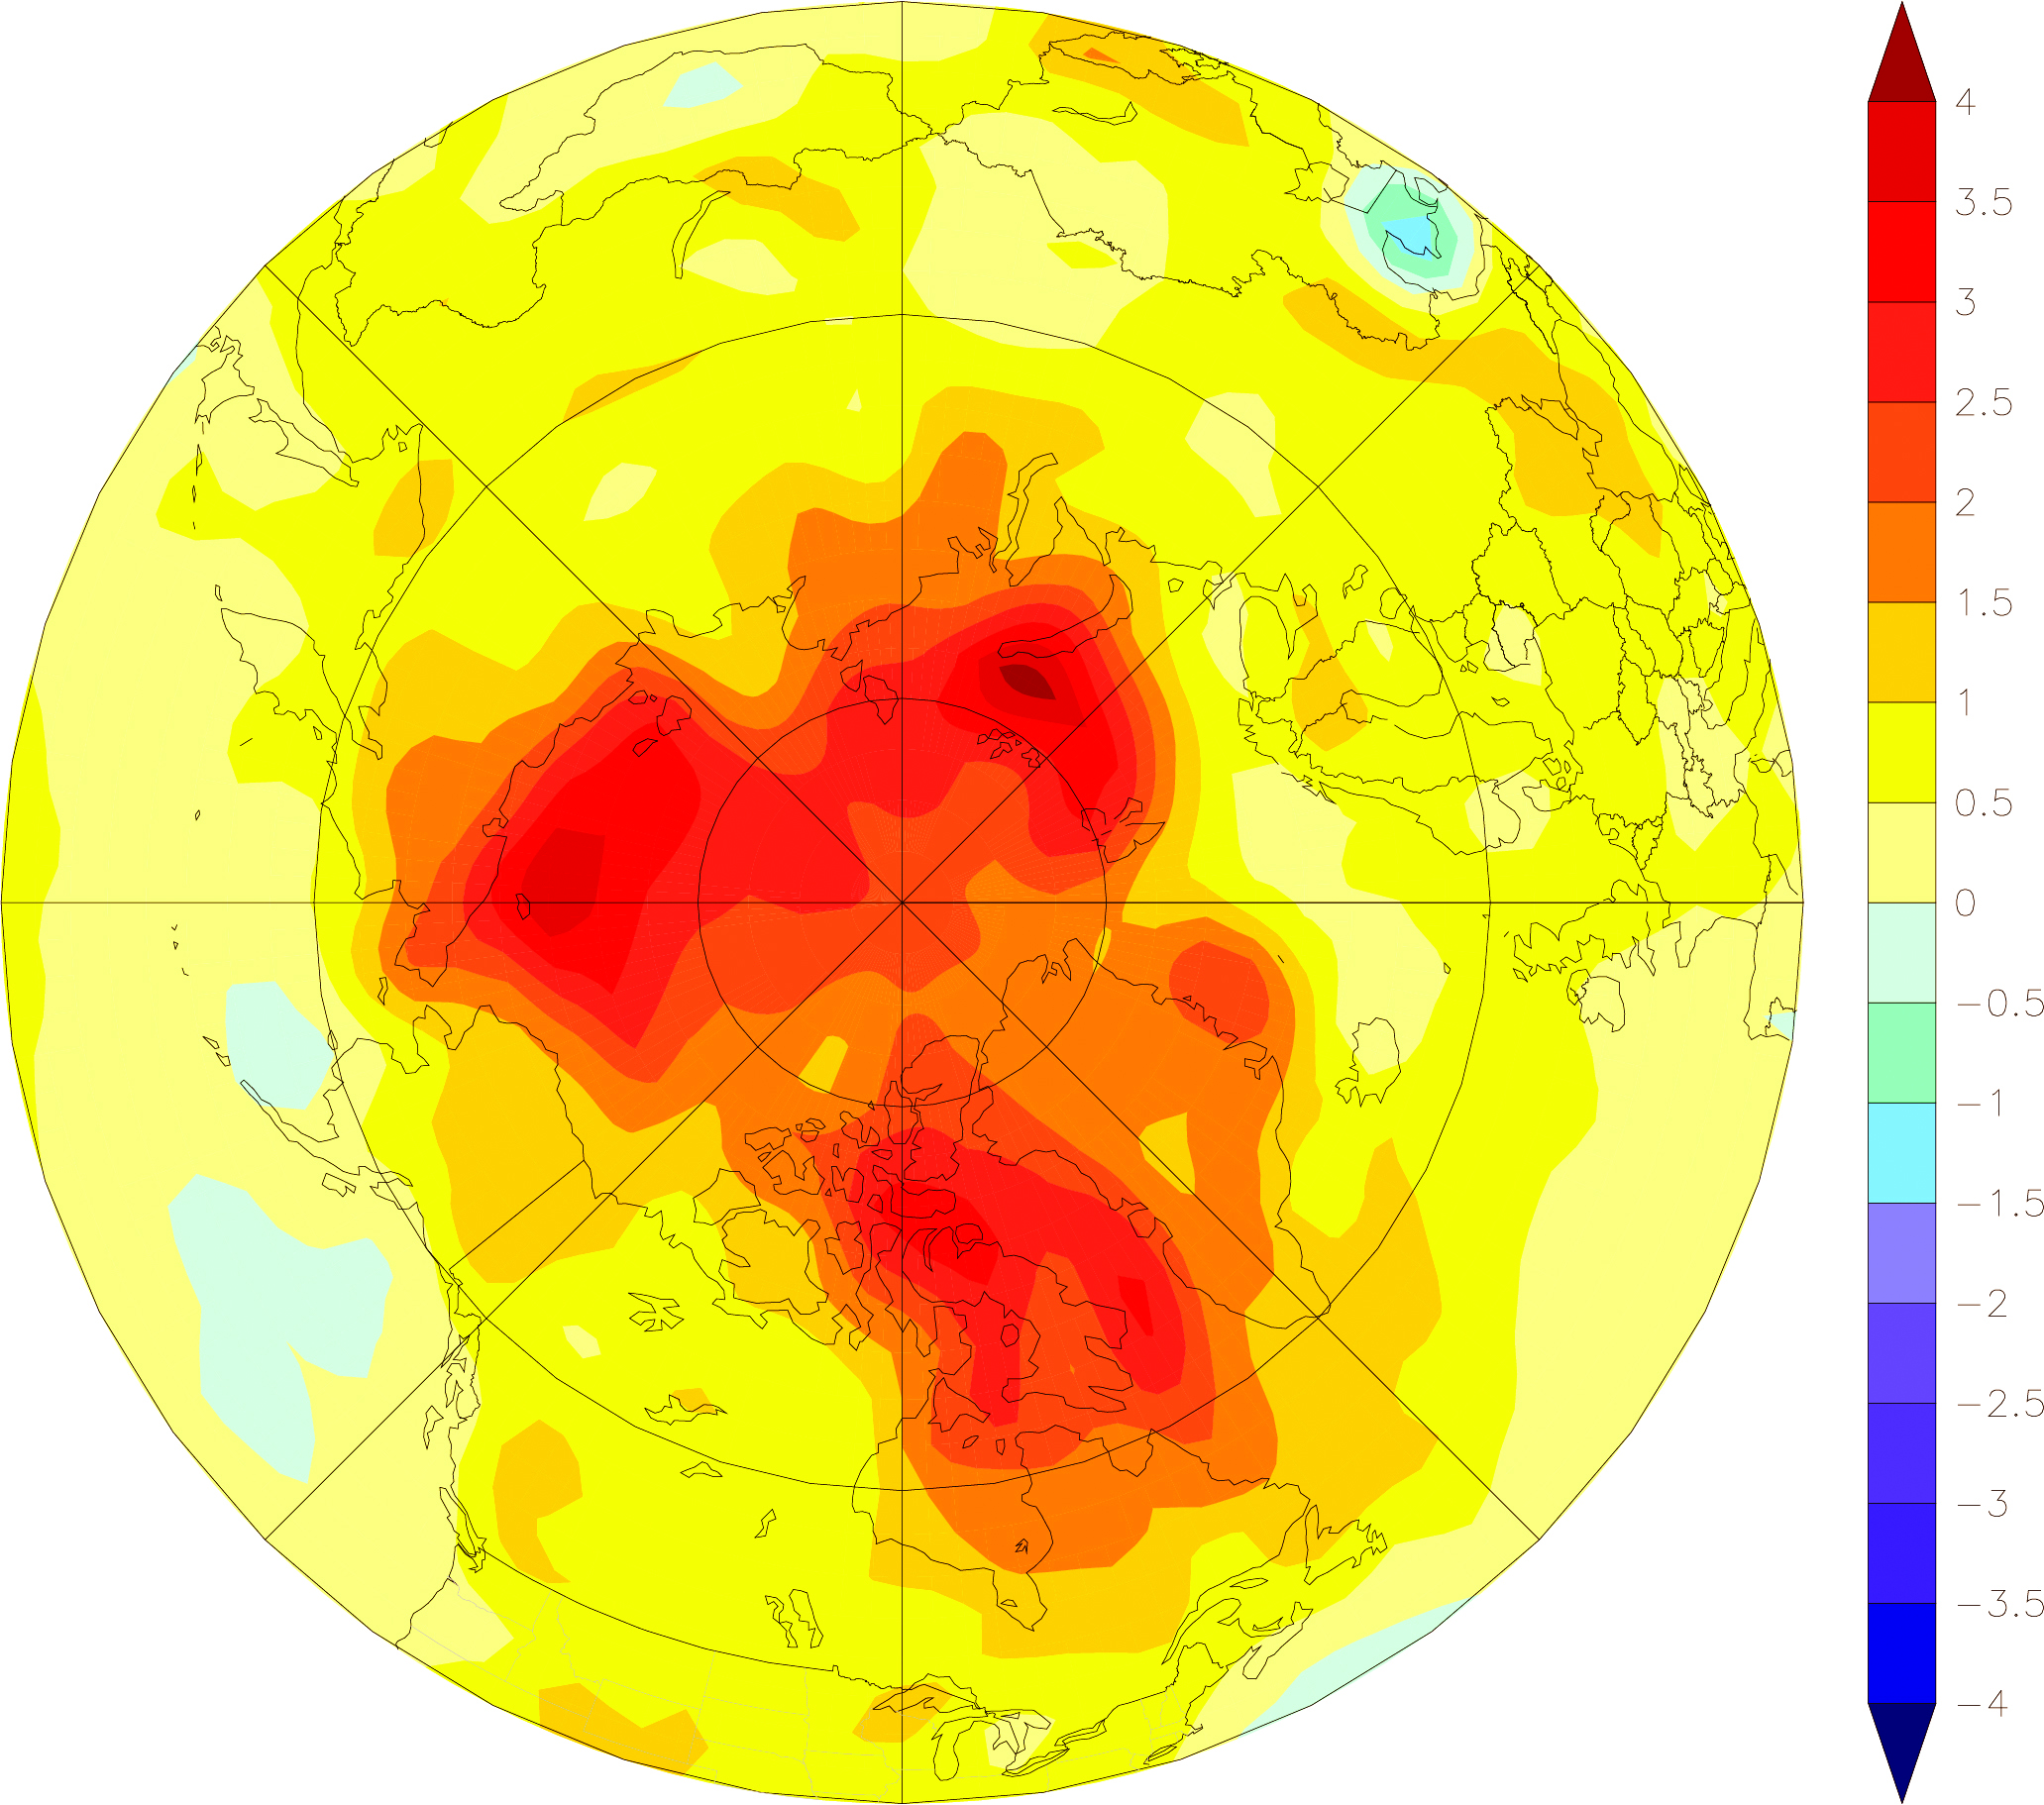
The most pronounced change in high-latitude climate during the last 40 to 50 years is the increase in mean annual surface air temperatures (see Figure 11.1). Global temperature change is amplified in high-latitude regions, as seen in the Arctic where temperature rise is about 2.5 times faster than that for the whole Earth (IPCC 2013). Air temperature increased in the Arctic by 1 to 2°C over the last 20 to 30 years (Overland et al., 2014). This increase was even more substantial (>3°C) in some regions of the Arctic Ocean and over the central and eastern parts of the Canadian Arctic Archipelago. Warming is most noticeable during the winter, but summer temperatures also are on the rise, and this differential is expected to continue in the future. The average air temperatures in the cold season (November through April) in Alaska, northern Canada, and in a large portion of Siberia have increased by 2 to 4°C between 1961 and 2014. In contrast, the temperature increase in the warm half of the year (May through October) was between 1 and 2°C for the same regions and time interval (data.giss.nasa.gov/gistemp/maps).
The degree of projected future warming—dependent on the scenario of changes in greenhouse gas (GHG) emissions through time—ranges widely for different Earth System Models (ESMs). By 2050, the differences in these projections as a result of various Representative Concentration Pathway (RCP) forcing scenarios (e.g., RCP4.5 and RCP8.5) are not large. Averaged across 36 ESMs, the projected mean annual air temperature increases for 60°N to 90°N by 2050 is about 3.7°C compared to the 1981 to 2005 period 2°C increase in the summer and 5.3°C increase in the winter (Overland et al., 2014). However, projections for 2100 differ significantly for RCP4.5 and RCP8.5. For 2100, the same models project a 4.3°C increase in mean annual temperature for RCP4.5 and an 8.7°C increase for RCP8.5. The summers are predicted to be warmer by 2.3°C for RCP4.5 and by 5.1°C for RCP8.5; winter temperatures are projected to rise by 6 and 12.5°C, respectively. Projected changes in precipitation are less consistent and vary significantly from region to region and over different time intervals. However, most models project increasing precipitation in the Arctic, especially in the winter. The percentage increases are largest in the cold season and, as a result of the RCP8.5 scenario, over the Arctic Ocean (IPCC 2013).
Permafrost is technically defined as subsurface Earth materials (e.g., rock, soil, and ice) remaining <0°C for at least 2 consecutive years. Observed changes in climate triggered a substantial increase in permafrost temperatures during the last 40 years (Romanovsky et al., 2010, 2016; Smith et al., 2010). Based on data from a selection of sites with both long-term records and good geographical coverage, annual mean permafrost temperatures generally have been increasing (Noetzli et al., 2016; Romanovsky et al., 2016; see Figure 11.2). The greatest temperature increase is found in colder permafrost (approximately –15 to –2°C) in the Arctic where current permafrost temperatures are more than 2 to 2.5°C higher than they were 30 years ago. In areas with warmer permafrost (approximately –2 to 0°C)—such as the southern and central Mackenzie Valley, interior Alaska, Siberia’s discontinuous permafrost zone, and the Nordic region—the absolute temperature change in permafrost has been much smaller, with increases generally less than 1°C since the 1980s.
Permafrost change in these warmer regions typically involves near-surface degradation, as measured by the thickness of the seasonally thawed layer at the soil surface, which thaws in summer and refreezes in winter. This parameter is defined as the active layer thickness (ALT), the maximum thaw depth at the end of the summer. ALT responds more to short-term variation in climate as compared to the deeper ground temperature. Ground-based records of ALT, therefore, exhibit greater interannual variability, primarily in response to variation in summer temperature (Smith et al., 2009). Although decadal trends in ALT vary by region (Shiklomanov et al., 2012), most regions where long-term ground-based ALT observations are available show an increase in ALT during the last 5 to 10 years (Romanovsky et al., 2016). These measured ALT increases actually may underestimate surface permafrost degradation because the ground surface can settle with permafrost thaw, obscuring actual changes in the permafrost surface using this metric (Shiklomanov et al., 2013). Recently, several direct and indirect remote-sensing methods were proposed for regional ALT estimations over large geographical areas using both airborne and spaceborne sensors (Gogineni et al., 2014; Liu et al., 2012; Pastick et al., 2013). However, these methods are still in development and thus are not yet used in an operational mode. The increase in ground surface temperatures over the last 30 years triggered long-term permafrost thaw in natural conditions at many locations not only within the discontinuous permafrost zone, but also in the cold continuous permafrost (Drozdov et al., 2012; James et al., 2013; Liljedahl et al., 2016; Malkova et al., 2014; Melnikov et al., 2015).
Beyond documented change in climate that has affected permafrost directly as a press disturbance, recent observations suggest that climate-sensitive pulse disturbance events, such as wildfire and abrupt permafrost thaw, are increasing in frequency, intensity, and extent across many high-latitude regions. Shifts in pulse disturbances are propelled by gradual climate warming (Jorgenson 2013); extreme weather events (Balser et al., 2014); insect and disease outbreaks (Kurz et al., 2008); and interactions among disturbances, such as those between abrupt thaw and wildfire (Hu et al., 2010; Jones et al., 2015; Lara et al., 2016) or human activities (Jorgenson et al., 2006).
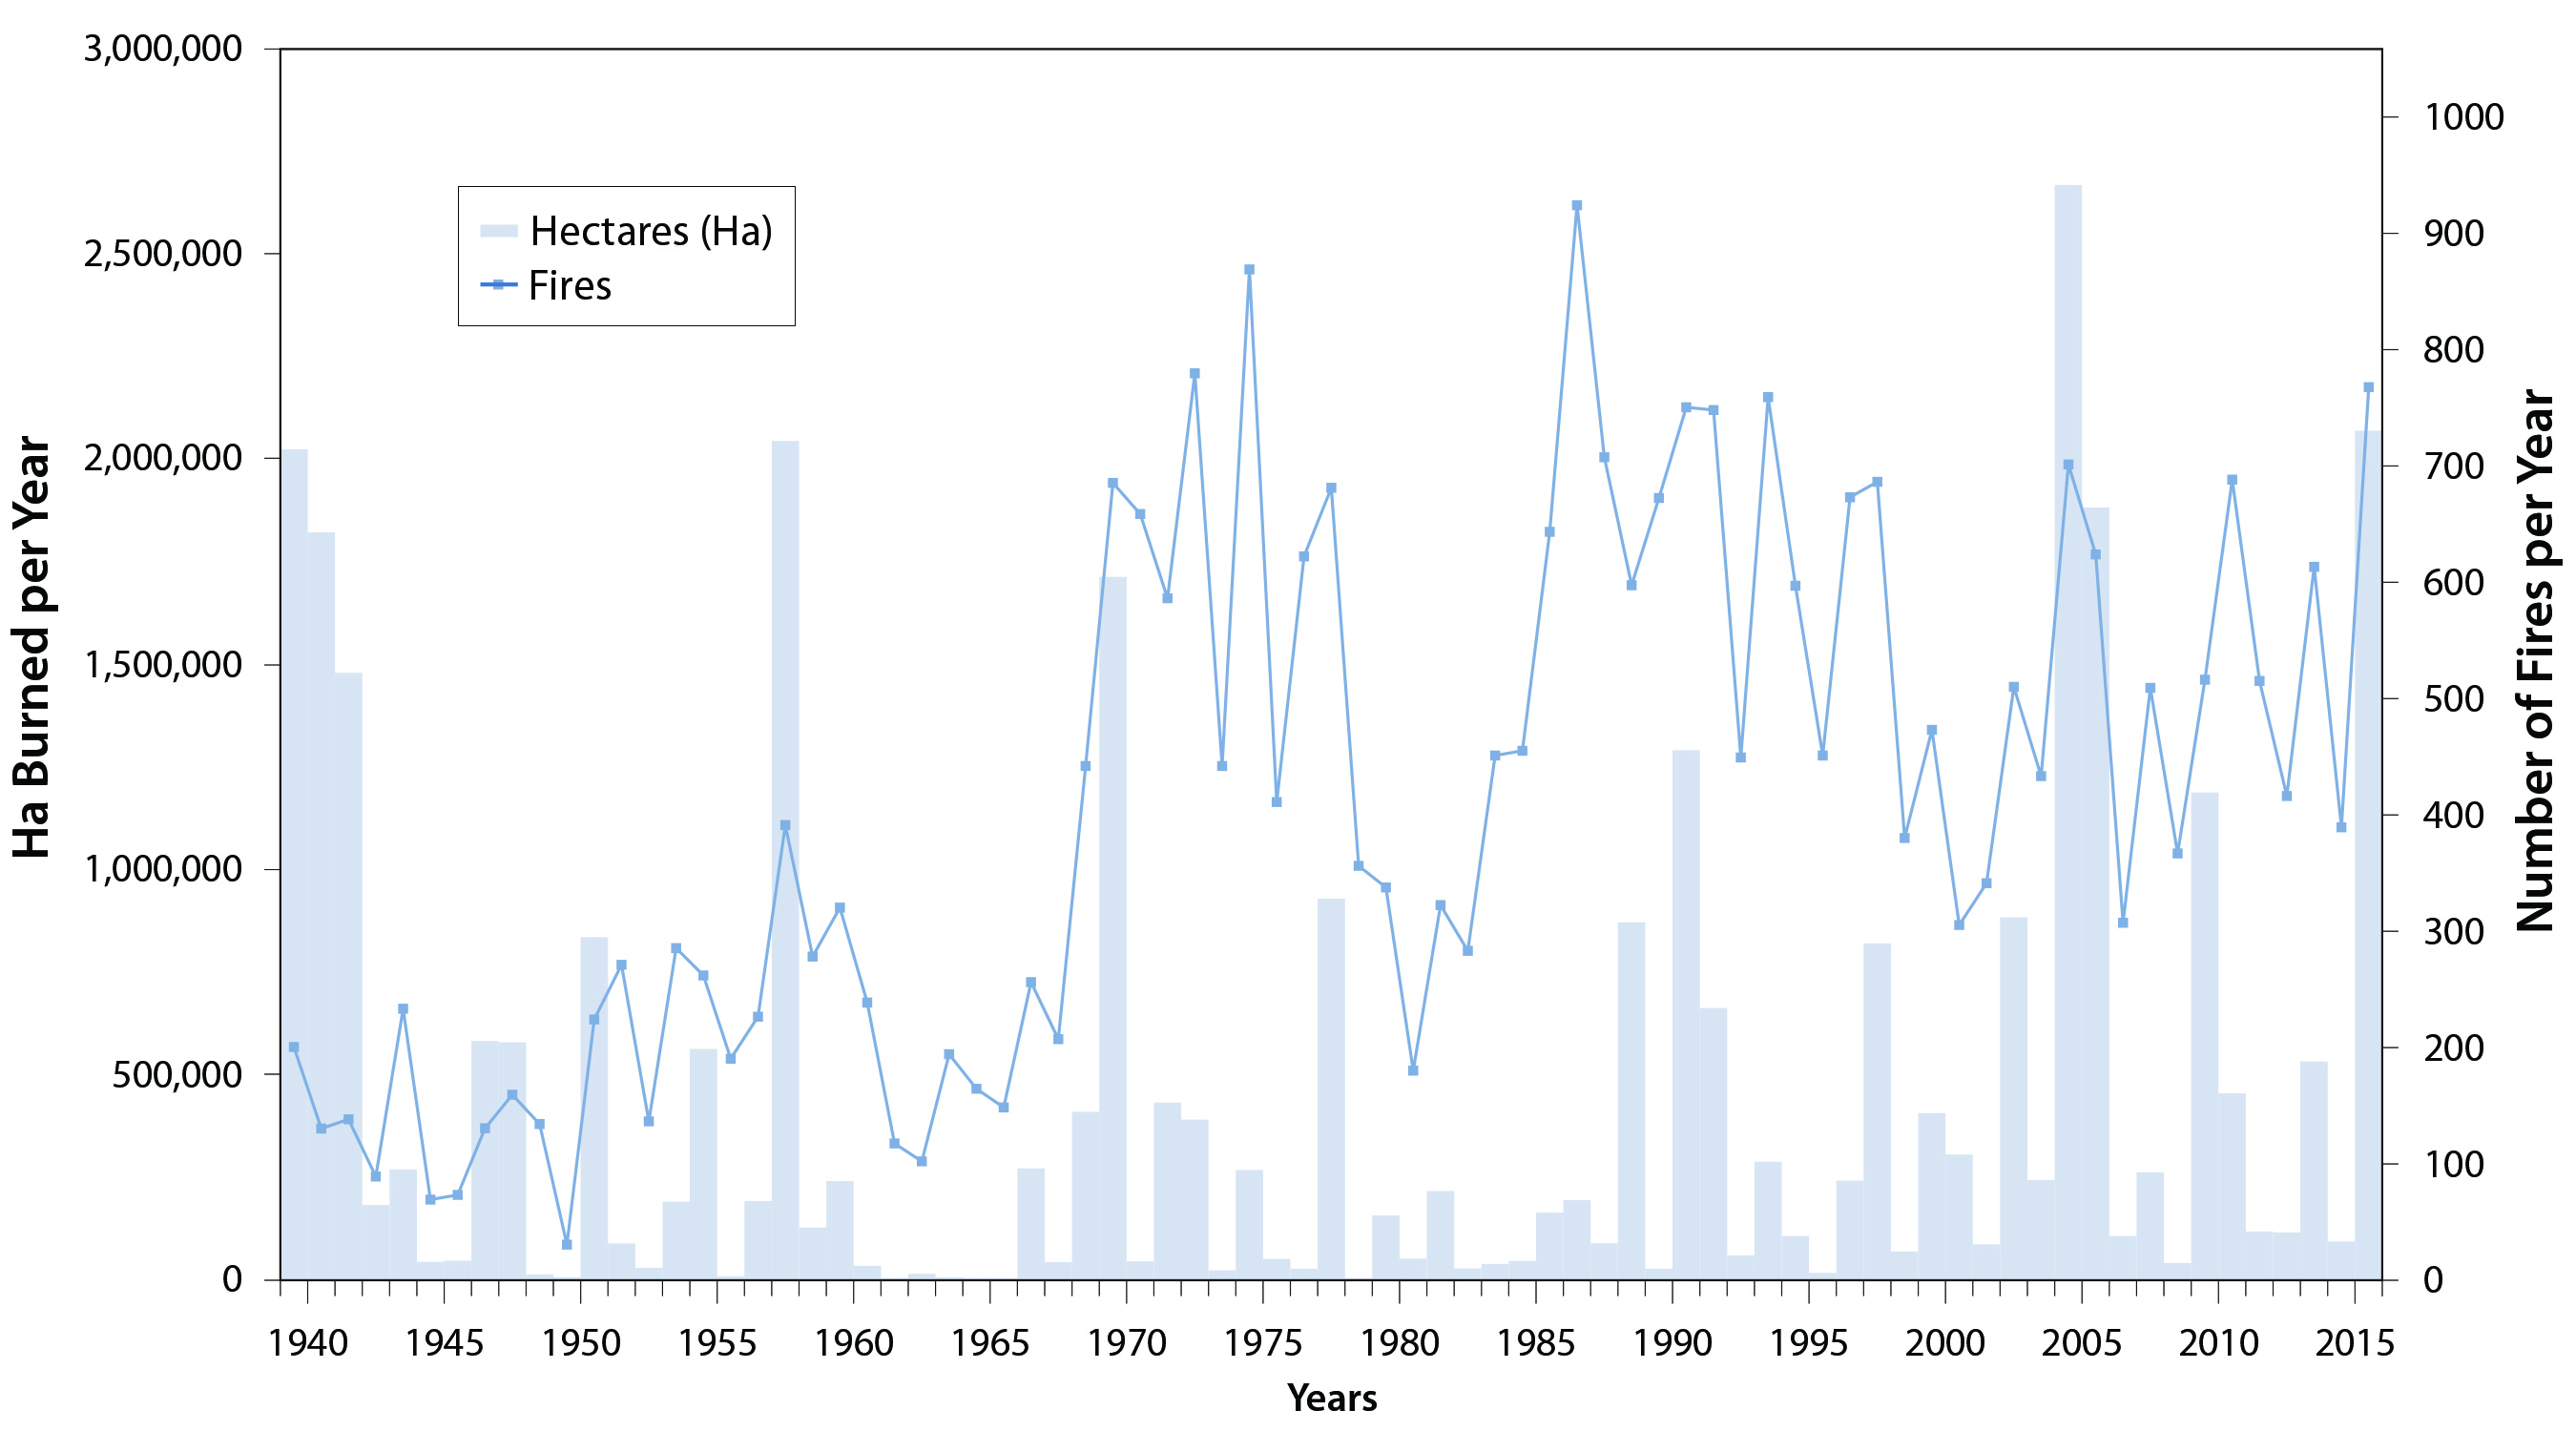
Of all pulse disturbance types, wildfire affects the most land area annually and is currently the best characterized at the regional to continental scale. Fire activity is intimately coupled to climatic variation in regions where fuel buildup is not limiting to burning (van Leeuwen et al., 2014). Recent climate warming has been linked to increased wildfire activity in the boreal forest regions of Alaska (see Figure 11.3; Kelly et al., 2013) and western Canada (Flannigan et al., 2009; Kasischke and Turetsky 2006), where fire has been part of historic disturbance regimes (Johnson 1992). Based on satellite imagery, an estimated 8 million hectares (ha) of boreal area was burned globally per year from 1997 to 2011 (Giglio et al., 2013; van der Werf et al., 2010). Roughly 50% of this burned area is forested; the rest is classified as low-density forest savanna, shrubland, or, in the case of boreal Eurasia, cropland. Eurasian boreal forests account for 69% of global boreal forest area and approximately 70% of the boreal area burned (Giglio et al., 2013). However, extreme fire years in northern Canada during 2014 and Alaska during 2015 doubled the long-term (1997 to 2011) average area burned annually in this region, surpassing Eurasia to contribute 60% of the global boreal area burned (Giglio et al., 2013; Mu et al., 2011; Randerson et al., 2012; van der Werf et al., 2010). These extreme North American fire years were balanced by lower-than-average area burned in Eurasian forests, resulting in a 5% overall increase in global boreal area burned. Decadal trends (Flannigan et al., 2009; Kasischke and Turetsky 2006) and paleoecological reconstructions (Kelly et al., 2013) support the idea that area burned, fire frequency, and extreme fire years are higher now than in the first half of the last century, or even the last 10,000 years.
Fire also appears to be expanding as a novel disturbance into tundra and forest-tundra boundary regions previously protected by cool, moist climate (Hu et al., 2010, 2015; Jones et al., 2009). The annual area burned in Arctic tundra is generally small compared to that in the forested boreal biome. However, the expansion of fire into tundra that has not experienced large-scale disturbance for centuries causes large reductions in soil carbon stocks (Mack et al., 2011), shifts in vegetation composition and productivity (Bret-Harte et al., 2013), and can lead to widespread permafrost degradation (Jones et al., 2015). In Alaska—the only region where estimates of burned area exist for both boreal forest and tundra vegetation types—tundra burning averaged approximately 0.3 million ha per year during the last half century (French et al., 2015), accounting for 12% of the average annual area burned throughout the state. Change in the rate of tundra burning projected for this century is highly uncertain (Rupp et al., 2016), but these regions appear to be particularly vulnerable to climatically induced shifts in fire activity. Modeled estimates range from a reduction in activity based on a regional process-model study of Alaska (Rupp et al., 2016) to a fourfold increase across the circumboreal region estimated using a statistical approach (Young et al., 2016).
Variability in northern fire regimes ultimately is a product of both climate and ecological controls over fuel characteristics and accumulation. Fire regime affects vegetation composition and productivity, creating the potential for fire-vegetation feedbacks to emerge that either increase or decrease fire activity at the regional scale. Although interannual variability in the fire regime is high across Alaska and western Canada, fire frequency and area burned have increased in recent years (Rupp et al., 2016). This trend is projected to continue for the rest of the century across most of this region for many climate scenarios, with the boreal region projected to have the greatest increase in total area burned (Balshi et al., 2009; Rupp et al., 2016). As fire activity increases, however, flammable vegetation, such as the black spruce forest that dominates boreal Alaska, is projected to decline as it is replaced by low-flammability deciduous forest. This shift in fuel flammability and accumulation rate could create regional-scale feedbacks that reduce the spread of fire on the landscape, even as the frequency of fire weather increases (Johnstone et al., 2011). In western Canada, by contrast, black spruce could be replaced by the even more flammable jack pine, creating regional-scale feedbacks that increase the spread of fire on the landscape (Johnson 1992). In tundra regions, graminoid (herbaceous, grass-like) tundra is projected to decrease in future climate scenarios, while flammable shrub tundra generally is projected to increase (Rupp et al., 2016). Similarly, tree migration into tundra could further increase fuel loading and flammability, creating novel fire regimes in these highly sensitive areas. Each of these scenarios has important implications for carbon release during fire.
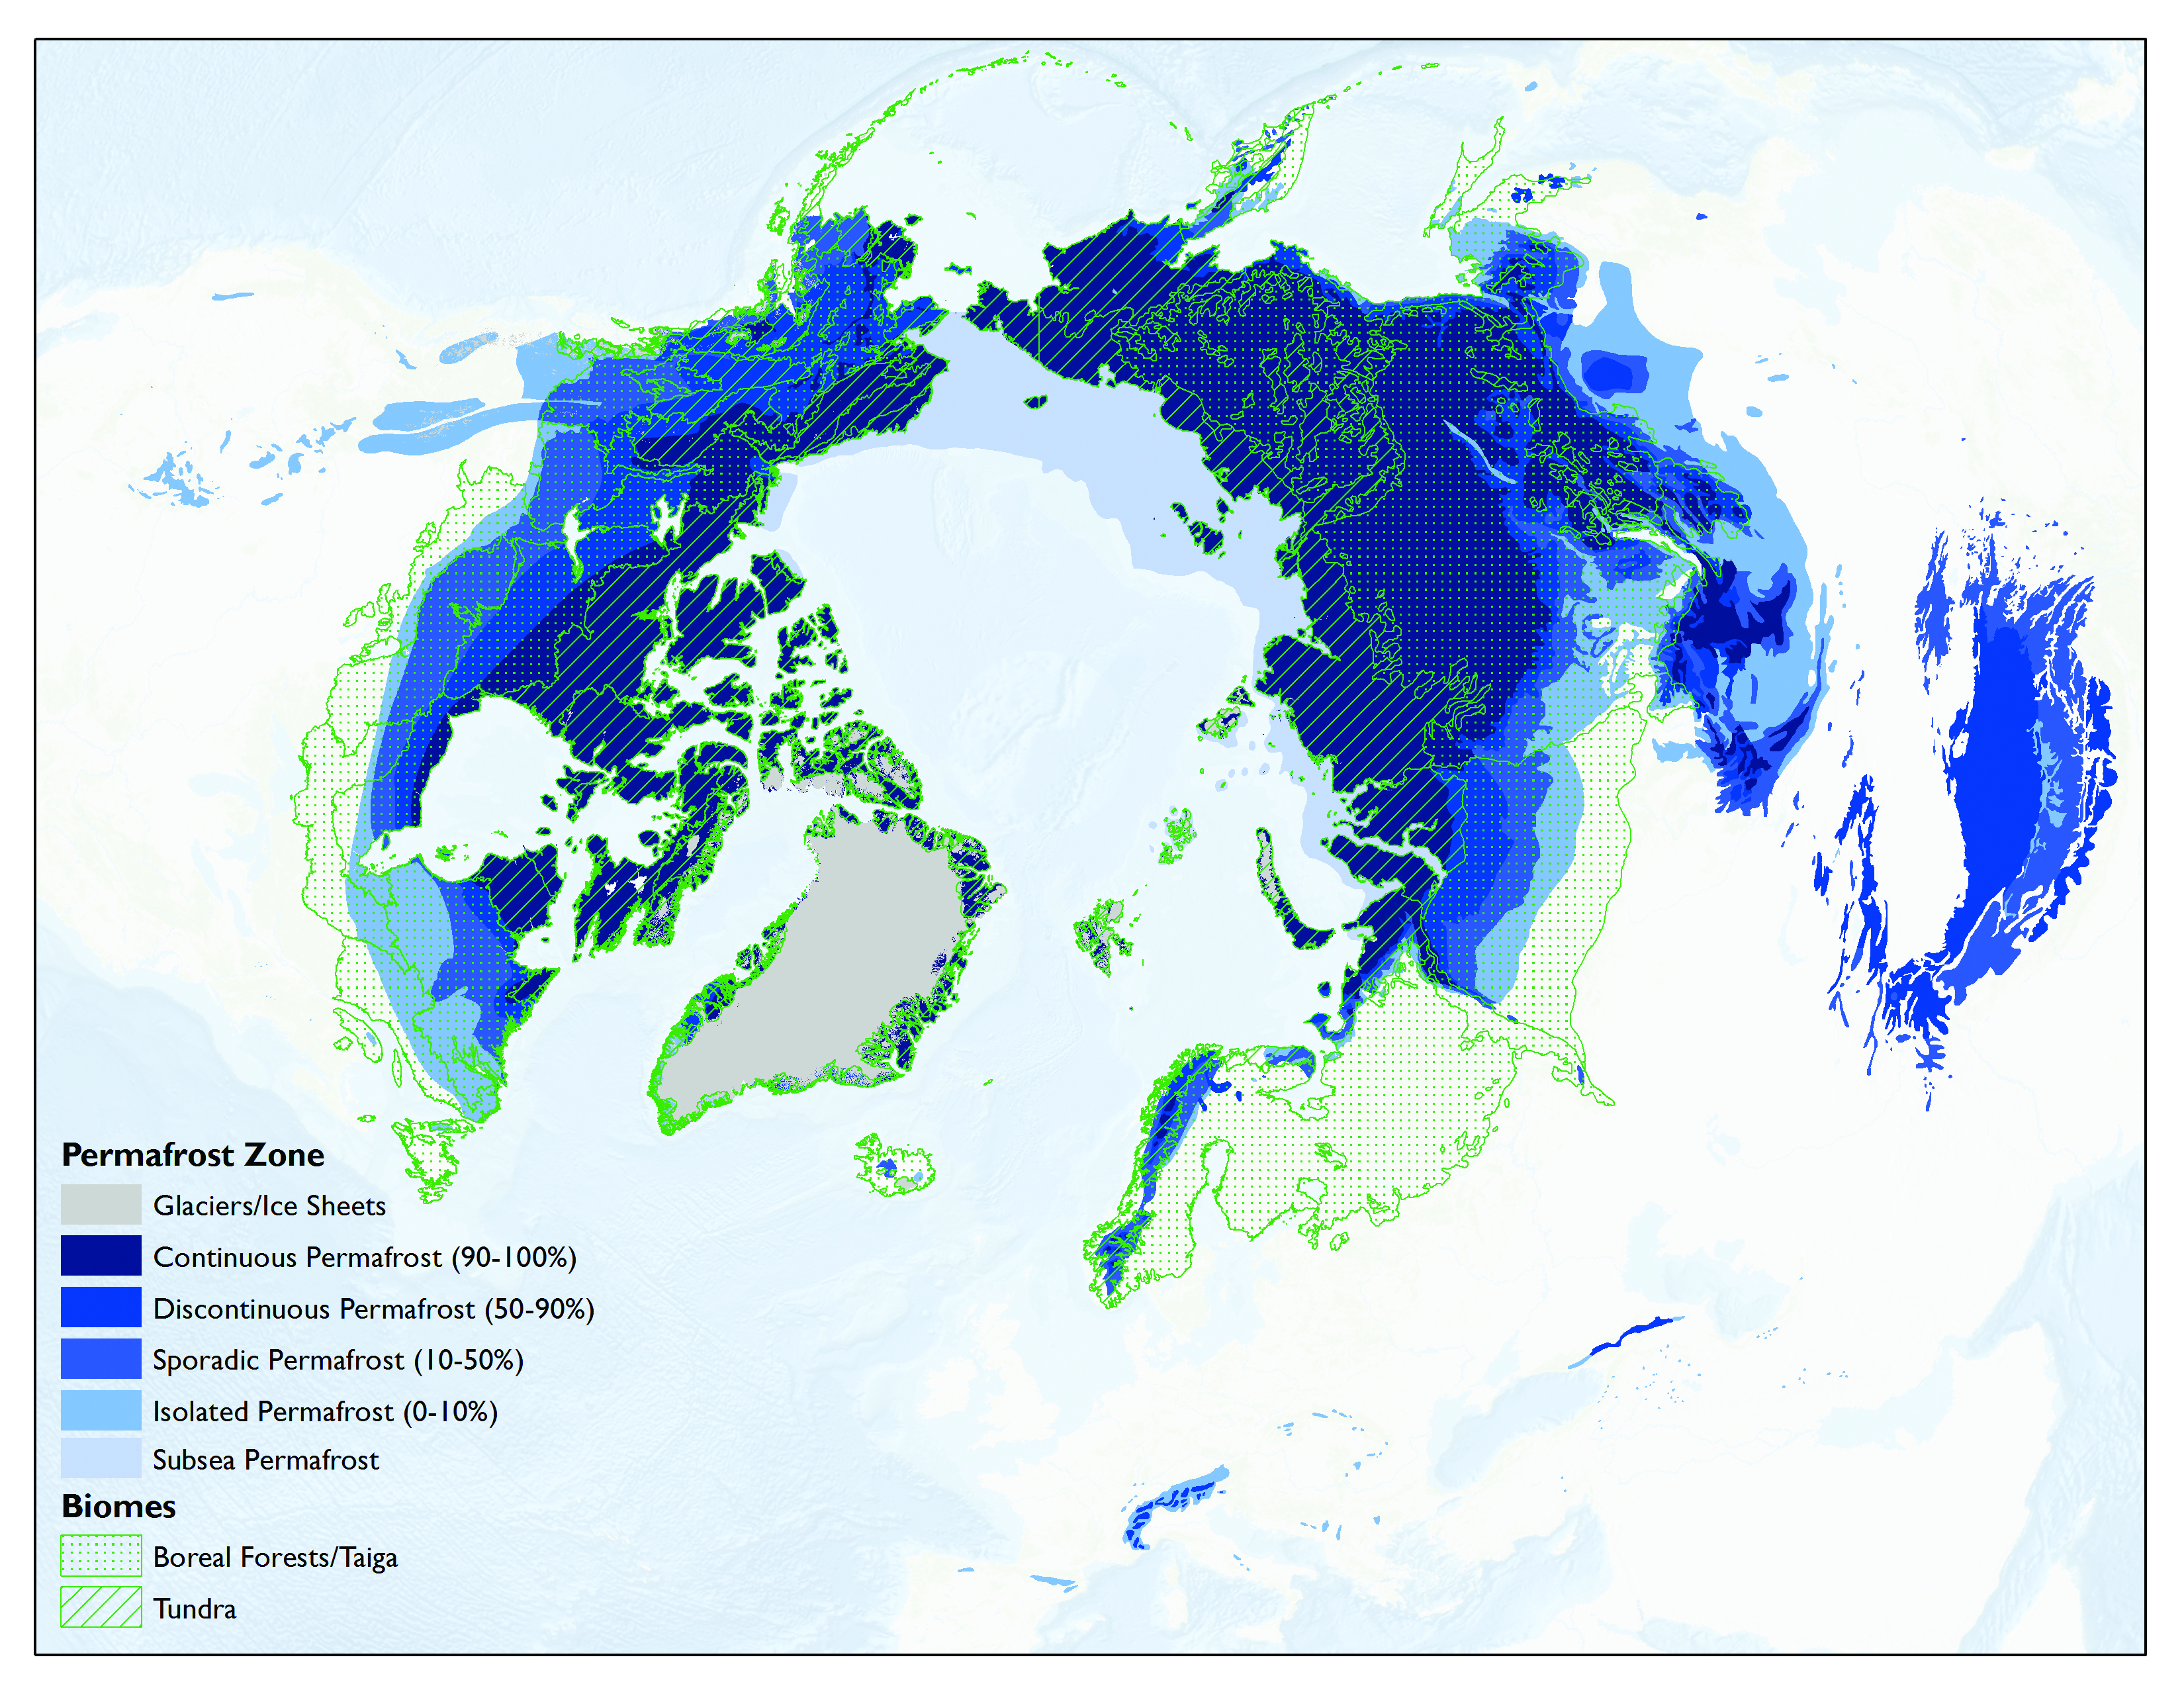
Most permafrost is located in the Northern Hemisphere, where the permafrost zone occupies 24% of the exposed land surface (22.8 × 10⁶ km2; Brown et al., 1998, revised February 2001; Zhang et al., 2000; see Figure 11.4). Within the Northern Hemisphere, 47% of the permafrost zone is classified as continuous permafrost, where >90% of the land surface is underlain by frozen ground. Another 19% is classified as discontinuous permafrost, where 50% to 90% of the land surface is underlain by frozen ground. The remaining 34% of the total permafrost zone is split between sporadic and isolated permafrost, where 10% to 50% and <10% of the land surface is underlain by frozen ground, respectively. Soils in this region cover 17.8 × 10⁶ km2; this subset of the entire permafrost zone excludes exposed bedrock, glaciers, ice sheets, and water bodies, which, with the exception of water bodies, contain little to no organic carbon stocks (Hugelius et al., 2014). Alaska, Canada, and Greenland comprise 39% of the soil area, and Eurasia (including Russia, Mongolia, and Scandinavia) comprises 61%. The northern circumpolar permafrost zone is used for soil carbon accounting and is largely comparable to most tundra and a large fraction of the boreal biome in the Northern Hemisphere but does not overlap with them completely (see Figure 11.4). Biome regions are used for vegetation carbon accounting and cover 5 × 10⁶ km2 (tundra) and 12 × 106 km2 (boreal forest), respectively (Jobbágy and Jackson 2000; Margolis et al., 2015; Neigh et al., 2013; Raynolds et al., 2012). The Tibetan plateau is outside of the geographical scope of this chapter described above. Permafrost underlays 1.35 × 10⁶ km2, 67% of the total plateau area, but is not classified within the tundra or boreal biome. Due to its permafrost, the soil carbon inventory is briefly discussed in this chapter in the context of the circumpolar permafrost zone soil carbon inventory.
The Arctic is remote and understudied compared with more populated areas of Earth. As a result, state-of-the-art quantification of carbon pools still is being conducted for current conditions rather than as repeat measurements through time. However, a few sites have been recording time-series measurements of carbon fluxes over a few decades, although with severely restricted spatial coverage considering the large geographical scale of this domain (e.g., see Belshe et al., 2013). Observation-based changes in carbon cycling extend back to the 1970s, and this chapter focuses on historical model simulations that estimate the 50-year period from 1960 to 2009. Forward projections typically span the time frame until 2100 using future climate projections based on emissions scenarios from the Intergovernmental Panel on Climate Change (IPCC).
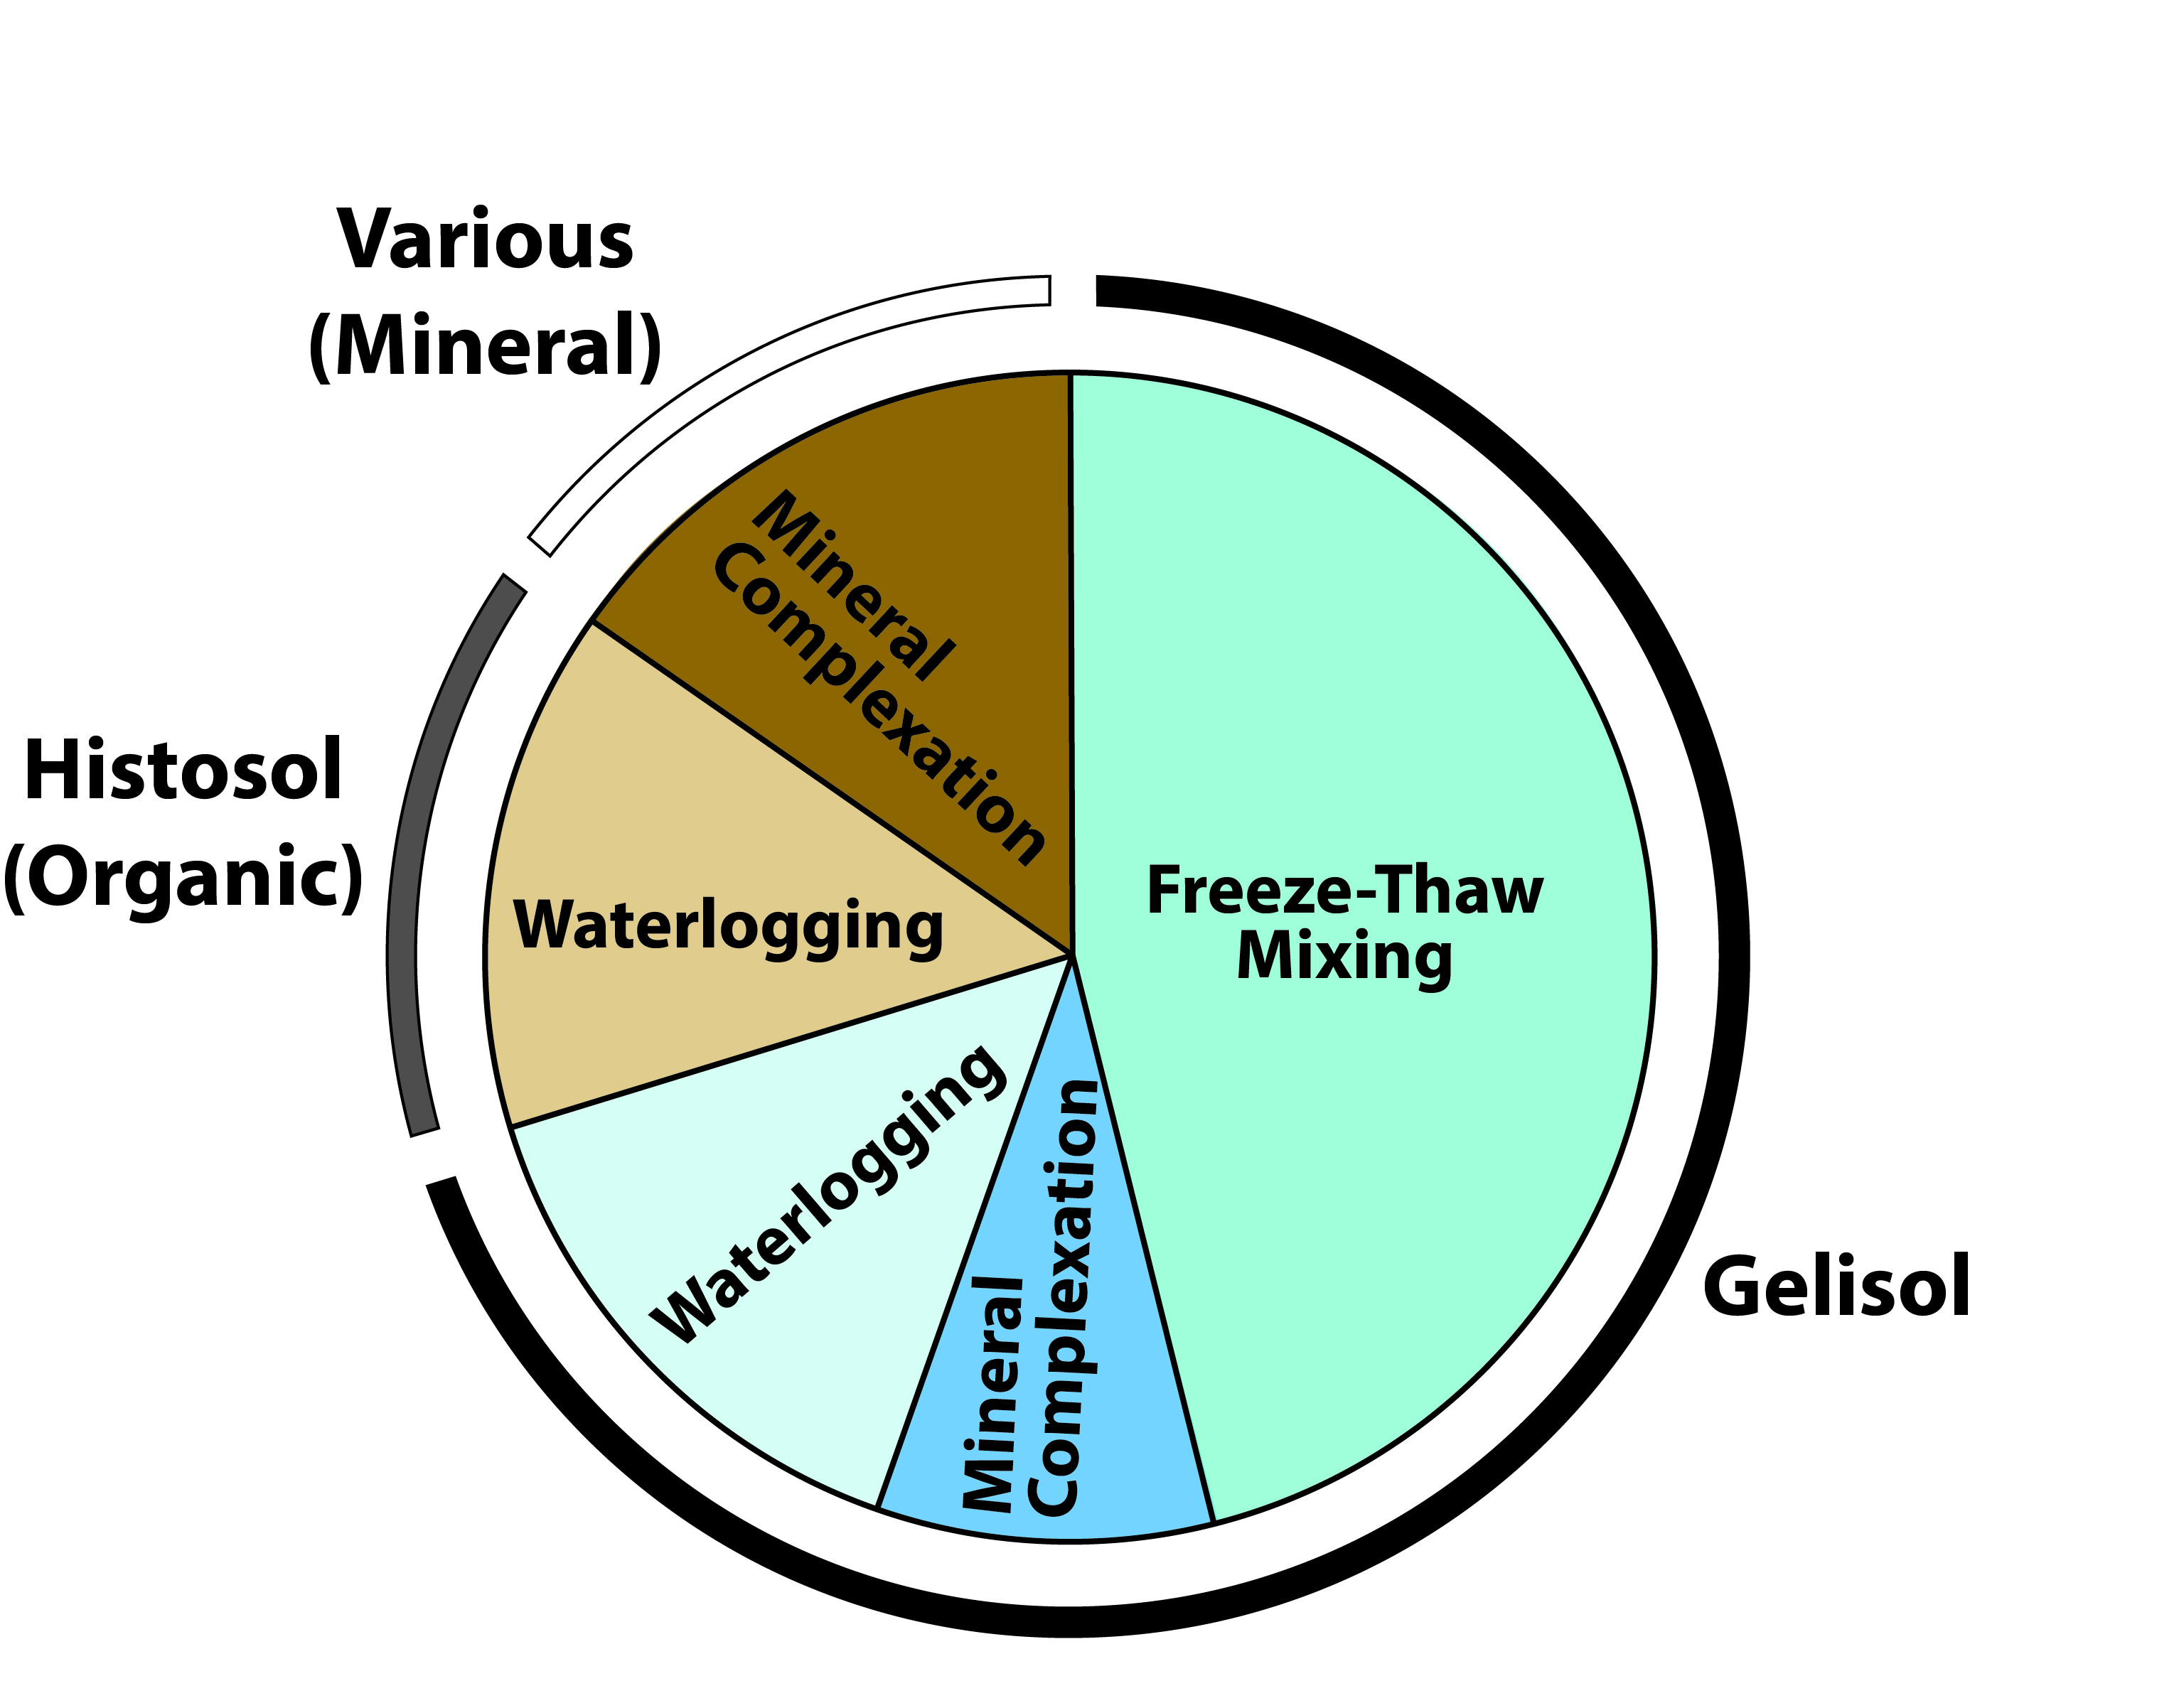
A unique feature of carbon pools in the northern permafrost zone compared with those in other biomes is the predominance of carbon stored in soils as a proportion of the total ecosystem carbon stock (Chapin et al., 2011). This feature partly arises from the harsh environmental conditions and short growing season that limit plant biomass. Boreal forest often is characterized by low tree density (i.e., stems per hectare) and small tree size, while tundra comprises low-statured vegetation including dwarf shrubs and graminoids with an understory of mosses (Dixon et al., 1994). Despite low plant biomass and low primary production (i.e., the amount of new carbon that plants transfer into the ecosystem annually), ecosystem carbon storage can be largely due to the tremendous quantity of carbon stored as soil organic matter. This organic matter is the remains of plants, animals, and microbes that have lived and died in these ecosystems over hundreds to thousands of years. Soil carbon accumulates in all systems (see Ch. 12: Soils), and the overall mechanisms of soil carbon preservation are the same at high latitudes (Post et al., 1982). What makes soil carbon density particularly high in these biomes is the combination of frozen soils (either seasonally in the surface soil active layer or perennially in the permafrost) and waterlogging that restricts the resupply of oxygen below ground (Gorham 1991; Jones et al., 2017; Treat et al., 2016). Cold and water-saturated conditions reduce organic matter decomposition rates, leading to substantial soil carbon accumulation even though annual inputs of new carbon by plants is relatively low (see Figure 11.5; Hobbie et al., 2000). In fact, water-saturated soils are a common feature of high-latitude ecosystems, even beyond those defined as wetlands. This saturation results from restriction of the downward movement of surface water by permafrost, creating a perched water table within the soil profile of mesic and drier upland ecosystems as well as lowland ecosystems. Waterlogged and frozen conditions slow both microbial decomposition and combustion by fire, which are primary mechanisms returning carbon from the soil back to the atmosphere. Both of these environmental conditions that slow decomposition increase in magnitude, intensity, and effect moving down into the soil profile. In addition, soil waterlogging also helps to control whether carbon returns to the atmosphere as carbon dioxide (CO2) or methane (CH4), both of which are important GHGs exchanged between high-latitude terrestrial ecosystems and the atmosphere.
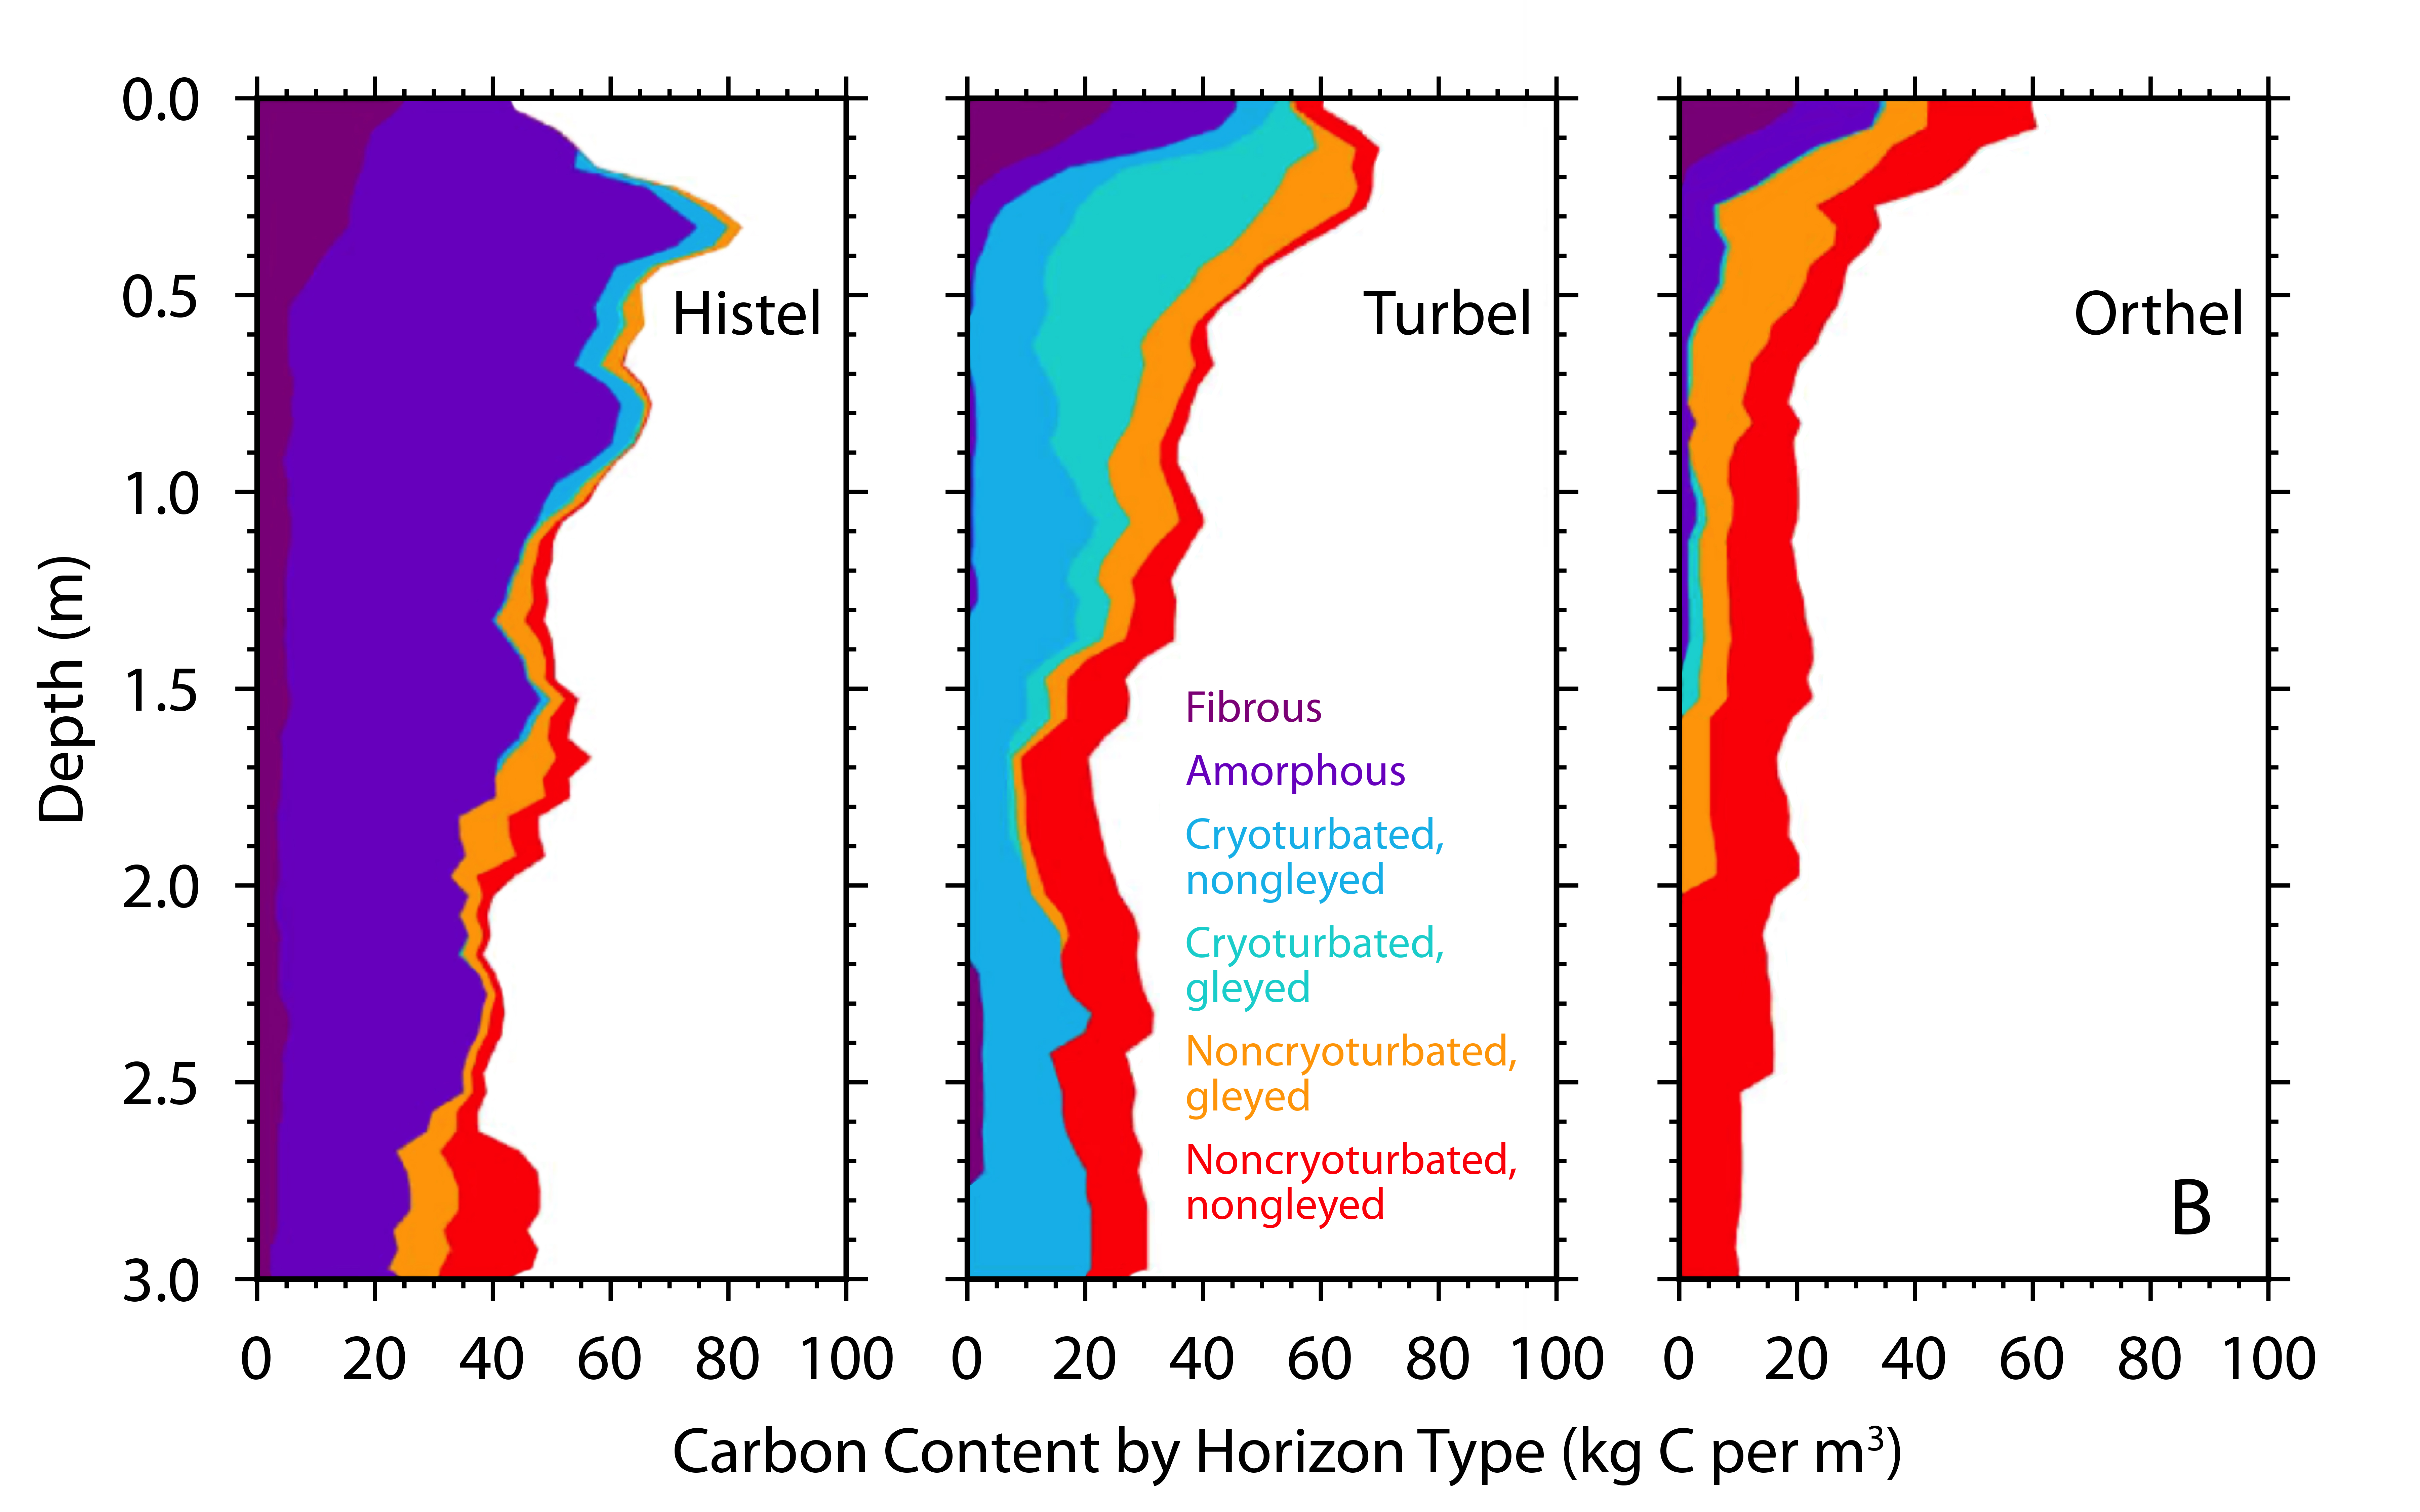
Several features of soil development in the permafrost zone have the effect of transporting carbon from the surface (where it enters the ecosystem through plant tissue turnover and mortality) to depth (see Figure 11.6; Schuur et al., 2008). Freeze-thaw mixing (cryoturbation) occurs in permafrost soils. Cold air temperatures in the fall begin freezing soils from the surface downward, while the permafrost at depth simultaneously refreezes soils at the base of the active layer upward. This process exerts pressure on the middle soil layer that can push soil upward to release pressure through cracks to the surface. As a result, surface carbon is mixed at high concentrations deeper into the soil profile than it otherwise would have been, effectively increasing the limiting factors of temperature and waterlogging on decomposition. Another landscape-level feature of soil development that leads to relatively high carbon at depth is the upward accumulation of soil and permafrost that occurs in high latitudes, particularly regions not covered by ice during the last glacial period, which peaked roughly 20,000 years ago (Schirrmeister et al., 2002). Ice sheets covered large areas of Canada, Eurasia, and Greenland, but in Alaska, Siberia, and Beringia (i.e., the land connection between the two continents that was exposed by lower sea levels), a large swath of land remained free of ice because of dry conditions and low precipitation. These unglaciated areas received deposits of silt material generated at the margins of ice sheets and glaciers and transported by wind and water. Sediment accumulated in some areas at rates of centimeters per year, which effectively increased soil surface elevation. Permafrost depth in these soils is controlled, in part, by the insulating effect of the overlying soil, and, with increased soil elevation, the permafrost table also moved upward, which trapped plant roots and other organic matter at depth into permafrost (Zimov et al., 2006). Additionally, these soils accumulated carbon over tens to hundreds of thousands of years, whereas ecosystems covered by ice sheets in the Last Glacial Maximum only started accumulating their current soil carbon stocks since the transition to the Holocene (Harden et al., 1992). Length of time for carbon accumulation, however, is not as important as some of the direct limits to microbial decomposition, in terms of overall soil carbon stocks. For example, large areas such as the Hudson Bay Lowlands and the Western Siberian peatlands accumulated high carbon stocks since the retreat of ice sheets in the last 10,000 years because of persistent waterlogged conditions (Smith et al., 2004; Loisel et al., 2014). Lastly, the direct human footprint on carbon pools and fluxes in this region is small relative to other biomes. More than 80% of tundra and boreal biomes fall into the land-use categories of “remote forest,” “wild forest,” “sparse trees,” and “barren” (Ellis and Ramankutty 2008). Forest harvest is the primary land-use activity affecting ecosystem carbon, with fire management also playing a role, but both occur on a relatively small proportion of the overall region. More broadly, impacts to the region’s carbon cycle more likely occur indirectly through 1) changes in climate, such as temperature, precipitation, and growing season length; 2) changes in pulse disturbances, such as wildfires, abrupt thaw, and insects; and 3) rising atmospheric CO2, which has the potential to alter ecosystems everywhere.
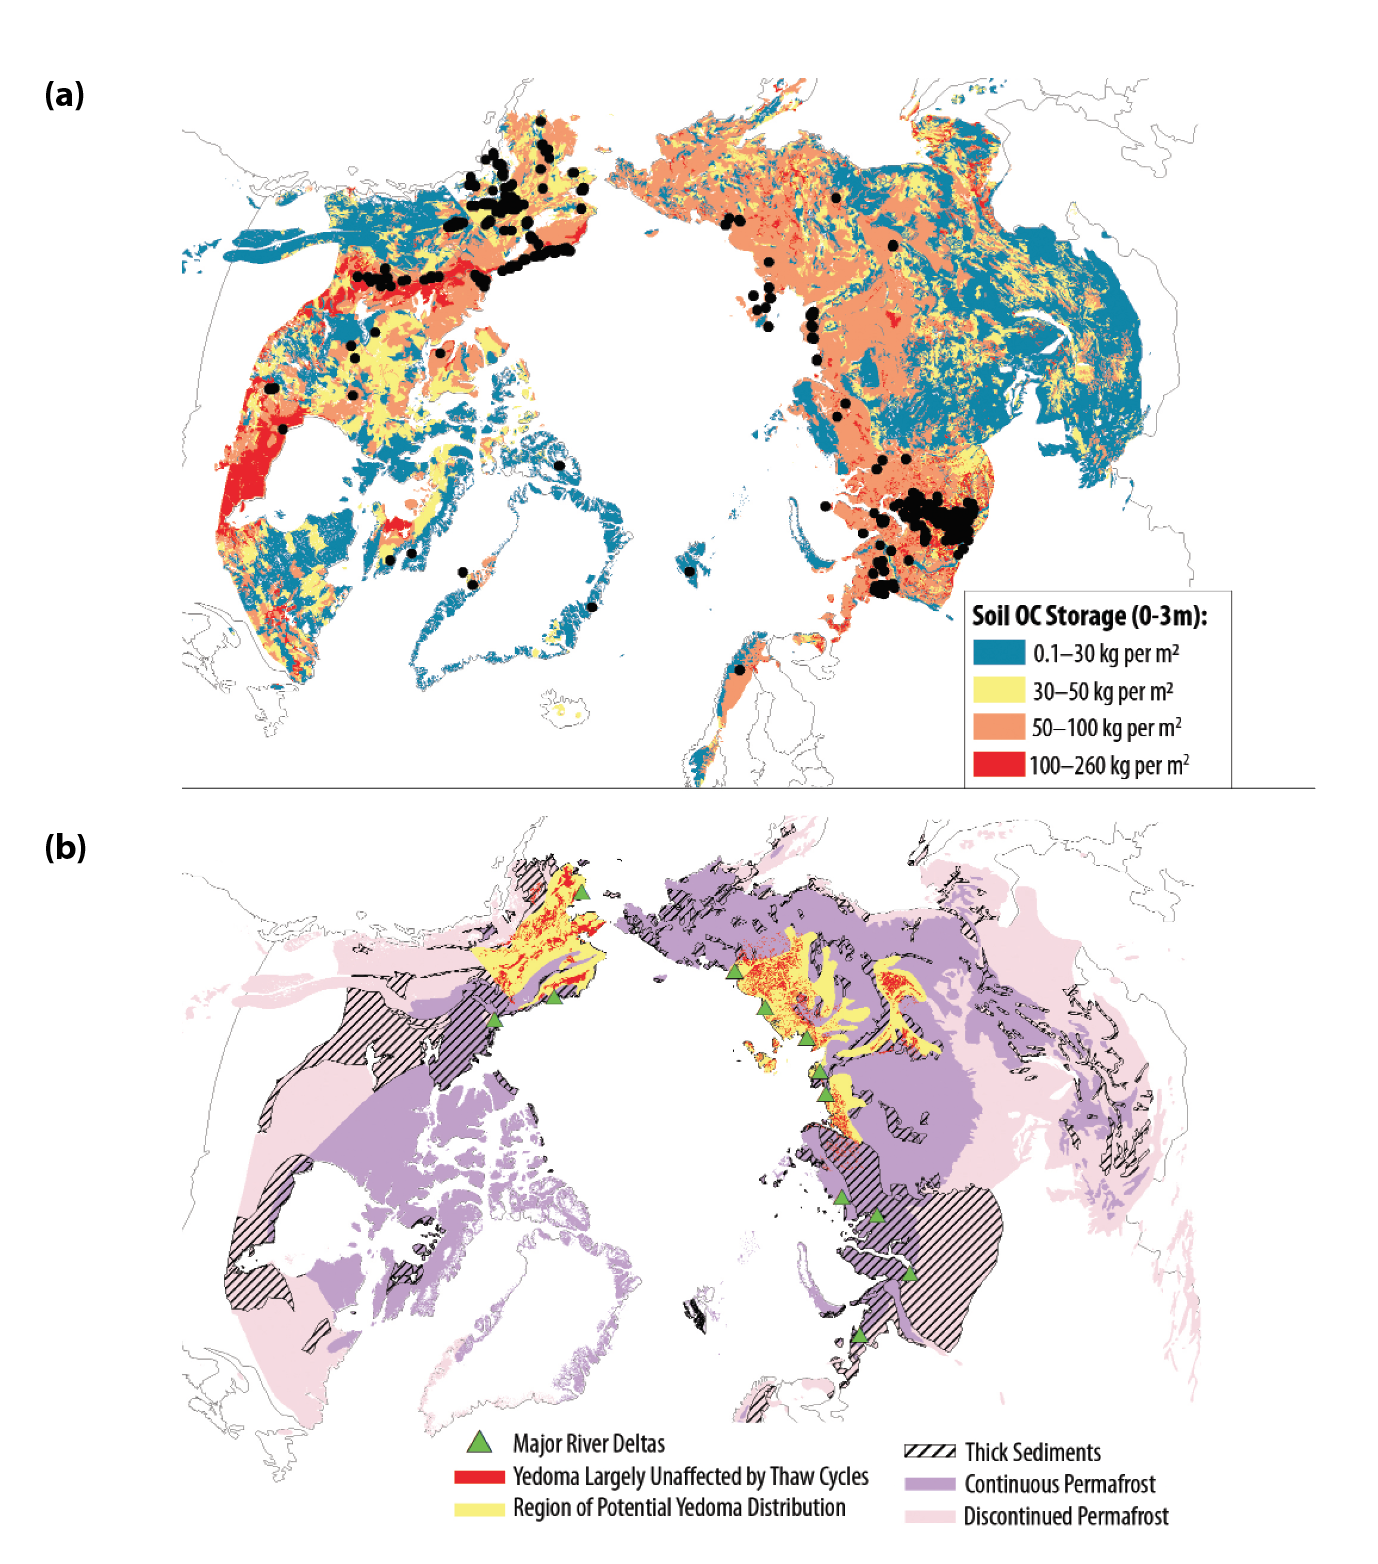
The total pool of organic carbon stored in permafrost zone soils comprises carbon frozen at depth in peatlands (>20% carbon) and carbon mixed with mineral soils (<20% carbon). Each type dominates different locations in the Northern Hemisphere, depending on physiographic and environmental characteristics (Gorham 1991; Jobbágy and Jackson 2000; Mishra and Riley 2012; Post et al., 1982; Tarnocai et al., 2009). Recent work has shown permafrost soil carbon pools to be much larger at depth than previously recognized because of cryogenic (freeze-thaw) mixing (Bockheim and Hinkel 2007; Ping et al., 2008) and sediment deposition (Schirrmeister et al., 2002, 2011; Zimov et al., 2006). In particular, the 1.2 × 10⁶ km2 “yedoma” region (i.e., areas of Siberia and Alaska that remained ice-free during the last Ice Age) contains accumulated silt (loess) soils many meters thick. Even though carbon concentrations of these mineral soils are not remarkably high (0.2% to 2% carbon), the depths of these sediments give rise to large carbon inventories.
The current best estimate of total soil organic carbon (terrestrial) in the northern circumpolar permafrost zone is 1,460 to 1,600 petagrams (Pg; 1 Pg = 1 billion metric tons; Hugelius et al., 2014; Schuur et al., 2015; Strauss et al., 2017). This inventory includes all soil orders within the permafrost zone and thus also counts carbon in nonpermafrost soil orders, active-layer carbon that thaws seasonally, and peatlands. All permafrost zone soils estimated to 3 m in depth contain 1035 ± 150 Pg of carbon (C; see Table 11.1 and Figure 11.7a). Based on somewhat earlier estimates for the 1-m inventory, two-thirds of the soil carbon pool is in Eurasia, with the remaining one-third in North America, including Greenland (Tarnocai et al., 2009).
Soil Orders | Soil Suborders | Soil Carbon Pool Pg C, 0 to 3 m in depth) |
Area (×106 km2 |
---|---|---|---|
Gelisol | Turbels | 476 | 6.2 |
Orthels | 98 | 2.5 | |
Histels | 153 | 1.4 | |
Histosol, Organic | 149 | 0.9 | |
Non-Gelisol, Mineral | 158 | 6.8 | |
Total Circumpolar | 1,035a | 17.8 |
Soil suborders are shown for Gelisol (permafrost soil order) only, but soil carbon (petagrams of carbon [Pg C]) in this zone also is contained in Histosol (peat soil) and non-Gelisol soil orders (various). Data are from Hugelius et al. (2014).
Notes
a Total is different from the sum due to rounding.
New synthesis reports account for 327 to 466 Pg C in deep loess (wind- and water-borne) sediment accumulations below 3 m in Siberia and Alaska (Strauss et al., 2013, 2017; Walter Anthony et al., 2014; Zimov et al., 2006; see Figure 11.7b). This yedoma region contains both intact yedoma deposits that have remained primarily frozen since the last glacial period and deposits where abrupt thaw led to ground subsidence (thermokarst) and lake formation. These thermokarst lake deposits later refroze into permafrost when the lakes drained. The carbon density of intact yedoma is now thought to be lower than previously estimated because of revisions in soil bulk density estimates to account for excess pore ice (Schirrmeister et al., 2011). In contrast, thermokarst lake deposits previously believed to have depleted soil carbon stocks are now thought to have accumulated net soil carbon (Walter Anthony et al., 2014). The discovery of increased net soil carbon as a result of the thermokarst lake cycle compensated in part for the downward revision of the carbon pool contained in intact yedoma (Strauss et al., 2013; Walter Anthony et al., 2014). The range here represents different methodologies for scaling carbon pools and also accounts for carbon remaining in thawed sediments below currently existing lakes (high estimate only).
River deltas are now thought to contain 96 ± 55 Pg C, a quantity much less than originally estimated for these deep deposits (Hugelius et al., 2014; Strauss et al., 2017; Tarnocai et al., 2009). However, other deep sediment deposits located over 5 × 10⁶ km2 outside the yedoma and delta areas are not included in the total soil carbon stock reported here. Simple calculations based on extremely limited data suggest that these regions may roughly contain an additional 350 to 465 Pg C, but more sampling and data synthesis are needed to verify or revise estimates of these potential deep permafrost carbon deposits (Schuur et al., 2015; see Figure 11.7b).
Two additional pools of permafrost carbon are not included in the permafrost carbon pool summarized previously. The first are new estimates for the permafrost region of the Tibetan plateau that are built on earlier work (Wang et al., 2008), which now place 15.3 Pg C in the top 3 m of soil (Ding et al., 2016). This new carbon inventory extended deep carbon measurements substantially and used improved upscaling techniques, resulting in a somewhat smaller inventory for Tibetan permafrost than had been reported previously (Mu et al., 2015). An additional 20.4 Pg C are contained in 1-m inventories of permafrost soils in northern China estimated by earlier first-order inventories (Luo et al., 2000) for a total of 35.7 Pg C for this region as a whole.
The second uncounted pool is a reservoir of organic carbon in permafrost stored on the continental shelf under the Arctic Ocean (Brown et al., 1998—revised February 2001; Rogers and Morack 1980). This undersea permafrost carbon initially formed on land as the continental shelf was exposed when sea level was approximately 120 m lower during the last glacial period (Walter et al., 2007). Subsequent inundation of this area at the Pleistocene-Holocene transition started thawing this loess permafrost (Rachold et al., 2007). No reliable published estimates exist for the total organic carbon in this subsea pool (setting aside inorganic CH4 clathrates), but yedoma deposits are thought to have covered much of the shallow shelf during its exposure. Although there are no shelf carbon inventories comparable to those for land, the shallow shelf area exposed as dry land in the area around Alaska and Siberia during the last Ice Age (currently 125 m deep in the ocean) is almost 3 × 10⁶ km2, or about 2.5 times the size of the current terrestrial yedoma region (Brosius et al., 2012; Strauss et al., 2013). At the same time, submergence over thousands of years helped thaw permafrost, exposing organic carbon to decomposition, potentially under anaerobic conditions. These processes and conditions would have converted a portion of the carbon pool to CO2 and CH4, leaving an unknown quantity of organic carbon remaining in both the sediment and the permafrost that persists under the ocean.
Soils in the top 3 m of the rest of Earth’s biomes (excluding Arctic and boreal biomes) contain 2,050 Pg organic carbon (Jobbágy and Jackson 2000). The soil carbon quantified here from the northern circumpolar permafrost zone adds another 50% to this 3-m inventory, even though it occupies only 15% of the total global soil area (Schuur et al., 2015). Making this comparison with deposits deeper than 3 m (such as those in yedoma) is difficult because deeper deposits are not always as systematically quantified in soil carbon inventories outside the permafrost zone. Assuming that permafrost has preserved deep carbon stocks at higher levels than elsewhere on Earth, the proportion of total soil carbon contained in the northern circumpolar permafrost region could be even larger.
Most carbon stored in the vegetation of northern high latitudes is in boreal forests, which account for one-third of global forests (Pan et al., 2011). Nonsoil carbon pools of the boreal forest consist of deadwood, litter, and above- and belowground live biomass (Pan et al., 2011). The boreal zone, generally defined by latitudes between 45°N and 70°N (Margolis et al., 2015; McGuire et al., 2009; Neigh et al., 2013), is characterized by tundra at the northern boundary and temperate forest, steppe, or prairie at the southern boundary (see Figure 11.4). Spruce, pine, and fir are typical coniferous tree species within the boreal zone mixed with deciduous species of larch, birch, alder, and aspen (Neigh et al., 2013). The North American boreal zone spans a total area of 3.73 × 10⁶ km2, which is one-third of the entire circumpolar boreal zone (11.35 × 10⁶ km2 to 11.93 × 10⁶ km2; see Table 11.2; Neigh et al., 2013; Pan et al., 2011). Biomass estimates for boreal forests mostly exclude root biomass because it is not measured in many inventories. This chapter uses a ratio of 0.27 for root-to-total phytomass (Saugier et al., 2001) and calculates total carbon pools for the boreal zone (see Table 11.2). Numbers are presented for Alaska, eastern and western Canada, and the circumpolar North using the aboveground biomass values reported in Margolis et al. (2015) and Neigh et al., (2013), which combine satellite light detection and ranging (LIDAR), airborne LIDAR, and ground plot estimates.
Vegetation Type | Region/Ecosystem | Vegetation Carbon Pool (Pg C) | Area (× 106 km2) |
---|---|---|---|
Boreal Forest | Alaska | ||
Wetlands | 0.09 | 0.06 | |
Hardwood | 0.3 | 0.05 | |
Conifer | 0.79 | 0.21 | |
Mixed Wood | 0.24 | 0.05 | |
Burned | 0.02 | 0.01 | |
Total Alaska | 1.51 | 0.37 | |
Canada | |||
Wetlands | 1.61 | 0.78 | |
Hardwood | 1.84 | 0.27 | |
Conifer | 6.87 | 1.7 | |
Mixed Wood | 3.05 | 0.53 | |
Burned | 0.14 | 0.04 | |
Total Canada | 13.56 | 3.36 | |
Circumboreal | |||
Wetlands | 2.21 | 1.25 | |
Hardwood | 2.44 | 0.37 | |
Conifer | 27.6 | 7.28 | |
Mixed Wood | 19.26 | 2.84 | |
Burned | 0.48 | 0.18 | |
Total Circumboreal | 52.05 | 11.93 | |
Tundra | Alaska | 0.35 | 0.48 |
Canada | 1.01 | 2.34 | |
Total Circumpolara | 3.17 | 4.98 |
Boreal forest vegetation carbon includes carbon in above- (Neigh et al., 2013) and belowground live biomass. Belowground numbers were calculated based on root–to–total biomass ratios (after Saugier et al., 2001). Ratios are 0.27 for boreal forests and 0.62 for tundra biomass. Tundra area data exclude ice caps and large water bodies (Raynolds et al., 2012). Estimates for deadwood carbon and litter carbon pools are reported in the main chapter text. Totals are reported from the original publication (Neigh et al., 2013) and, in some cases, may not match the component sums exactly due to rounding differences.
Notes
a Total circumpolar also includes estimates for Eurasia (data not shown). Eurasia quantities are equivalent to the total minus
Half the carbon in Alaska and Canada’s boreal zone is stored in coniferous forests; this is also true for the entire circumpolar region (7.66 Pg C in North America; see Table 11.2). The second largest forest type is “mixed wood” (i.e., coniferous and deciduous trees) followed by “hardwood” (i.e., deciduous trees), which together account for 35% to 42% of the total boreal vegetation carbon stocks. A small portion of vegetation carbon in the boreal zone is found in the biomass of wetlands (5% to 12%) and in burned areas (about 1%). A separate synthesis reported 14.0 Pg C for all living biomass (both above and below ground) in Canada, covering 2.29 × 10⁶ km2; Pan et al., 2011). Estimates for that synthesis were based on forest inventory data; growth and yield data; and data on natural disturbances, forest management, and land-use change. Because forest inventory data were used, areas covering 1.18 × 10⁶ km2 of unmanaged boreal forest in Canada and 0.51 × 10⁶ km2 of unmanaged forest in Alaska were excluded, but, in general, the stock-based carbon numbers are similar to the remotely sensed estimates for Canada and the circumpolar North. Discrepancies in carbon pools could arise from different measurement approaches and the known limitations of satellite-based LIDAR measurements in steep topography (Margolis et al., 2015).
The Arctic tundra vegetation zone is north of the boreal tree line, extending all the way above 80°N latitude in the Canadian High Arctic and is described in detail in the circumpolar Arctic vegetation map (see Figure 11.4; Walker et al., 2009). Recent estimates quantified a total vegetated area of 4.98 × 10⁶ km2 in the circumpolar tundra zone, of which a little less than half is in Canada and about 10% in Alaska (see Table 11.2; Raynolds et al., 2012). Tundra vegetation mostly consists of shrubland, peaty graminoid tundra, mountain complexes, barrens, graminoid tundra, prostrate shrubs, and wetlands (Walker et al., 2009). Using a relationship of aboveground biomass and the normalized difference vegetation index (NDVI), the North American tundra zone is estimated to contain 1.03 Pg C in aboveground plant biomass (0.27 Pg C in Alaska and 0.76 Pg C in Canada; Raynolds et al., 2012). Assuming that 62% of the total tundra biomass is below ground (Saugier et al., 2001) and half the biomass is carbon (Epstein et al., 2012), there is a total carbon stock of 1.36 Pg C contained in North American tundra vegetation (see Table 11.2). For the entire circumpolar region, this amount is equal to 3.17 Pg C. There is an offset in land area between the soil carbon and vegetation carbon estimates of 0.89 × 10⁶ km2, which is likely either non-Arctic (sub-Arctic or alpine) tundra or sparse conifer forest (taiga). Using tundra carbon pools as a low-end estimate, there could be another 0.57 Pg C in vegetation biomass contained on these lands but not reported in Table 11.2.
Earlier estimates for vegetation carbon in northern high latitudes reported 5 Pg C in Alaska, 12 Pg C in Canada, and 60 to 70 Pg C for the circumpolar North (McGuire et al., 2009). Although previous carbon estimates for Canada and the circumpolar North are relatively similar to the new remotely sensed and inventoried estimates reported here, the 5 Pg C estimate for Alaska is higher. Combining the latest boreal and tundra vegetation estimates, North American high-latitude areas, which are 30% of the entire circumpolar region, contain 16.43 Pg C in vegetation (15.07 Pg C boreal; 1.36 Pg C tundra).
Deadwood and litter are two nonsoil carbon pools poorly constrained by data at regional and continental scales. The deadwood pool has been estimated (in 2007) at 16.1 Pg C for a region of the boreal forest covering 11.35 × 10⁶ km2, again excluding 1.18 × 10⁶ km2 of unmanaged boreal forest in Canada and 0.51 × 10⁶ km2 of unmanaged forest in Alaska (Pan et al., 2011). This same boreal region was estimated to contain a litter carbon pool of 27.0 Pg C, which together with deadwood represents at least 83% of the carbon contained in the living above- and belowground biomass. An older modeling study estimated tundra litter to contribute 2 Pg C at the circumpolar scale (Potter and Klooster 1997).
Changes in soil and vegetation carbon pools are a result of changing carbon fluxes over time. In the absence of pulse disturbances, CO2 exchange between ecosystems and the atmosphere is the major pathway of carbon input and output (Chapin et al., 2006). Carbon dioxide enters ecosystems via plant photosynthesis and is returned to the atmosphere through respiration of plants and all heterotrophic organisms that depend directly or indirectly on energy contained in plant biomass. Over the past few centuries to millennia, tundra and boreal ecosystems acted as net carbon sinks at the regional scale, as the amount of carbon released by respiration was smaller than that absorbed by photosynthesis. Vegetation biomass is likely to have reached peak amounts over decades to perhaps a century or more. In contrast, soils act as a long-term (i.e., century to millennia) carbon sink as carbon continues to accumulate as dead organic matter (Harden et al., 1992). Carbon accumulation resulting from the net difference between photosynthesis and respiration also is punctuated by periods of abrupt loss catalyzed by ecological disturbances. In the tundra and boreal biomes, large-scale pulse disturbances include fire, insect outbreaks, and abrupt permafrost thaw and soil subsidence (known as thermokarst). Periods of disturbances generally favor carbon losses either abiotically (e.g., fire emissions) or biotically (e.g., stimulating respiration). These losses often occur as a pulse loss, whereas carbon gains through vegetation growth and succession and new soil carbon accumulation occur over decadal to century timescales. Other smaller but important carbon fluxes in high-latitude ecosystems include CH4 flux and the lateral export of dissolved inorganic carbon (DIC), dissolved organic carbon (DOC), and particulate organic carbon (POC) in water (McGuire et al., 2009). Methane flux by weight is usually an order of magnitude smaller than CO2 flux but has a higher global warming potential (GWP). Dissolved carbon losses are a persistent feature of undisturbed and disturbed ecosystems and also are typically an order of magnitude smaller than CO2 exchanges. An exception is POC, which usually is similar in magnitude to other dissolved losses and relatively small in many circumstances. However, it is the one flux that can approach the magnitude of CO2 exchanges, at least for short periods, when erosion is a consequence of another disturbance such as abrupt permafrost thaw or fire.
Changes in vegetation and soil carbon stocks over time provide an estimate of landscape carbon budgets. For boreal and Arctic ecosystems, the challenge is that study sites are remote and often not spatially representative. Inventories of aboveground plant biomass in forests are probably the best measured of all ecosystem carbon pools, along with harvested wood products (i.e., managed forests) and then deadwood. Rather than estimated through time, belowground biomass, litter, and soil stocks usually are estimated from single time-point measurements and extrapolated using simple scaling assumptions. The most recent regional estimates for Eurasian and Canadian boreal forests put total carbon flux (total of all pools described above) at 493 ± 76 teragrams (Tg) C per year from 1990 to 1999 and at 499 ± 83 Tg C per year from 2000 to 2007 (Pan et al., 2011). These estimates do not include forestland in interior Alaska (0.51 × 10⁶ km2) or unmanaged forests in northern Canada (1.18 × 10⁶ km2), essentially assuming those lands to be at steady state in regard to carbon pools.
Recent syntheses have outlined changes in tundra carbon flux over time. A broad survey of data from a number of dry to wet tundra types found that in most studies since 1995, tundra acts as a carbon sink during summer, when photosynthetic uptake exceeds respiration losses during this approximately 100-day season (McGuire et al., 2012). Summer carbon sequestration is offset partially by carbon losses in fall, winter, and spring when microbes are still metabolically active and releasing CO2, while plants are largely dormant and carbon assimilation has slowed or ceased. While absolute levels of CO2 flux are low during the nonsummer season, the long period of more than 250 days is enough to offset, in some cases, the net carbon that accumulated during summer. A critical issue for determining net change in ecosystem carbon storage is the relative scarcity of nonsummer flux measurements in comparison to summer flux measurements. For example, the recent regional carbon balance estimate for the North American subregion had 80 study-years of summer measurements and only 9 study-years of nonsummer measurements available for upscaling (McGuire et al., 2012). This order of magnitude difference across seasons was similar across the other upscaled tundra subregions.
A first-order upscaling synthesis that used plot-scale measurements scaled by regional land area showed that North American tundra was a source of carbon on the order of 124 Tg C per year during the 1990s and a sink of 13 Tg C per year during the 2000s (McGuire et al., 2012). This increase in uptake relative to losses was similar to that in the Eurasian tundra that was reported as a 19 Tg C per year source in the 1990s and a sink of 185 Tg C per year in the 2000s. This study reported a global carbon exchange in the tundra region of 13 Tg C per year (i.e., a small sink but near neutral exchange) over both decades using a scaling region of 9.2 × 10⁶ km2, which includes the tundra biome plus a portion of the boreal forest biome for comparison to large-scale atmospheric inversion models. A follow-up synthesis study focused on a subset of the same tundra sites and also included new sites with nonsummer data to bolster undersampled seasons (Belshe et al., 2013). Although this analysis supported the previous finding that the summer-season carbon sink increased in the 2000s compared with the 1990s, it suggested that the mean tundra flux remained a carbon source annually across both decades when additional nonsummer flux data were included. In this analysis, the source potential appears to decline over time, although this decline is statistically nonsignificant. Separately analyzing the record for the nonsummer data-intensive period (2004 to 2010) showed a trend of increasing nonsummer carbon flux and an overall increase in tundra carbon source during that period. Because changes in measurement technology parallel trends in time, data also were analyzed relative to the mean annual temperatures of the study sites. The trend of tundra consistently acting as an annual carbon source was significant across the range of tundra sites, with the net loss ranging from 23 to 56 grams (g) C per m2 per year. This relationship also predicts a 2 g C per °C increase in loss rates across the range of mean annual temperatures. These figures, when scaled to a region consistent with the previous study (10.5 × 10⁶ km2; Callaghan et al., 2004; McGuire et al., 1997, 2012), predict that the tundra is acting as current source of 462 Tg C per year that could increase by almost 35% to 620 Tg C per year, given the “business-as-usual” warming projected for the Arctic (i.e., an increase of 7.5°C).
Recent measurements of atmospheric GHG concentrations over Alaska have been used to estimate carbon source and sink status of those Arctic and boreal ecosystems for 2012 to 2014 (Commane et al., 2017). During this period, tundra regions of Alaska were a consistent net CO2 source to the atmosphere, whereas boreal forests were either neutral or a net CO2 sink. The larger interannual variability of boreal forests was due both to changes in the balance of photosynthesis and respiration and to the amount of combustion emissions by wildfire. The Alaska study region as a whole was estimated to be a net carbon source of 25 ± 14 Tg C per year averaged over the land area of both biomes for the entire study period. If this Alaskan region (1.6 × 10⁶ km2) was representative of the entire northern circumpolar permafrost zone soil area (17.8 × 10⁶ km2), this amount would be equivalent to a region-wide net source of 0.3 Pg C per year.
Uncertainty in the scaling of “bottom-up” field-based flux observations of CH4 emissions across the northern permafrost region (32 to 112 Tg CH4 per year; McGuire et al., 2009) is much larger than uncertainty from “top-down” atmospheric analyses based on the spatial and temporal variability of CH4 concentration measurements (15 to 50 Tg CH4 per year; McGuire et al., 2009; Crill and Thornton 2018). Flux estimates include those from terrestrial ecosystems (e.g., wetlands), lakes, and coastal waters underlain by permafrost. Observational studies reviewed by McGuire et al. (2012) indicate that during the 1990s and 2000s, the tundra emitted 14.7 Tg CH4 per year (with an uncertainty range of 0 to 29.3 Tg CH4 per year). Kirschke et al. (2013) suggest a Eurasian boreal wetland source of 14 Tg CH4 per year (uncertainty = 9 to 23) from field flux measurements and 9 Tg CH4 per year (uncertainty = 4 to 13) from atmospheric measurements, which also estimate an upland soil sink of 3 Tg CH4 per year (uncertainty = 1 to 5). For North American high-latitude wetlands, estimated emissions are 9 Tg CH4 per year (uncertainty = 6 to 17) from atmospheric measurements and 16 Tg CH4 per year (uncertainty = 9 to 28) from field flux measurements, along with a soil sink of 2 Tg CH4 per year (uncertainty = 1 to 2) estimated from atmospheric measurements. The most recent assessment reports that the field flux uncertainty in CH4 emissions from tundra terrestrial ecosystems and lakes in the Arctic was between 10 and 43 Tg CH4 per year during the 1990s and 2000s (AMAP 2015). This estimate indicates that bottom-up uncertainties have not been reduced by more recent assessments. Estimates of CH4 fluxes from lakes likely are confounded with those from wetlands in spatial scaling procedures. A recent synthesis that focused just on lakes in the northern permafrost region indicates that CH4 emissions from lakes range from 6 to 25 Tg CH4 per year (Walter Anthony et al., 2016; Wik et al., 2016). Also, there are large uncertainties about the magnitude of CH4 emitted from submarine permafrost in coastal waters of the Arctic Ocean and its marginal seas (Berchet et al., 2016; Shakhova et al., 2010, 2014). The degree to which the source of CH4 emissions in coastal waters results from biogenic methanogenesis, fossil sources, or the dissociation of gas hydrates is not clear. The amount of CH4 emitted from fossil sources is an issue for both land and ocean environments in the permafrost region. Emissions include CH4 from natural sources such as geological seeps and human activities, including oil and gas exploration and transport (Ruppel and Kessler 2017; Kohnert et al., 2017). Top-down estimates of CH4 emissions from the permafrost region are useful because they integrate the various sources of CH4 to the atmosphere. However, these top-down flux estimates also have substantial uncertainties because they are derived from models, which still need to be better reconciled with field flux measurements.
Recent developments include increased use of atmospheric measurements from aircraft, which have the great advantage of avoiding biases induced by logistical constraints on ground-based study site selections or “hotspot”-focused studies that ignore potentially vast areas of CH4 uptake (e.g., 3.2 ± 1.4 mg CH4 per m2 per day in dry tundra and 1.2 ± 0.6 mg CH4 per m2 per day in moist tundra in northeast Greenland; Juncher Jørgensen et al., 2015). Aircraft atmospheric measurements also inherently include previously neglected freshwater systems estimated to contribute as much as 13 Tg CH4 per year north of 54°N (Bastviken et al., 2011). A recent study used aircraft concentration data and inverse modeling to derive regional fluxes averaged over all of Alaska amounting to 2.1 ± 0.5 Tg CH4 from May to September 2012 (Chang et al., 2014). This quantity includes all biogenic, anthropogenic, and geological sources such as seeps, which alone contribute an estimated 1.5 to 2 Tg CH4 per year (Walter Anthony et al., 2012), based on extrapolating ground-based measurements.
Spatial analyses of CH4 emissions in the northern permafrost region indicate that “wetter” wetlands are primarily sensitive to variation in soil temperature, whereas “drier” wetlands are primarily sensitive to changes in water-table position (Olefeldt et al., 2013). Similar analyses for lakes indicate that in systems with suitable organic substrate, CH4 emissions are sensitive to water temperature, particularly in the continuous permafrost zone (Wik et al., 2016). In addition, some studies have proposed that seasonality of CH4 emissions is potentially sensitive to ongoing climate change, with emissions possibly persisting further into fall as soils remain unfrozen for longer periods (Mastepanov et al., 2008; Miller et al., 2016; Zona et al., 2016) or elevating in spring as CH4 is released from trapped pockets in the frozen soil (Raz-Yaseef et al., 2016). These sensitivities suggest that observed changes in temperature of the northern permafrost region should have resulted in increased CH4 emissions (Walter Anthony et al., 2016), and modeling studies that have incorporated these sensitivities conclude this as well (Riley et al., 2011; Xu et al., 2016). However, while temperature has increased substantially in the northern permafrost region in recent decades, there is no indication from analyses of atmospheric data that CH4 emissions in the region have increased (Bergamaschi et al., 2013; Bruhwiler et al., 2014; Dlugokencky et al., 2009; Sweeney et al., 2016). The lack of significant long-term trends suggests more complex biogeochemical processes may be counteracting the observed short-term temperature sensitivity (Sweeney et al., 2016). Alternatively, separating biogenic changes in northern ecosystems from fossil-fuel derived emissions from lower latitudes may be difficult using surface atmospheric concentration measurements alone (Parazoo et al., 2016).
Carbon can move laterally into inland waters from terrestrial upland and wetland ecosystems in Arctic and boreal biomes. In inland waters, carbon derived from living and dead organic matter is transported largely to the ocean as DOC, DIC, and POC (see Ch. 14: Inland Waters). The annual export of carbon from rivers to the Arctic Ocean is estimated to be 43 Tg C as DIC, 33 Tg C as DOC, and 6 Tg C as POC, for a total of 82 Tg C per year (McGuire et al., 2009). A recent assessment for Alaska estimates that the riverine flux of DIC, DOC, and POC to the ocean is 18 to 25 Tg C per year (Stackpoole et al., 2016), representing 22% to 30% of the total riverine flux of carbon to the Arctic Ocean estimated by McGuire et al. (2009). Although this percentage of the total appears large for Alaska relative to its small geographic discharge area, it may indicate that earlier estimates were too low (McGuire et al., 2009).
Coastal erosion in the Arctic is an important source of POC to the Arctic Ocean, and this flux is likely to increase with warming because of enhanced erosion associated with the loss of a protective sea ice buffer, increasing storm activity, and thawing of coastal permafrost (e.g., Jorgenson and Brown 2005; Rachold et al., 2000, 2004). Based on recent estimates (Rachold et al., 2004), POC transport across the Arctic land-ocean interface through coastal erosion is about 6 to 7 Tg C per year (McGuire et al., 2009).
Fire has the largest footprint of any pulse disturbance in the northern circumpolar permafrost zone; thus, increases in the size, frequency, and severity of regional fire regimes will have important impacts on current and future carbon stocks and fluxes (Balshi et al., 2009; Bond-Lamberty et al., 2007; Kasischke et al., 1995). At the ecosystem scale, fire catalyzes abrupt changes in stocks by transferring carbon from plants and soils to the atmosphere. In contrast to temperate and tropical wildfires, soil organic matter is the dominant source of carbon emissions from boreal and tundra wildfires, and fire-driven changes in soil structure can alter controls over ecosystem carbon dynamics such as ALT, hydrology, and vegetation age and composition. At the landscape scale, increasing fire activity will alter the age structure of forests and tundra, decreasing landscape carbon stocks and increasing or, perhaps less frequently, decreasing carbon sequestration (Yue et al., 2016).
Estimates of carbon emissions from global boreal forest fires averaged 155 Tg C per year (with a range of 78 to 334 Tg C per year) from 1997 to 2013 (Giglio et al., 2013; van der Werf et al., 2010). North American boreal forests contributed 7% to 79% of these emissions and averaged 30%, which is similar to their proportional area (see Table 11.2). However, recent extreme fire years (2014 in northern Canada and 2015 in Alaska) doubled emissions from this region to about 100 Tg C per year, similar to average emissions from the much larger Eurasian boreal region. Extreme fire years are common in both regions. For example, within the last 19 years, North American boreal forests had 6 years where emissions were double the long-term average of 56 Tg C per year, and boreal Eurasian forests had 3 years with emissions double the long-term average of 106 Tg C per year. In contrast to the boreal forest, global carbon emissions from tundra wildfires are poorly constrained, but, on a per-unit-burned-area basis, tundra emissions can be similar in magnitude to boreal forest emissions because of the deep burning of organic soils (Mack et al., 2011). This finding suggests that increased tundra burning will have a similar per-unit-area impact to increased boreal forest burning.
Regional patterns of changing fire severity are less understood than changes in area. Increases in fire frequency are important because they reduce carbon recovery time post-fire and make forests more vulnerable to high-intensity fires (Hoy et al., 2016) or shifts in vegetation dominance (Brown and Johnstone 2012). In permafrost-affected soils, a large quantity of organic carbon resides in a thick soil organic layer that can be hundreds to thousands of years old; this carbon is a legacy of past fire cycles (Harden et al., 2000). Combustion of the soil organic layer dominates carbon emissions during fires (Boby et al., 2010; Kasischke et al., 1995; Mack et al., 2011), and more severe fires result in deeper burning (Turetsky et al., 2011a). Because soil carbon accumulation rates vary across the landscape (Hobbie et al., 2000), deeper burning may not always combust legacy carbon (Mack et al., 2011), but when it does, this burning could rapidly shift ecosystems across a carbon cycling threshold, from net accumulation of carbon from the atmosphere over multiple fire cycles to net loss (Turetsky et al., 2011b).
Fires that burn deeply into the soil organic layer can persistently alter both physical and biological controls over carbon cycling, including permafrost stability, hydrology, and vegetation. Reduction or loss of the soil organic layer decreases ground insulation (Jiang et al., 2015; Jorgenson 2013; Jorgenson et al., 2013; Shur and Jorgenson 2007), warming permafrost soils and exposing organic matter that has been frozen for hundreds to thousands of years to microbial decomposition, mineralization, and atmospheric release of GHGs (Schuur et al., 2008). Permafrost degradation also can increase or decrease soil drainage, leading to abrupt changes in soil moisture regimes that affect both decomposition and production (Jorgenson 2013; Jorgenson et al., 2013; Schuur et al., 2009). These changes sometimes lead to abrupt permafrost thaw and thermal erosion events that drive further change in ecosystem processes. In addition, loss of the soil organic layer exposes mineral soil seedbeds (Johnstone et al., 2009), leading to recruitment of deciduous tree and shrub species that do not establish on organic soil (Kasischke and Johnstone 2005). This recruitment has been shown to shift post-fire vegetation to alternate successional trajectories (Johnstone et al., 2010). Model projections suggest that the Alaskan boreal forest could cross a tipping point, where recent increases in fire activity have made deciduous stands as abundant as spruce stands on the landscape (Mann et al., 2012). In Arctic Larix forests of northeastern Siberia, increased fire severity can lead to increased tree density in forested areas and forest expansion into tundra (Alexander et al., 2012). Additionally, burned graminoid tundra has been observed to increase in post-fire greenness (Hu et al., 2015), an occurrence that has been linked to increased tall deciduous shrub dominance (Racine et al., 2004; Rocha et al., 2012). Plant-soil-microbial feedbacks within new vegetation types determine long-term trajectories of nutrient dynamics (Melvin et al., 2015) that, in turn, constrain ecosystem carbon storage (Alexander and Mack 2016; Johnstone et al., 2010) and resultant climate feedbacks via carbon and energy (Randerson et al., 2006; Rocha et al., 2012).
Carbon in Arctic and boreal ecosystems is expected to be subject both to press disturbances such as increasing temperatures, changing precipitation regimes, and rising CO2 and to pulse disturbances including wildfire, insect outbreaks, and abrupt permafrost thaw. Rates of both disturbance types may change over time depending on future human activities and the resulting ecosystem- and landscape-level feedbacks. No single future assessment technique includes all these mechanisms comprehensively. This section provides estimates of carbon pool change using three different assessment techniques: 1) semiquantitative assessment that relied on expert knowledge of the system; 2) dynamical models that relied on environmental input data and knowledge of underlying mechanistic relationships of ecosystem dynamics; and 3) upscaling of laboratory measurements of potential soil carbon change.
To provide an integrated assessment of the effect of environmental changes in combination with heterogeneity in permafrost decomposability across the region, experts were asked to provide quantitative estimates of permafrost carbon change in response to four scenarios of warming (Schuur et al., 2013). For the highest warming scenario (RCP8.5), experts hypothesized that carbon release from permafrost zone soils could be 19 to 45 Pg C by 2040, 162 to 288 Pg C by 2100, and 381 to 616 Pg C by 2300 in CO2 equivalent1 using a 100-year CH4 GWP. The values become 50% larger using a 20-year CH4 GWP, with one-third to one-half of expected climate forcing coming from CH4, even though it accounted for only 2.3% of the expected carbon release. Experts projected that two-thirds of this release could be avoided under the lowest warming scenario (RCP2.6; Schuur et al., 2013). According to the experts, changes in tundra and boreal vegetation biomass were smaller, totaling an increase of about 15 Pg C by 2100 under the highest warming scenario (RCP8.5; Abbott et al., 2016). In contrast to soil, assessment of biomass change was more divergent among experts, with one-third of respondents predicting either no change, or even a decrease, in biomass over all time intervals and warming scenarios that were considered.
A number of ecosystem models and ESMs have incorporated a first approximation of global permafrost carbon dynamics. Recent key improvements include the physical representation of permafrost soil thermodynamics and the role of environmental controls (particularly the soil freeze-thaw state) in organic carbon decomposition (Koven et al., 2011, 2013; Lawrence et al., 2008). These improved models specifically address processes known to be important in permafrost ecosystems but were missing from earlier model representations. They have been key to forecasting the potential release of permafrost carbon with warming and the impact this release would have on the rate of climate change. Model scenarios show potential carbon release from the permafrost zone ranging from 37 to 174 Pg C by 2100 under the current climate warming trajectory (RCP8.5), with an average across models of 92 ± 17 Pg C (mean ± standard error [SE]); Burke et al., 2012, 2013; Koven et al., 2011; MacDougall et al., 2012; Schaefer et al., 2011; Schaphoff et al., 2013; Schneider von Deimling et al., 2012; Zhuang et al., 2006). This range is generally consistent with several newer, data-driven modeling approaches that estimated soil carbon releases by 2100 (for RCP8.5) to be 57 Pg C (Koven et al., 2015) and 87 Pg C (Schneider von Deimling et al., 2015), as well as an updated estimate of 102 Pg C from one of the previous models (MacDougall and Knutti, 2016). Furthermore, thawing permafrost carbon is forecasted to affect global climate for centuries. Models that projected emissions further out into the future beyond 2100 estimated additional carbon releases beyond those reported above. More than half of eventual total permafrost carbon emissions projected by the models, on average, would occur after 2100. While carbon releases over these time frames are understandably uncertain, they illustrate the momentum of a warming climate that thaws near-surface permafrost, causing a cascading release of GHGs, as microbes slowly decompose newly thawed permafrost carbon. The latest model simulations performed either with structural enhancements to better represent permafrost carbon dynamics (Burke et al., 2017) or with common environmental input data (McGuire et al., 2016) show similar soil carbon losses. However, they also indicate the potential for stimulated plant growth (e.g., with increased nutrients, temperature and growing season length, and CO2 fertilization) to offset some or all of these losses by sequestering new carbon into plant biomass and increasing inputs into the surface soil (McGuire 2018).
Within the wide uncertainty of forecasts, some broader patterns are just beginning to emerge. Models vary widely when predicting the current pool of permafrost carbon, which is the fuel for future carbon emissions in a warmer world. The model average size of the permafrost carbon pool was estimated at 771 ± 100 Pg C (mean ± SE), about half as much as the measurement-based estimate (Schuur et al., 2015). The difference in the two estimates potentially is related, in part, to the fact that most models represented carbon to a depth of only 3 m. A smaller modeled carbon pool, in principle, could constrain forecasted carbon emissions. Normalizing the emissions estimates from the dynamic models by their initial permafrost carbon pool size, 15 ± 3% (mean ± SE) of the initial pool is expected to be lost as GHG emissions by 2100 (Schaefer et al., 2014). However, within these complex models, sensitivity to modeled Arctic climate change and the responses of soil temperature, moisture, and carbon dynamics are important controls over emissions predictions, not just pool size alone (Koven et al., 2013; Lawrence et al., 2012; Slater and Lawrence 2013).
These dynamic models also simultaneously assess the countering influence of plant carbon uptake that may partially offset permafrost carbon release. Warmer temperatures, longer growing seasons, elevated CO2, and increased nutrients released from decomposing organic carbon all may stimulate plant growth (Shaver et al., 2000). New carbon can be stored in larger plant biomass or deposited into surface soils (Sistla et al., 2013). An intercomparison of biogeochemical models applied to the permafrost region indicates much larger plant production responses to climate change in the last few decades than observation-based trends in plant productivity (McGuire et al., 2016), suggesting that future plant production responses to changing climate may also be less than models predict. A previous generation of ESMs that did not include permafrost carbon mechanisms but did simulate changes in plant carbon uptake estimated that the vegetation carbon pool could increase by 17 ± 8 Pg C by 2100, with increased plant growth also contributing to new soil carbon accumulation of similar magnitude (Qian et al., 2010). The models reviewed here with permafrost carbon mechanisms also include many of the same mechanisms that stimulate plant growth as the previous generation of models and generally indicate that increased plant carbon uptake will more than offset soil carbon emissions from the permafrost region for several decades as the climate becomes warmer (Koven et al., 2011; MacDougall et al., 2012; Schaefer et al., 2011). Over longer timescales and with continued warming, however, microbial release of carbon overwhelms the capacity for plant carbon uptake, leading to net carbon emissions from permafrost ecosystems to the atmosphere. Modeled carbon emissions projected under various warming scenarios translate into a range of 0.13 to 0.27°C additional global warming by 2100 and up to 0.42°C by 2300, but currently remain one of the least constrained biospheric feedbacks to climate (IPCC 2013).
In many of the model projections previously discussed, CH4 release is not explicitly represented because fluxes are small. However, the higher GWP of CH4 makes these emissions relatively more important than on a mass basis alone. Observed short-term temperature sensitivity of CH4 from the Arctic possibly will have little impact on the global atmospheric CH4 budget in the long term if future trajectories evolve with the same temperature sensitivity (Sweeney et al., 2016). Global models that include the short-term sensitivities of CH4 to warming show increased CH4 emissions with future warming in the northern permafrost region (Gao et al., 2013; Riley et al., 2011). Yet, these models conclude that if these increased emissions were to occur, they would have little influence on the climate system because of their relatively small magnitude. However, most models do not include abrupt thaw processes (i.e., thawing of ice-rich permafrost) that can result in lake expansion, wetland formation, and massive erosion and exposure to decomposition of previously frozen carbon-rich permafrost. A substantial area of the northern permafrost region is susceptible to abrupt thaw (Olefeldt et al., 2016), which could result in more substantial CH4 emissions in the future than are currently projected by models. Although the current generation of comprehensive ESMs largely do not include abrupt thaw processes, progress is being made to include surface subsidence that occurs as a result of ground ice loss (Lee et al., 2014). A recent study suggests that the largest CH4 emission rates will occur around the middle of this century when simulated thermokarst lake extent is at its maximum and when abrupt thaw under thermokarst lakes is taken into account (Schneider von Deimling et al., 2015). Furthermore, the simulated CH4 fluxes can cause up to 40% of total permafrost-affected radiative forcing in this century. Similarly, no global models currently consider the effects of warming on CH4 emissions from coastal systems in the Arctic. Models clearly need to include an expanded suite of processes, such as those described previously, that can affect CH4 dynamics (Xu et al., 2016). These more comprehensive CH4 models must be effectively benchmarked in a retrospective context (McGuire et al., 2016) before the research community can reduce uncertainty over changes in CH4 dynamics of the northern permafrost region in response to future warming.
In addition to the amount of carbon stored in permafrost, the decomposability of organic matter determines how much carbon is released to the atmosphere. A recent synthesis using permafrost soil from various circumpolar locations assessed the decomposability of permafrost carbon using long-term (longer than 1 year) aerobic incubation studies (Schädel et al., 2014). A small fraction of organic matter in thawed permafrost can decompose in weeks to months (Bracho et al., 2016; Dutta et al., 2006; Knoblauch et al., 2013; Lee et al., 2012), but the larger fraction decomposes over decades and even centuries (Schädel et al., 2014). Decade-long potential carbon release as CO2 was estimated to range from 1% to 76% across a variety of soil types with strong landscape-scale variation. This landscape variation in decomposability was linked to the carbon-to-nitrogen ratio of the bulk organic matter, with higher ratio soils having a greater potential to release carbon during laboratory incubation. The carbon-to-nitrogen ratio is initiated by 1) the type of vegetation carbon that is input to the permafrost soil pool over years, centuries, and even longer; 2) subsequent microbial activity acting on those inputs; and 3) pedogenic processes that help control soil organic matter formation and decay. Upscaling these incubation results using a data-driven modeling approach estimated that soil carbon releases by 2100 (for RCP8.5) will be 57 PgC (Koven et al., 2015).
In a future climate, microbial decomposition of organic matter will happen under a wide variety of environmental conditions that control the amount and form of GHG release. Although temperature control over decomposition is implicit when considering permafrost thaw, northern high latitudes also are characterized by widespread lakes, wetlands, and waterlogged soils. Oxygen-rich conditions are found in drier upland soils where microbial decomposition produces mainly CO2; oxygen-poor conditions occur in lowlands when ice-rich permafrost thaws, runoff is prevented by the underlying permafrost, and both CO2 and CH4 are produced by microbial decomposition. A recent meta-analysis compared GHG release from aerobic and anaerobic laboratory incubation conditions (Schädel et al., 2016). The study quantified that drier, aerobic soil conditions result in three times higher carbon release into the atmosphere compared to the same soil decomposing in wetter, anaerobic soil conditions. Most of the carbon released to the atmosphere was in the form of CO2. Under anaerobic conditions, a small amount of carbon also was released as CH4 (about 5% of total carbon release). Even though CH4 is the more potent GHG, the much faster decomposition under aerobic conditions dominates the overall carbon release from permafrost. These results show that CO2 released from drier and oxygen-rich environments will be as or more important than CO2 and CH4 released from oxygen-poor environments on a per-unit soil carbon basis. The ultimate effect of these ecosystem types on climate would be scaled, of course, by the landscape coverage of these drier and wetter environments. In addition, these results present laboratory potentials for GHG release from permafrost; there are variety of factors excluded from this technique, such as increased plant biomass input to the soils, changing plant communities, and the priming of old carbon decomposition from new plant litter inputs.
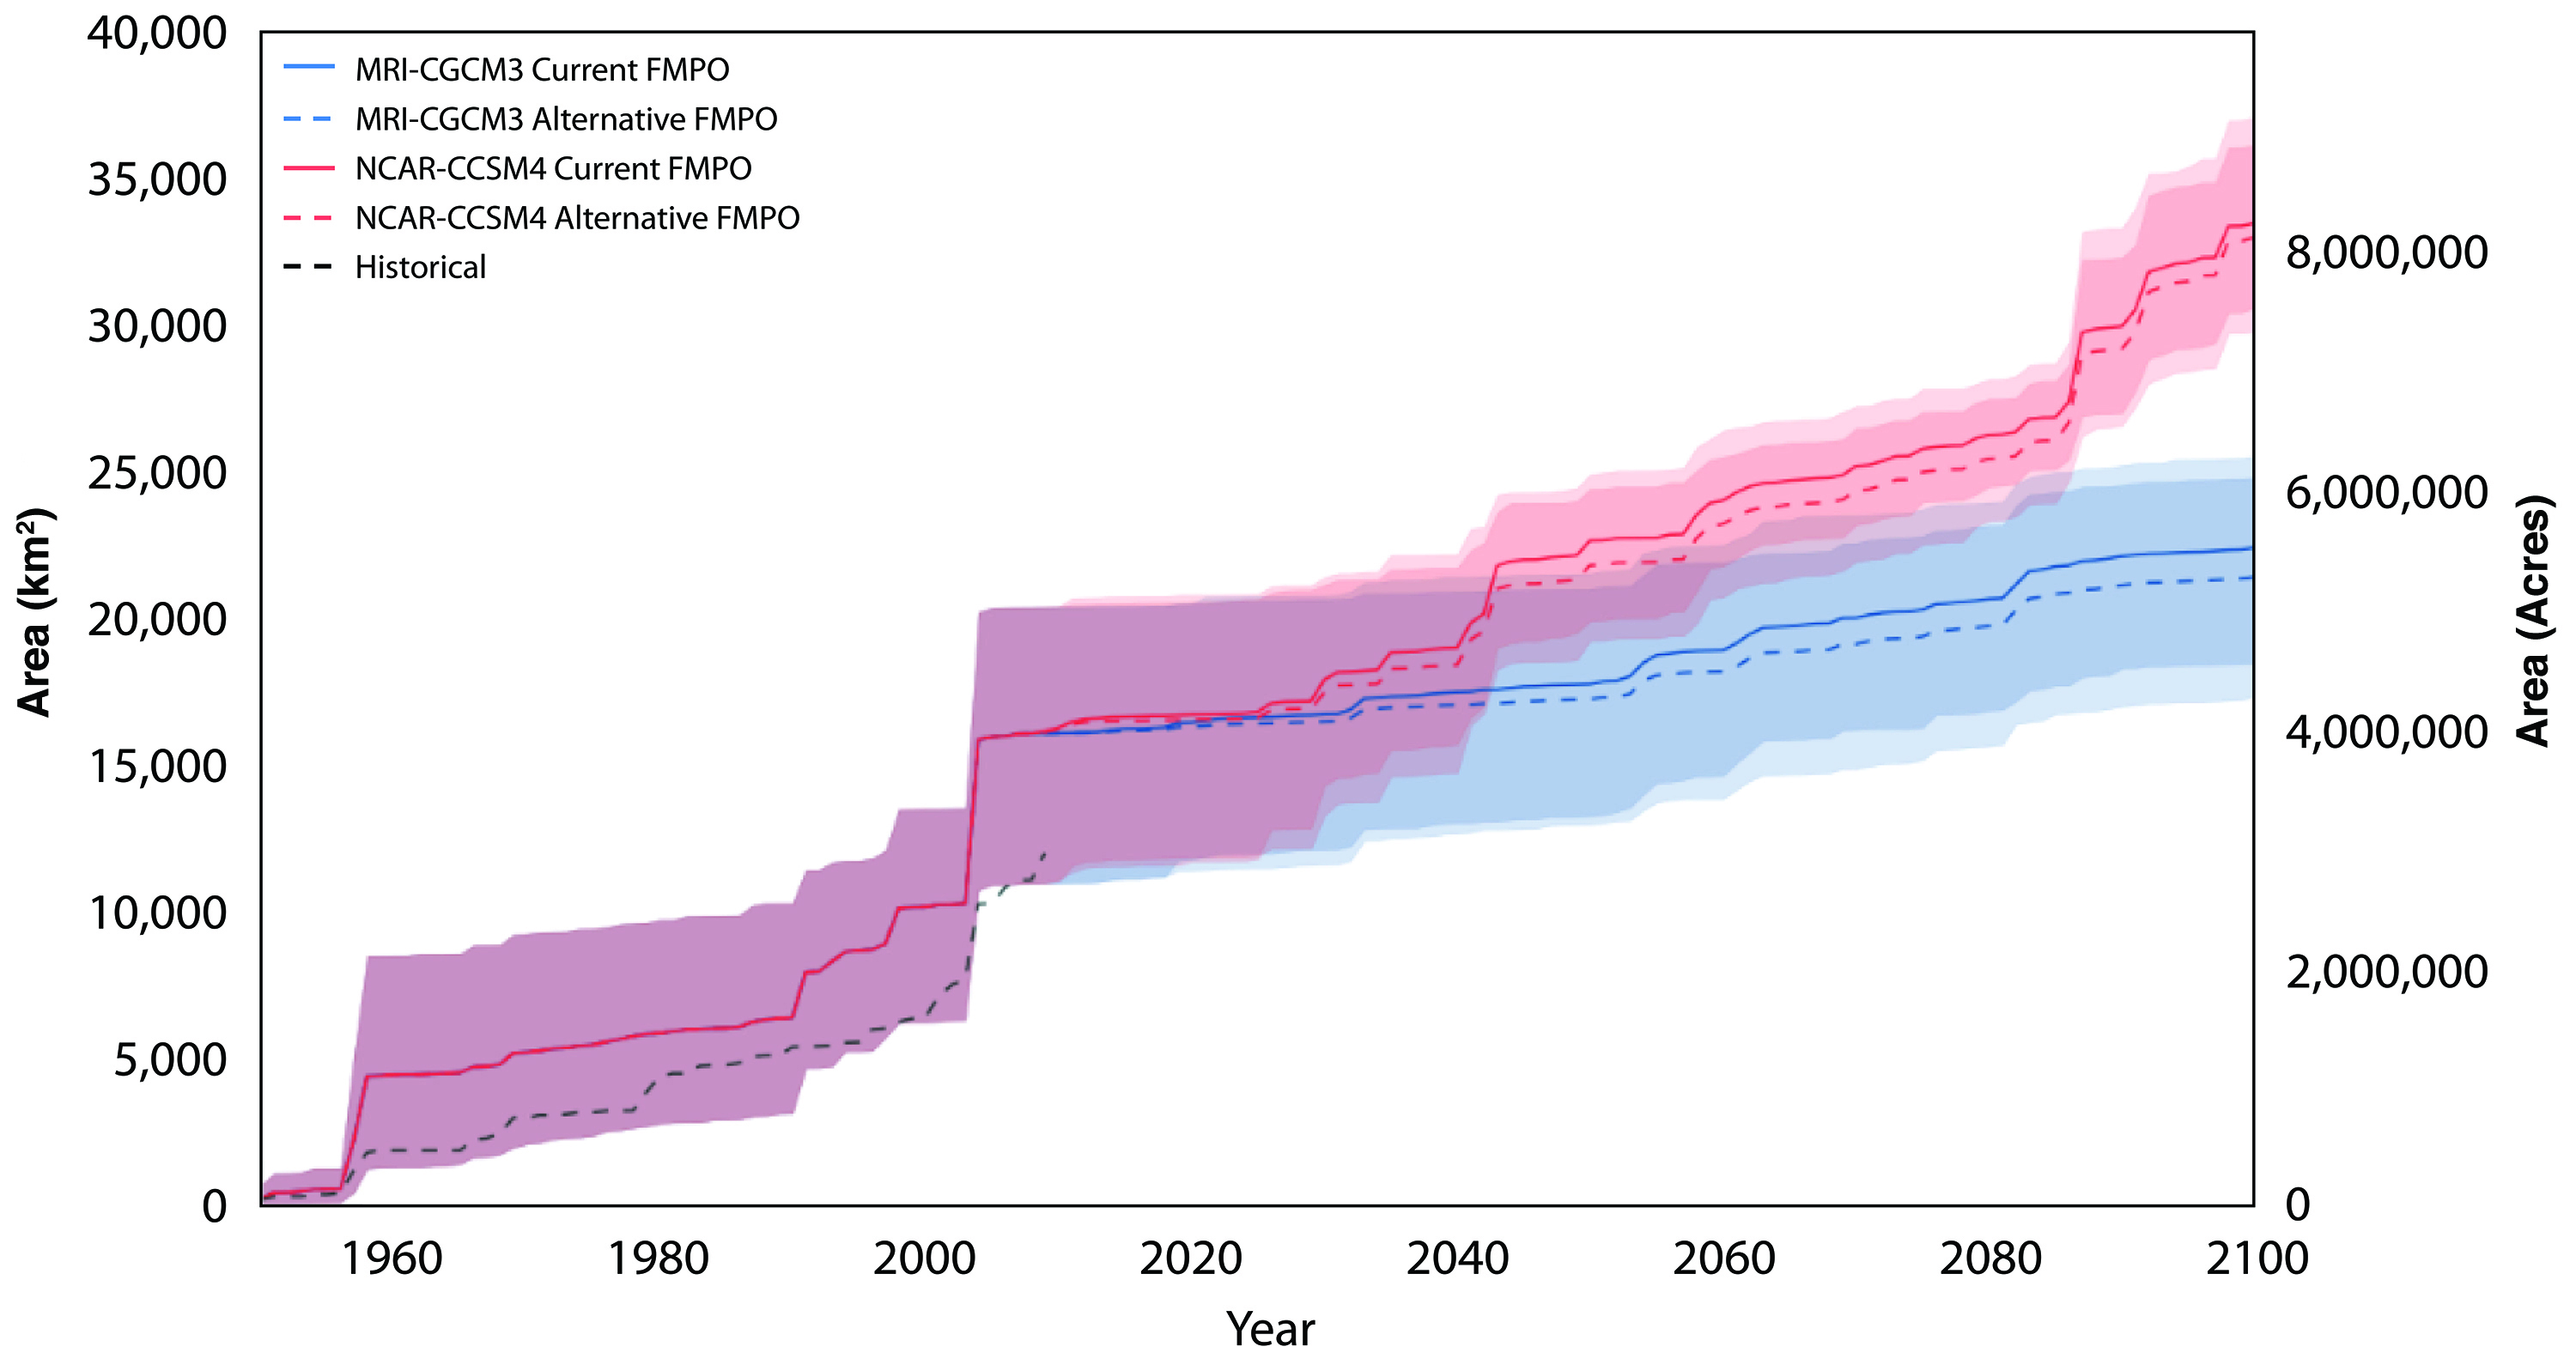
Forestry is the most widespread human management activity that affects the carbon cycle in the most productive and accessible portion of the boreal forest. This section focuses on a case study of how wildfire management in Alaska has the potential to affect the fire cycle and, consequently, carbon pools via pathways described earlier in the chapter. In Alaska, all lands are classified into fire management planning options depending on the proximity to and density of human infrastructure. The range of management options include “Limited” (i.e., the least amount of management where fire activity is largely observed but not suppressed), “Modified,” “Full,” and “Critical” (i.e., assigned to lands immediately surrounding human settlements and key infrastructure and resources). Each option represents an increasing amount of human intervention to suppress wildfire activity. This case study describes a modeling experiment conducted to determine the impact of changing fire management planning options from the current designation of Limited or Modified to Full protection for all military lands in the greater Fairbanks, Alaska, area. This change in fire management led to a small increase in the projected number of fires per decade because more flammable vegetation (e.g., late successional conifer forests) would be preserved, but, importantly, there was a projected decrease in the cumulative area burned through 2100 compared to the status quo (see Figure 11.8). Depending on the particular climate projection, active fire management (Full) decreased the projected cumulative area burned by 1.5% to 4.4% by 2100 (Breen et al., 2016). Differences in projected climate by 2100 arising from different climate model formulations have a strong impact on cumulative area burned, but fire management does have a small effect no matter the actual climate realized at the end of the century. In the absence of changing fire severity, the effect on carbon emissions would be exactly proportional to the difference in area burned. However, the somewhat small difference in cumulative area burned, and the proportional resulting effect on the carbon cycle, would need to be considered in context with the additional resources required to change the fire management planning option from the lower to higher level.
Figure 11.8: Effects of Two Climate Scenarios and Two Management Scenarios for a Subregion of Alaska
Observation and modeling results synthesized in this chapter suggest that significant changes in the carbon stocks of Arctic and boreal regions may occur with impacts on the atmospheric GHG budget. These projections primarily are due to the large pools of soil carbon preserved in cold and waterlogged environments vulnerable to a changing climate. This region, which previously has sequestered large amounts of carbon for centuries to millennia, is expected to transform into a one that acts as a net carbon source to the atmosphere over the next decades to centuries in a warming climate. Indeed, Arctic and boreal systems possibly have gone through this transition already.
Carbon offsets by vegetation remain a key part of the net response of this region to warming. Rising Arctic temperatures appear to have increased plant biomass, an effect observed in the tundra over the last three decades using satellite remote-sensing tools (Frost and Epstein 2014; Jia et al., 2003; Ju and Masek 2016) and field observations (Elmendorf et al., 2012; Salmon et al., 2016). A greener Arctic has important implications for regional and global climate because of anticipated increases in atmospheric CO2 uptake, changes in surface energy, and altered nutrient and water cycling. Despite this long-term trend toward a greener Arctic, a distinct reversal of this trend has been observed for tundra from 2011 to 2014 (Epstein et al., 2015; Phoenix and Bjerke 2016), and the long-term trend is in contrast to boreal regions that show decreased NDVI (browning; Beck and Goetz 2011). Models, in contrast, tend to show consistent increases in plant growth, both in retrospective analyses (McGuire et al., 2016) and in future forecasts. Documenting changes in biomass with repeat LIDAR measurements is an approach for producing future datasets that help validate or refute model projections of enhanced carbon uptake.
Emerging research on disturbance of permafrost soils by abrupt thaw is another knowledge gap where new information on modeling and landscape mapping is helping to describe patterns and processes (Olefeldt et al., 2016). Abrupt permafrost thaw can trigger destabilization of permafrost and soils at rates much higher than predicted from changes in temperature alone. However, this disturbance occurs at specific points covering only a fraction of the landscape compared to that affected by the influence of temperature increases occurring regionally (Kokelj et al., 2017). New research is critical for highlighting the importance of this subgrid pulse disturbance at the landscape scale and for providing the process-level detail needed but currently lacking in regional- and global-scale models.
Lastly, apparent offsets in carbon flux estimates made by top-down atmospheric measurements and from bottom-up scaling of ecosystem measurements always will be hampered in this region because of the relative scarcity of study locations. New research and satellite capabilities currently focused on high-latitude ecosystems are helping to increase data coverage in this remote and understudied region and will set important baselines against which to measure future change.
Abbott, B. W., J. B. J. Jones, E. A. G. Schuur, F. S. I. Chapin, W. B. Bowden, M. S. Bret-Harte, H. E. Epstein, M. D. Flannigan, T. K. Harms, T. N. Hollingsworth, M. C. Mack, A. D. McGuire, S. Natali, M., A. V. Rocha, S. E. Tank, M. Turetsky, R., J. E. Vonk, K. P. Wickland, G. R. Aiken, H. D. Alexander, R. M. W. Amon, B. W. Bensoter, Y. Bergeron, K. Bishop, O. Blarquez, B. Bond-Lamberty, A. L. Breen, I. Buffam, Y. Cai, C. Carcaillet, S. K. Carey, J. M. Chen, H. Y. H. Chen, T. R. Christensen, L. W. Cooper, J. H. C. Cornelissen, W. J. de Groot, T. H. DeLuca, E. Dorrepaal, N. Fetcher, J. C. Finlay, B. C. Forbes, N. H. F. French, S. Gauthier, M. P. Girardin, S. J. Goetz, J. G. Goldammer, L. Gouch, P. Grogan, L. Guo, P. E. Higuera, L. Hinzman, F. S. Hu, G. Hugelius, E. E. Jafarov, R. Jandt, J. F. Johnstone, J. Karlsson, E. S. Kasischke, G. Kattner, R. Kelly, F. Keuper, G. W. Kling, P. Kortelainen, J. Kouki, P. Kuhry, H. Laudon, I. Laurion, R. W. Macdonald, P. J. Mann, P. J. Martikainen, J. W. McClelland, U. Molau, S. F. Oberbauer, D. Olefeldt, D. Paré, M.-A. Parisien, S. Payette, C. Peng, O. S. Pokrovksy, E. B. Rastetter, P. A. Raymond, M. K. Raynolds, G. Rein, J. F. Reynolds, M. Robard, B. M. Rogers, C. Schädel, K. Schaefer, I. K. Schmidt, A. Shvidenko, J. Sky, R. G. M. Spencer, G. Starr, R. G. Striegl, R. Teisserenc, L. J. Tranvik, T. Virtanen, J. M. Welker, and S. Zimov, 2016: Biomass offsets little or none of permafrost carbon release from soils, streams, and wildfire: An expert assessment. Environmental Research Letters, 11(3), 034014.
Alexander, H. D., and M. C. Mack, 2016: A canopy shift in interior Alaskan boreal forests: Consequences for above- and belowground carbon and nitrogen pools during post-fire succession. Ecosystems, 19(1), 98-114, doi: 10.1007/s10021-015-9920-7.
Alexander, H. D., M. C. Mack, S. Goetz, M. M. Loranty, P. S. A. Beck, K. Earl, S. Zimov, S. Davydov, and C. C. Thompson, 2012: Carbon accumulation patterns during post-fire succession in Cajander larch (Larix cajanderi) forests of Siberia. Ecosystems, 15(7), 1065-1082, doi: 10.1007/s10021-012-9567-6.
AMAP, 2015: AMAP assessment 2015: Methane as an Arctic climate forcer. Arctic Monitoring and Assessment Programme, 139 pp. [URL]
Balser, A. W., J. B. Jones, and R. Gens, 2014: Timing of retrogressive thaw slump initiation in the Noatak Basin, northwest Alaska, USA. Journal of Geophysical Research: Earth Surface, 119(5), 1106-1120.
Balshi, M. S., A. D. McGuire, P. Duffy, M. Flannigan, D. W. Kicklighter, and J. Melillo, 2009: Vulnerability of carbon storage in North American boreal forests to wildfires during the 21st century. Global Change Biology, 15(6), 1491-1510, doi: 10.1111/j.1365-2486.2009.01877.x.
Bastviken, D., L. J. Tranvik, J. A. Downing, P. M. Crill, and A. Enrich-Prast, 2011: Freshwater methane emissions offset the continental carbon sink. Science, 331(6013), 50-50, doi: 10.1126/science.1196808.
Beck, P. S. A., and S. J. Goetz, 2011: Satellite observations of high northern latitude vegetation productivity changes between 1982 and 2008: Ecological variability and regional differences. Environmental Research Letters, 6(4), 049501.
Belshe, E. F., E. A. G. Schuur, and B. M. Bolker, 2013: Tundra ecosystems observed to be CO2 sources due to differential amplification of the carbon cycle. Ecology Letters, 16(10), 1307-1315, doi: 10.1111/ele.12164.
Berchet, A., P. Bousquet, I. Pison, R. Locatelli, F. Chevallier, J. D. Paris, E. J. Dlugokencky, T. Laurila, J. Hatakka, Y. Viisanen, D. E. J. Worthy, E. Nisbet, R. Fisher, J. France, D. Lowry, V. Ivakhov, and O. Hermansen, 2016: Atmospheric constraints on the methane emissions from the East Siberian Shelf. Atmospheric Chemistry and Physics, 16(6), 4147-4157, doi: 10.5194/acp-16-4147-2016.
Bergamaschi, P., S. Houweling, A. Segers, M. Krol, C. Frankenberg, R. A. Scheepmaker, E. Dlugokencky, S. C. Wofsy, E. A. Kort, C. Sweeney, T. Schuck, C. Brenninkmeijer, H. Chen, V. Beck, and C. Gerbig, 2013: Atmospheric CH4 in the first decade of the 21st century: Inverse modeling analysis using SCIAMACHY satellite retrievals and NOAA surface measurements. Journal of Geophysical Research: Atmospheres, 118(13), 7350-7369, doi: 10.1002/jgrd.50480.
Biskaborn, B. K., J. P. Lanckman, H. Lantuit, K. Elger, D. A. Streletskiy, W. L. Cable, and V. E. Romanovsky, 2015: The new database of the Global Terrestrial Network for Permafrost (GTN-P). Earth System Science Data, 7(2), 245-259, doi: 10.5194/essd-7-245-2015.
Boby, L. A., E. A. G. Schuur, M. C. Mack, D. Verbyla, and J. F. Johnstone, 2010: Quantifying fire severity, carbon, and nitrogen emissions in Alaska’s boreal forest. Ecological Applications, 20(6), 1633-1647, doi: 10.1890/08-2295.1.
Bockheim, J. G., and K. M. Hinkel, 2007: The importance of “deep” organic carbon in permafrost-affected soils of Arctic Alaska. Soil Science Society of America Journal, 71(6), 1889-1892, doi: 10.2136/sssaj2007.0070N.
Bond-Lamberty, B., S. D. Peckham, D. E. Ahl, and S. T. Gower, 2007: Fire as the dominant driver of central Canadian boreal forest carbon balance. Nature, 450(7166), 89-92, doi: 10.1038/nature06272.
Bracho, R., S. Natali, E. Pegoraro, K. G. Crummer, C. Schädel, G. Celis, L. Hale, L. Wu, H. Yin, J. M. Tiedje, K. T. Konstantinidis, Y. Luo, J. Zhou, and E. A. G. Schuur, 2016: Temperature sensitivity of organic matter decomposition of permafrost-region soils during laboratory incubations. Soil Biology and Biochemistry, 97, 1-14, doi: 10.1016/j.soilbio.2016.02.008.
Breen, A. L., A. Bennett, T. Kurkowski, M. Lindgren, J. Schroder, A. D. McGuire, and T. S. Rupp, 2016: Projecting vegetation and wildfire response to changing climate and fire management in interior Alaska. Alaska Fire Science Consortium Research Summary. 7 pp.
Bret-Harte, M. S., M. C. Mack, G. R. Shaver, D. C. Huebner, M. Johnston, C. A. Mojica, C. Pizano, and J. A. Reiskind, 2013: The response of Arctic vegetation and soils following an unusually severe tundra fire. Philosophical Transactions of the Royal Society B: Biological Sciences, 368(1624), doi: 10.1098/rstb.2012.0490.
Brosius, L. S., K. M. Walter Anthony, G. Grosse, J. P. Chanton, L. M. Farquharson, P. P. Overduin, and H. Meyer, 2012: Using the deuterium isotope composition of permafrost meltwater to constrain thermokarst lake contributions to atmospheric CH4 during the last deglaciation. Journal of Geophysical Research: Biogeosciences, 117(G1), G01022, doi: 10.1029/2011jg001810.
Brown, C. D., and J. F. Johnstone, 2012: Once burned, twice shy: Repeat fires reduce seed availability and alter substrate constraints on Picea mariana regeneration. Forest Ecology and Management, 266, 34-41, doi: 10.1016/j.foreco.2011.11.006.
Brown, J., O. J. J. Ferrians, J. A. Heginbottom, and E. S. Melnikov, 1997: Circum-Arctic map of permafrost and ground-ice conditions. Circum-Pacific Map 45. U.S. Geological Survey, doi: 10.3133/cp45. [URL]
Brown, J., O. J. J. Ferrians, J. A. Heginbottom, and E. S. Melnikov, 1998—revised February 2001: Circum-Arctic map of permafrost and ground-ice conditions. Circum-Pacific Map Series CP-45, scale 1:10,000,000, 1 sheet, National Snow and Ice Data Center/World Data Center for Glaciology. [URL]
Bruhwiler, L., E. Dlugokencky, K. Masarie, M. Ishizawa, A. Andrews, J. Miller, C. Sweeney, P. Tans, and D. Worthy, 2014: CarbonTracker-CH4: An assimilation system for estimating emissions of atmospheric methane. Atmospheric Chemistry and Physics, 14(16), 8269-8293, doi: 10.5194/acp-14-8269-2014.
Burke, E. J., I. P. Hartley, and C. D. Jones, 2012: Uncertainties in the global temperature change caused by carbon release from permafrost thawing. Cryosphere, 6(5), 1063-1076, doi: 10.5194/tc-6-1063-2012.
Burke, E. J., C. D. Jones, and C. D. Koven, 2013: Estimating the permafrost-carbon climate response in the CMIP5 climate models using a simplified approach. Journal of Climate, 26(14), 4897-4909, doi: 10.1175/jcli-d-12-00550.1.
Burke, E. J., A. Ekici, Y. Huang, S. E. Chadburn, C. Huntingford, P. Ciais, P. Friedlingstein, S. Peng, and G. Krinner, 2017: Quantifying uncertainties of permafrost carbon–climate feedbacks. Biogeosciences, 14(12), 3051-3066, doi: 10.5194/bg-14-3051-2017.
Callaghan, T. V., L. O. Bjorn, Y. Chernov, T. Chapin, T. R. Christensen, B. Huntley, R. A. Ims, M. Johansson, D. Jolly, S. Jonasson, N. Matveyeva, N. Panikov, W. Oechel, and G. Shaver, 2004: Effects on the function of Arctic ecosystems in the short- and long-term perspectives. AMBIO, 33(7), 448-458, doi: 10.1639/0044-7447(2004)033[0448:eotfoa]2.0.co;2.
Chang, R. Y., C. E. Miller, S. J. Dinardo, A. Karion, C. Sweeney, B. C. Daube, J. M. Henderson, M. E. Mountain, J. Eluszkiewicz, J. B. Miller, L. M. Bruhwiler, and S. C. Wofsy, 2014: Methane emissions from Alaska in 2012 from CARVE airborne observations. Proceedings of the National Academy of Sciences USA, 111(47), 16694-16699, doi: 10.1073/pnas.1412953111.
Chapin, F. S., G. M. Woodwell, J. T. Randerson, E. B. Rastetter, G. M. Lovett, D. D. Baldocchi, D. A. Clark, M. E. Harmon, D. S. Schimel, R. Valentini, C. Wirth, J. D. Aber, J. J. Cole, M. L. Goulden, J. W. Harden, M. Heimann, R. W. Howarth, P. A. Matson, A. D. McGuire, J. M. Melillo, H. A. Mooney, J. C. Neff, R. A. Houghton, M. L. Pace, M. G. Ryan, S. W. Running, O. E. Sala, W. H. Schlesinger, and E. D. Schulze, 2006: Reconciling carbon-cycle concepts, terminology, and methods. Ecosystems, 9(7), 1041-1050, doi: 10.1007/s10021-005-0105-7.
Chapin, F. S., P. A. Matson, and P. M. Vitousek, 2011: Principles of Terrestrial Ecosystem Ecology. Springer-Verlag, 529 pp.
Commane, R., J. Lindaas, J. Benmergui, K. A. Luus, R. Y. Chang, B. C. Daube, E. S. Euskirchen, J. M. Henderson, A. Karion, J. B. Miller, S. M. Miller, N. C. Parazoo, J. T. Randerson, C. Sweeney, P. Tans, K. Thoning, S. Veraverbeke, C. E. Miller, and S. C. Wofsy, 2017: Carbon dioxide sources from Alaska driven by increasing early winter respiration from Arctic tundra. Proceedings of the National Academy of Sciences USA, 114(21), 5361-5366, doi: 10.1073/pnas.1618567114.
Crill, P. M., and B. F. Thornton, 2018: Whither methane in the IPCC process? Nature Climate Change, 8(3), 257-257, doi: 10.1038/s41558-017-0035-3.
Ding, J., F. Li, G. Yang, L. Chen, B. Zhang, L. Liu, K. Fang, S. Qin, Y. Chen, Y. Peng, C. Ji, H. He, P. Smith, and Y. Yang, 2016: The permafrost carbon inventory on the Tibetan plateau: A new evaluation using deep sediment cores. Global Change Biology, 22(8), 2688-2701, doi: 10.1111/gcb.13257.
Dixon, R. K., A. M. Solomon, S. Brown, R. A. Houghton, M. C. Trexier, and J. Wisniewski, 1994: Carbon pools and flux of global forest ecosystems. Science, 263(5144), 185-190, doi: 10.1126/science.263.5144.185.
Dlugokencky, E. J., L. Bruhwiler, J. W. C. White, L. K. Emmons, P. C. Novelli, S. A. Montzka, K. A. Masarie, P. M. Lang, A. M. Crotwell, J. B. Miller, and L. V. Gatti, 2009: Observational constraints on recent increases in the atmospheric CH4 burden. Geophysical Research Letters, 36(18), doi: 10.1029/2009GL039780.
Drozdov, D. S., G. V. Malkova, N. G. Ukraintseva, and Y. V. Korostelev, 2012: Permafrost monitoring of southern tundra landscapes in the Russian European north and west Siberia. In: Proceedings of the Tenth International Conference on Permafrost. Vol. 2: Translations of Russian Contributions, Salekhard, Russia, The Northern Publisher, 65-70.
Dutta, K., E. A. G. Schuur, J. C. Neff, and S. A. Zimov, 2006: Potential carbon release from permafrost soils of northeastern Siberia. Global Change Biology, 12(12), 2336-2351, doi: 10.1111/j.1365-2486.2006.01259.x.
Ellis, E. C., and N. Ramankutty, 2008: Putting people in the map: Anthropogenic biomes of the world. Frontiers in Ecology and the Environment, 6(8), 439-447, doi: 10.1890/070062.
Elmendorf, S. C., G. H. R. Henry, R. D. Hollister, R. G. Bjork, N. Boulanger-Lapointe, E. J. Cooper, J. H. C. Cornelissen, T. A. Day, E. Dorrepaal, T. G. Elumeeva, M. Gill, W. A. Gould, J. Harte, D. S. Hik, A. Hofgaard, D. R. Johnson, J. F. Johnstone, I. S. Jonsdottir, J. C. Jorgenson, K. Klanderud, J. A. Klein, S. Koh, G. Kudo, M. Lara, E. Levesque, B. Magnusson, J. L. May, J. A. Mercado-Diaz, A. Michelsen, U. Molau, I. H. Myers-Smith, S. F. Oberbauer, V. G. Onipchenko, C. Rixen, N. Martin Schmidt, G. R. Shaver, M. J. Spasojevic, o. E. orhallsdottir, A. Tolvanen, T. Troxler, C. E. Tweedie, S. Villareal, C.-H. Wahren, X. Walker, P. J. Webber, J. M. Welker, and S. Wipf, 2012: Plot-scale evidence of tundra vegetation change and links to recent summer warming. Nature Climate Change, 2(6), 453-457, doi: 10.1038/nclimate1465.
Epstein, H. E., M. K. Raynolds, D. A. Walker, U. S. Bhatt, C. J. Tucker, and J. E. Pinzon, 2012: Dynamics of aboveground phytomass of the circumpolar Arctic tundra during the past three decades. Environmental Research Letters, 7(1), 015506, doi: 10.1088/1748-9326/7/1/015506.
Epstein, H. E., U. S. Bhatt, M. K. Raynolds, D. A. Walker, P. A. Bieniek, C. J. Tucker, J. E. Pinzon, I. H. Myers-Smith, B. C. Forbes, M. Macias-Fauria, N. T. Boelman, and S. K. Sweet, 2015: Tundra greeness. Arctic Report Card: Update for 2015. [M. O. Jeffries, J. Richter-Menge, and J. E. Overland, (eds.)]. [URL]
Flannigan, M., B. Stocks, M. Turetsky, and M. Wotton, 2009: Impacts of climate change on fire activity and fire management in the circumboreal forest. Global Change Biology, 15(3), 549-560, doi: 10.1111/j.1365-2486.2008.01660.x.
French, N. H., L. K. Jenkins, T. V. Loboda, M. Flannigan, R. Jandt, L. L. Bourgeau-Chavez, and M. Whitley, 2015: Fire in Arctic tundra of Alaska: Past fire activity, future fire potential, and significance for land management and ecology. International Journal of Wildland Fire, 24(8), 1045-1061.
Frost, G. V., and H. E. Epstein, 2014: Tall shrub and tree expansion in Siberian tundra ecotones since the 1960s. Global Change Biology, 20(4), 1264-1277, doi: 10.1111/gcb.12406.
Gao, X., C. A. Schlosser, A. Sokolov, K. W. Anthony, Q. Zhuang, and D. Kicklighter, 2013: Permafrost degradation and methane: Low risk of biogeochemical climate-warming feedback. Environmental Research Letters, 8(3), doi: 10.1088/1748-9326/8/3/035014.
Giglio, L., J. T. Randerson, and G. R. van der Werf, 2013: Analysis of daily, monthly, and annual burned area using the fourthgeneration Global Fire Emissions Database (GFED4). Journal of Geophysical Research: Biogeosciences, 118(1), 317-328, doi: 10.1002/jgrg.20042.
Gogineni, P., V. E. Romanovsky, J. Cherry, C. Duguay, S. Goetz, M. T. Jorgenson, and M. Moghaddam, 2014: Opportunities to Use Remote Sensing in Understanding Permafrost and Related Ecological Characteristics: Report of a Workshop. The National Academies Press. 1-84 pp. doi: 10.17226/18711.
Gorham, E., 1991: Northern peatlands: Role in the carbon-cycle and probabable responses to climatic warming. Ecological Applications, 1(2), 182-195, doi: 10.2307/1941811.
Harden, J. W., R. K. Mark, E. T. Sundquist, and R. F. Stallard, 1992: Dynamics of soil carbon during deglaciation of the Laurentide Ice Sheet. Science, 258(5090), 1921-1924, doi: 10.1126/science.258.5090.1921.
Harden, J. W., S. E. Trumbore, B. J. Stocks, A. Hirsch, S. T. Gower, K. P. O’Neill, and E. S. Kasischke, 2000: The role of fire in the boreal carbon budget. Global Change Biology, 6, 174-184, doi: 10.1046/j.1365-2486.2000.06019.x.
Harden, J. W., C. D. Koven, C.-L. Ping, G. Hugelius, A. David McGuire, P. Camill, T. Jorgenson, P. Kuhry, G. J. Michaelson, J. A. O’Donnell, E. A. G. Schuur, C. Tarnocai, K. Johnson, and G. Grosse, 2012: Field information links permafrost carbon to physical vulnerabilities of thawing. Geophysical Research Letters, 39(15), doi: 10.1029/2012gl051958.
Hobbie, S. E., J. P. Schimel, S. E. Trumbore, and J. R. Randerson, 2000: Controls over carbon storage and turnover in high-latitude soils. Global Change Biology, 6, 196-210, doi: 10.1046/j.1365-2486.2000.06021.x.
Hoy, E. E., M. R. Turetsky, and E. S. Kasischke, 2016: More frequent burning increases vulnerability of Alaskan boreal black spruce forests. Environmental Research Letters, 11(9), 095001, doi: 10.1088/1748-9326/11/9/095001.
Hu, F. S., P. E. Higuera, J. E. Walsh, W. L. Chapman, P. A. Duffy, L. B. Brubaker, and M. L. Chipman, 2010: Tundra burning in Alaska: Linkages to climatic change and sea ice retreat. Journal of Geophysical Research: Biogeosciences, 115(G4), doi: 10.1029/2009JG001270.
Hu, F. S., P. E. Higuera, P. Duffy, M. L. Chipman, A. V. Rocha, A. M. Young, R. Kelly, and M. C. Dietze, 2015: Arctic tundra fires: Natural variability and responses to climate change. Frontiers in Ecology and the Environment, 13(7), 369-377, doi: 10.1890/150063.
Hugelius, G., J. Strauss, S. Zubrzycki, J. W. Harden, E. A. G. Schuur, C. L. Ping, L. Schirrmeister, G. Grosse, G. J. Michaelson, C. D. Koven, J. A. O’Donnell, B. Elberling, U. Mishra, P. Camill, Z. Yu, J. Palmtag, and P. Kuhry, 2014: Estimated stocks of circumpolar permafrost carbon with quantified uncertainty ranges and identified data gaps. Biogeosciences, 11(23), 6573-6593, doi: 10.5194/bg-11-6573-2014.
IPCC, 2013: The Physical Science Basis. Contribution of Working Group I to the Fifth Assessment Report of the Intergovernmental Panel On Climate Change. [T. Stocker, D. Qin, G.-K. Plattner, M. Tignor, S. Allen, J. Boschung, A. Nauels, Y. Xia, V. Bex, and P. Midgley (eds.).] Cambridge University Press, Cambridge, UK, and New York, NY, USA,1535 pp.
James, M., A. G. Lewkowicz, S. L. Smith, and C. M. Miceli, 2013: Multi-decadal degradation and persistence of permafrost in the Alaska Highway corridor, northwest Canada. Environmental Research Letters, 8(4), 045013, doi: 10.1088/1748-9326/8/4/045013.
Jia, G. J., H. E. Epstein, and D. A. Walker, 2003: Greening of Arctic Alaska, 1981–2001. Geophysical Research Letters, 30(20), doi: 10.1029/2003GL018268.
Jiang, Y., A. V. Rocha, J. A. O’Donnell, J. A. Drysdale, E. B. Rastetter, G. R. Shaver, and Q. Zhuang, 2015: Contrasting soil thermal responses to fire in Alaskan tundra and boreal forest. Journal of Geophysical Research: Earth Surface, 120(2), 363-378, doi: 10.1002/2014JF003180.
Jobbágy, E. G., and R. B. Jackson, 2000: The vertical distribution of soil organic carbon and its relation to climate and vegetation. Ecological Applications, 10(2), 423-436, doi: 10.1890/1051-0761(2000)010[0423:TVDOSO]2.0.CO;2.
Johnson, E. A., 1992: Fire and Vegetation Dynamics. Studies from the North American Boreal Forest. Cambridge University Press.
Johnson, K. D., J. Harden, A. D. McGuire, N. B. Bliss, J. G. Bockheim, M. Clark, T. Nettleton-Hollingsworth, M. T. Jorgenson, E. S. Kane, M. Mack, J. O’Donnell, C.-L. Ping, E. A. G. Schuur, M. R. Turetsky, and D. W. Valentine, 2011: Soil carbon distribution in Alaska in relation to soil-forming factors. Geoderma, 167-168, 71-84, doi: 10.1016/j.geoderma.2011.10.006.
Johnstone, J., L. Boby, E. Tissier, M. Mack, D. Verbyla, and X. Walker, 2009: Postfire seed rain of black spruce, a semiserotinous conifer, in forests of interior Alaska. Canadian Journal of Forest Research, 39(8), 1575-1588, doi: 10.1139/X09-068.
Johnstone, J. F., T. S. Rupp, M. Olson, and D. Verbyla, 2011: Modeling impacts of fire severity on successional trajectories and future fire behavior in Alaskan boreal forests. Landscape Ecology, 26(4), 487-500, doi: 10.1007/s10980-011-9574-6.
Johnstone, J. F., F. S. Chapin, T. N. Hollingsworth, M. C. Mack, V. Romanovsky, and M. Turetsky, 2010: Fire, climate change, and forest resilience in interior Alaska. Canadian Journal of Forest Research, 40(7), 1302-1312, doi: 10.1139/X10-061.
Jones, B., C. Kolden, R. Jandt, J. Abatzoglou, F. Urban, and C. Arp, 2009: Fire behavior, weather, and burn severity of the 2007 Anaktuvuk River tundra fire, North Slope, Alaska. Arctic, Antarctic, and Alpine Research, 41(3), 309-316, doi: 10.1657/1938-4246-41.3.309.
Jones, B. M., G. Grosse, C. D. Arp, E. Miller, L. Liu, D. J. Hayes, and C. F. Larsen, 2015: Recent Arctic tundra fire initiates widespread thermokarst development. Scientific Reports, 5, 15865, doi: 10.1038/srep15865.
Jones, M. C., J. Harden, J. O’Donnell, K. Manies, T. Jorgenson, C. Treat, and S. Ewing, 2017: Rapid carbon loss and slow recovery following permafrost thaw in boreal peatlands. Global Change Biology, 23(3), 1109-1127, doi: 10.1111/gcb.13403.
Jorgenson, M. T., 2013: Landscape-Level Ecological Mapping of Northern Alaska and Field Site Photography. Arctic Landscape Conservation Cooperative, US Fish and Wildlife Service. 48 pp. [URL]
Jorgenson, M. T., and J. Brown, 2005: Classification of the Alaskan Beaufort Sea coast and estimation of carbon and sediment inputs from coastal erosion. Geo-Marine Letters, 25(2), 69-80, doi: 10.1007/s00367-004-0188-8.
Jorgenson, M. T., Y. L. Shur, and E. R. Pullman, 2006: Abrupt increase in permafrost degradation in Arctic Alaska. Geophysical Research Letters, 33(2), L02503, doi: 10.1029/2005gl024960.
Jorgenson, M. T., J. W. Harden, M. Kanevskiy, J. A. O’Donnell, K. P. Wickland, S. A. Ewing, K. L. Manies, Q. Zhuang, Y. Shur, R. Striegl, and J. Koch, 2013: Reorganization of vegetation, hydrology and soil carbon after permafrost degradation across heterogeneous boreal landscapes. Environmental Research Letters, 8(3), 035017, doi: 10.1088/1748-9326/8/3/035017.
Ju, J., and J. G. Masek, 2016: The vegetation greenness trend in Canada and US Alaska from 1984–2012 Landsat data. Remote Sensing of Environment, 176, 1-16, doi: 10.1016/j.rse.2016.01.001.
Juncher Jørgensen, C., K. M. Lund Johansen, A. WestergaardNielsen, and B. Elberling, 2015: Net regional methane sink in high Arctic soils of northeast Greenland. Nature Geoscience, 8(1), 20-23, doi: 10.1038/ngeo2305.
Kasischke, E. S., and J. F. Johnstone, 2005: Variation in postfire organic layer thickness in a black spruce forest complex in interior Alaska and its effects on soil temperature and moisture. Canadian Journal of Forest Research, 35(9), 2164-2177, doi: 10.1139/x05-159.
Kasischke, E. S., and M. R. Turetsky, 2006: Recent changes in the fire regime across the North American boreal region—spatial and temporal patterns of burning across Canada and Alaska. Geophysical Research Letters, 33(9), doi: 10.1029/2006GL025677.
Kasischke, E. S., N. L. Christensen, and B. J. Stocks, 1995: Fire, global warming, and the carbon balance of boreal forests. Ecological Applications, 5(2), 437-451, doi: 10.2307/1942034.
Kelly, R., M. L. Chipman, P. E. Higuera, I. Stefanova, L. B. Brubaker, and F. S. Hu, 2013: Recent burning of boreal forests exceeds fire regime limits of the past 10,000 years. Proceedings of the National Academy of Sciences USA, 110(32), 13055-13060, doi: 10.1073/pnas.1305069110.
Kirschke, S., P. Bousquet, P. Ciais, M. Saunois, J. G. Canadell, E. J. Dlugokencky, P. Bergamaschi, D. Bergmann, D. R. Blake, L. Bruhwiler, P. Cameron-Smith, S. Castaldi, F. Chevallier, L. Feng, A. Fraser, M. Heimann, E. L. Hodson, S. Houweling, B. Josse, P. J. Fraser, P. B. Krummel, J.-F. Lamarque, R. L. Langenfelds, C. Le Quere, V. Naik, S. O’Doherty, P. I. Palmer, I. Pison, D. Plummer, B. Poulter, R. G. Prinn, M. Rigby, B. Ringeval, M. Santini, M. Schmidt, D. T. Shindell, I. J. Simpson, R. Spahni, L. P. Steele, S. A. Strode, K. Sudo, S. Szopa, G. R. van der Werf, A. Voulgarakis, M. van Weele, R. F. Weiss, J. E. Williams, and G. Zeng, 2013: Three decades of global methane sources and sinks. Nature Geoscience, 6(10), 813-823, doi: 10.1038/ngeo1955.
Knoblauch, C., C. Beer, A. Sosnin, D. Wagner, and E.-M. Pfeiffer, 2013: Predicting long-term carbon mineralization and trace gas production from thawing permafrost of northeast Siberia. Global Change Biology, 19(4), 1160-1172, doi: 10.1111/gcb.12116.
Kohnert, K., A. Serafimovich, S. Metzger, J. Hartmann, and T. Sachs, 2017: Strong geologic methane emissions from discontinuous terrestrial permafrost in the Mackenzie Delta, Canada. Science Report, 7(1), 5828, doi: 10.1038/s41598-017-05783-2.
Kokelj, S. V., T. C. Lantz, J. Tunnicliffe, R. Segal, and D. Lacelle, 2017: Climate-driven thaw of permafrost preserved glacial landscapes, northwestern Canada. Geology, 45(4), 371-374, doi: 10.1130/g38626.1.
Koven, C. D., W. J. Riley, and A. Stern, 2013: Analysis of permafrost thermal dynamics and response to climate change in the CMIP5 Earth system models. Journal of Climate, 26(6), 1877-1900, doi: 10.1175/jcli-d-12-00228.1.
Koven, C. D., B. Ringeval, P. Friedlingstein, P. Ciais, P. Cadule, D. Khvorostyanov, G. Krinner, and C. Tarnocai, 2011: Permafrost carbon-climate feedbacks accelerate global warming. Proceedings of the National Academy of Sciences USA, 108(36), 14769-14774, doi: 10.1073/pnas.1103910108.
Koven, C. D., E. A. G. Schuur, C. Schädel, T. J. Bohn, E. J. Burke, G. Chen, X. Chen, P. Ciais, G. Grosse, J. W. Harden, D. J. Hayes, G. Hugelius, E. E. Jafarov, G. Krinner, P. Kuhry, D. M. Lawrence, A. H. MacDougall, S. S. Marchenko, A. D. McGuire, S. M. Natali, D. J. Nicolsky, D. Olefeldt, S. Peng, V. E. Romanovsky, K. M. Schaefer, J. Strauss, C. C. Treat, and M. Turetsky, 2015: A simplified, data-constrained approach to estimate the permafrost carbon–climate feedback. Philosophical Transactions of the Royal Society A: Mathematical, Physical and Engineering Sciences, 373(2054), doi: 10.1098/rsta.2014.0423.
Kurz, W. A., G. Stinson, G. J. Rampley, C. C. Dymond, and E. T. Neilson, 2008: Risk of natural disturbances makes future contribution of Canada’s forests to the global carbon cycle highly uncertain. Proceedings of the National Academy of Sciences USA, 105(5), 1551-1555, doi: 10.1073/pnas.0708133105.
Lara, M. J., H. Genet, A. D. McGuire, E. S. Euskirchen, Y. Zhang, D. R. Brown, M. T. Jorgenson, V. Romanovsky, A. Breen, and W. R. Bolton, 2016: Thermokarst rates intensify due to climate change and forest fragmentation in an Alaskan boreal forest lowland. Global Change Biology, 22(2), 816-829, doi: 10.1111/gcb.13124.
Lawrence, D. M., A. G. Slater, and S. C. Swenson, 2012: Simulation of present-day and future permafrost and seasonally frozen ground conditions in CCSM4. Journal of Climate, 25(7), 2207-2225, doi: 10.1175/jcli-d-11-00334.1.
Lawrence, D. M., A. G. Slater, V. E. Romanovsky, and D. J. Nicolsky, 2008: Sensitivity of a model projection of near-surface permafrost degradation to soil column depth and representation of soil organic matter. Journal of Geophysical Research: Earth Surface, 113(F2), F02011, doi: 10.1029/2007JF000883.
Lee, H., S. C. Swenson, A. G. Slater, and D. M. Lawrence, 2014: Effects of excess ground ice on projections of permafrost in a warming climate. Environmental Research Letters, 9(12), 124006, doi: 10.1088/1748-9326/9/12/124006.
Lee, H., E. A. G. Schuur, K. S. Inglett, M. Lavoie, and J. P. Chanton, 2012: The rate of permafrost carbon release under aerobic and anaerobic conditions and its potential effects on climate. Global Change Biology, 18(2), 515-527, doi: 10.1111/j.1365-2486.2011.02519.x.
Liljedahl, A. K., J. Boike, R. P. Daanen, A. N. Fedorov, G. V. Frost, G. Grosse, L. D. Hinzman, Y. Iijma, J. C. Jorgenson, N. Matveyeva, M. Necsoiu, M. K. Raynolds, V. E. Romanovsky, J. Schulla, K. D. Tape, D. A. Walker, C. J. Wilson, H. Yabuki, and D. Zona, 2016: Pan-Arctic ice-wedge degradation in warming permafrost and its influence on tundra hydrology. Nature Geoscience, 9(4), 312-318, doi: 10.1038/ngeo2674.
Liu, L., K. Schaefer, T. Zhang, and J. Wahr, 2012: Estimating 1992–2000 average active layer thickness on the Alaskan north slope from remotely sensed surface subsidence. Journal of Geophysical Research: Earth Surface, 117(F1), doi: 10.1029/2011JF002041.
Loisel, J., Z. Yu, D. W. Beilman, P. Camill, J. Alm, M. J. Amesbury, D. Anderson, S. Andersson, C. Bochicchio, K. Barber, L. R. Belyea, J. Bunbury, F. M. Chambers, D. J. Charman, F. De Vleeschouwer, B. Fiałkiewicz-Kozieł, S. A. Finkelstein, M. Gałka, M. Garneau, D. Hammarlund, W. Hinchcliffe, J. Holmquist, P. Hughes, M. C. Jones, E. S. Klein, U. Kokfelt, A. Korhola, P. Kuhry, A. Lamarre, M. Lamentowicz, D. Large, M. Lavoie, G. MacDonald, G. Magnan, M. Mäkilä, G. Mallon, P. Mathijssen, D. Mauquoy, J. McCarroll, T. R. Moore, J. Nichols, B. O’Reilly, P. Oksanen, M. Packalen, D. Peteet, P. J. H. Richard, S. Robinson, T. Ronkainen, M. Rundgren, A. B. K. Sannel, C. Tarnocai, T. Thom, E.-S. Tuittila, M. Turetsky, M. Väliranta, M. van der Linden, B. van Geel, S. van Bellen, D. Vitt, Y. Zhao, and W. Zhou, 2014: A database and synthesis of northern peatland soil properties and Holocene carbon and nitrogen accumulation. The Holocene, 24(9), 1028-1042, doi: 10.1177/0959683614538073.
LTER, 2007: The Decadal Plan for LTER–Integrative Science for Society and the Environment: A Plan for Science, Education, and Cyberinfrastructure in the U.S. Long-Term Ecological Research Network. Publication Series No. 24, U.S. Long Term Ecological Research Network Office. [URL]
Luo, G. B., G. L. Zhang, and Z. T. Gong, 2000: A real evaluation of organic carbon pools in cryic soils of China. In: Global Climate Change and Cold Regions Ecosystems. [R. Lal, J. M. Kimble, and B. A. Stewart (eds.)]. Lewis Publisher, pp. 211-222.
MacDougall, A. H., C. A. Avis, and A. J. Weaver, 2012: Significant contribution to climate warming from the permafrost carbon feedback. Nature Geoscience, 5(10), 719-721, doi: 10.1038/ngeo1573.
MacDougall, A. H., and R. Knutti, 2016: Projecting the release of carbon from permafrost soils using a perturbed parameter ensemble modelling approach. Biogeosciences, 13(7), 2123-2136, doi: 10.5194/bg-13-2123-2016.
Mack, M. C., M. S. Bret-Harte, T. N. Hollingsworth, R. R. Jandt, E. A. G. Schuur, G. R. Shaver, and D. L. Verbyla, 2011: Carbon loss from an unprecedented Arctic tundra wildfire. Nature, 475(7357), 489-492, doi: 10.1038/nature10283.
Malkova, G. D., M. O. Leibman, D. S. Drozdov, V. I. Khomutova, A. A. Guuubarkov, and A. B. Sherstyukov, 2014: Impact of climate change on natural terrestrial systems. In: The Second Assessment Report of Roshydromet on Climate Change and Their Consequences on the Territory of the Russian Federation. [M. Roshydromet (ed.)]. pp 410-458. [URL]
Mann, D. H., T. Scott Rupp, M. A. Olson, and P. A. Duffy, 2012: Is Alaska’s boreal forest now crossing a major ecological threshold? Arctic, Antarctic, and Alpine Research, 44(3), 319-331, doi: 10.1657/1938-4246-44.3.319.
Margolis, H. A., R. F. Nelson, P. M. Montesano, A. Beaudoin, G. Sun, H.-E. Andersen, and M. A. Wulder, 2015: Combining satellite LIDAR, airborne LIDAR, and ground plots to estimate the amount and distribution of aboveground biomass in the boreal forest of North America. Canadian Journal of Forest Research, 45(7), 838-855, doi: 10.1139/cjfr-2015-0006.
Mastepanov, M., C. Sigsgaard, E. J. Dlugokencky, S. Houweling, L. Strom, M. P. Tamstorf, and T. R. Christensen, 2008: Large tundra methane burst during onset of freezing. Nature, 456(7222), 628-630, doi: 10.1038/nature07464.
McGuire, A. D., J. M. Melillo, D. W. Kicklighter, Y. Pan, X. Xiao, J. Helfrich, B. Moore, C. J. Vorosmarty, and A. L. Schloss, 1997: Equilibrium responses of global net primary production and carbon storage to doubled atmospheric carbon dioxide: Sensitivity to changes in vegetation nitrogen concentration. Global Biogeochemical Cycles, 11(2), 173-189, doi: 10.1029/97GB00059.
McGuire, A. D., L. G. Anderson, T. R. Christensen, S. Dallimore, L. D. Guo, D. J. Hayes, M. Heimann, T. D. Lorenson, R. W. Macdonald, and N. Roulet, 2009: Sensitivity of the carbon cycle in the Arctic to climate change. Ecological Monographs, 79(4), 523-555, doi: 10.1890/08-2025.1.
McGuire, A. D., T. R. Christensen, D. Hayes, A. Heroult, E. Euskirchen, J. S. Kimball, C. Koven, P. Lafleur, P. A. Miller, W. Oechel, P. Peylin, M. Williams, and Y. Yi, 2012: An assessment of the carbon balance of Arctic tundra: Comparisons among observations, process models, and atmospheric inversions. Biogeosciences, 9(8), 3185-3204, doi: 10.5194/bg-9-3185-2012.
McGuire, A. D., C. Koven, D. M. Lawrence, J. S. Clein, J. Xia, C. Beer, E. Burke, G. Chen, X. Chen, C. Delire, E. Jafarov, A. H. MacDougall, S. Marchenko, D. Nicolsky, S. Peng, A. Rinke, K. Saito, W. Zhang, R. Alkama, T. J. Bohn, P. Ciais, B. Decharme, A. Ekici, I. Gouttevin, T. Hajima, D. J. Hayes, D. Ji, G. Krinner, D. P. Lettenmaier, Y. Luo, P. A. Miller, J. C. Moore, V. Romanovsky, C. Schädel, K. Schaefer, E. A. G. Schuur, B. Smith, T. Sueyoshi, and Q. Zhuang, 2016: Variability in the sensitivity among model simulations of permafrost and carbon dynamics in the permafrost region between 1960 and 2009. Global Biogeochemical Cycles, 30(7), 1015-1037, doi: 10.1002/2016gb005405.
McGuire, A. D., D. M. Lawrence, C. Koven, J. S. Clein, E. Burke, G. Chen, E. Jafarov, A. H. MacDougall, S. Marchenko, D. Nicolsky, S. Peng, A. Rinke, P. Ciais, I. Gouttevin, D. J. Hayes, D. Ji, G. Krinner, J. C. Moore, V. Romanovsky, C. Schadel, K. Schaefer, E. A. G. Schuur, and Q. Zhuang, 2018: Dependence of the evolution of carbon dynamics in the northern permafrost region on the trajectory of climate change. Proceedings of the National Academy of Sciences USA, 115(15), 3882-3887, doi: 10.1073/pnas.1719903115.
Melillo, J. M., T.C. Richmond, and E. G.W. Yohe (eds.), 2014: Climate Change Impacts in the United States: The Third National Climate Assessment. U.S. Global Change Research Program, 841, [URL]
Melnikov, V. P., D. S. Drozdov, and V. V. Pendin, 2015: Arctic permafrost: Dynamics, risks, problems and solutions. In: Moscow, XXII International Science-Practical Conference: New Ideas In Earth Science, 123-138.
Melvin, A. M., M. C. Mack, J. F. Johnstone, A. David McGuire, H. Genet, and E. A. G. Schuur, 2015: Differences in ecosystem carbon distribution and nutrient cycling linked to forest tree species composition in a mid-successional boreal forest. Ecosystems, 18(8), 1472-1488, doi: 10.1007/s10021-015-9912-7.
Miller, S. M., C. E. Miller, R. Commane, R. Y. W. Chang, S. J. Dinardo, J. M. Henderson, A. Karion, J. Lindaas, J. R. Melton, J. B. Miller, C. Sweeney, S. C. Wofsy, and A. M. Michalak, 2016: A multiyear estimate of methane fluxes in Alaska from CARVE atmospheric observations. Global Biogeochemical Cycles, 30(10), 1441-1453, doi: 10.1002/2016GB005419.
Mishra, U., and W. J. Riley, 2012: Alaskan soil carbon stocks: Spatial variability and dependence on environmental factors. Biogeosciences, 9(9), 3637-3645, doi: 10.5194/bg-9-3637-2012.
Mu, C., T. Zhang, Q. Wu, X. Peng, B. Cao, X. Zhang, B. Cao, and G. Cheng, 2015: Editorial: Organic carbon pools in permafrost regions on the Qinghai–Xizang (Tibetan) Plateau. Cryosphere, 9(2), 479-486, doi: 10.5194/tc-9-479-2015.
Mu, M., J. T. Randerson, G. R. van der Werf, L. Giglio, P. Kasibhatla, D. Morton, G. J. Collatz, R. S. DeFries, E. J. Hyer, E. M. Prins, D. W. T. Griffith, D. Wunch, G. C. Toon, V. Sherlock, and P. O. Wennberg, 2011: Daily and 3-hourly variability in global fire emissions and consequences for atmospheric model predictions of carbon monoxide. Journal of Geophysical Research: Atmospheres, 116(D24), doi: 10.1029/2011JD016245.
Neigh, C. S. R., R. F. Nelson, K. J. Ranson, H. A. Margolis, P. M. Montesano, G. Sun, V. Kharuk, E. Næsset, M. A. Wulder, and H.-E. Andersen, 2013: Taking stock of circumboreal forest carbon with ground measurements, airborne and spaceborne LIDAR. Remote Sensing of Environment, 137, 274-287, doi: 10.1016/j.rse.2013.06.019.
Noetzli, J., H. H. Christiansen, M. Guglielmin, V. E. Romanovsky, N. I. Shiklomanov, S. L. Smith, and L. Zhao, 2016: Global climates: Crypsphere, permafrost thermal state. In: State of the Climate in 2015. Bulletin of the American Meteorological Society, pp. S20–S22.
NOAA, 2012: Arctic Report Card: Update for 2012. [M. O. Jeffries, J. Richter-Menge, and J. E. Overland (eds.)].
Olefeldt, D., M. R. Turetsky, P. M. Crill, and A. D. McGuire, 2013: Environmental and physical controls on northern terrestrial methane emissions across permafrost zones. Global Change Biology, 19(2), 589-603, doi: 10.1111/gcb.12071.
Olefeldt, D., S. Goswami, G. Grosse, D. Hayes, G. Hugelius, P. Kuhry, A. D. McGuire, V. E. Romanovsky, A. B. K. Sannel, E. A. G. Schuur, and M. R. Turetsky, 2016: Circumpolar distribution and carbon storage of thermokarst landscapes. Nature Communications, 7, 13043, doi: 10.1038/ncomms13043.
Olson, D. M., E. Dinerstein, E. D. Wikramanayake, N. D. Burgess, G. V. N. Powell, E. C. Underwood, J. A. D’Amico, I. Itoua, H. E. Strand, J. C. Morrison, C. J. Loucks, T. F. Allnutt, T. H. Ricketts, Y. Kura, J. F. Lamoreux, W. W. Wettengel, P. Hedao, and K. R. Kassem, 2001: Terrestrial ecoregions of the world: A new map of life on Earth. BioScience, 51(11), 933, doi: 10.1641/0006-3568(2001)051[0933:teotwa]2.0.co;2.
Overland, J. E., M. Wang, J. E. Walsh, and J. C. Stroeve, 2014: Future Arctic climate changes: Adaptation and mitigation time scales. Earth’s Future, 2(2), 68-74, doi: 10.1002/2013EF000162.
Pan, Y., R. A. Birdsey, J. Fang, R. Houghton, P. E. Kauppi, W. A. Kurz, O. L. Phillips, A. Shvidenko, S. L. Lewis, J. G. Canadell, P. Ciais, R. B. Jackson, S. W. Pacala, A. D. McGuire, S. Piao, A. Rautiainen, S. Sitch, and D. Hayes, 2011: A large and persistent carbon sink in the world’s forests. Science, 333(6045), 988-993, doi: 10.1126/science.1201609.
Parazoo, N. C., R. Commane, S. C. Wofsy, C. D. Koven, C. Sweeney, D. M. Lawrence, J. Lindaas, R. Y.-W. Chang, and C. E. Miller, 2016: Detecting regional patterns of changing CO2 flux in Alaska. Proceedings of the National Academy of Sciences USA, 113(28), 7733-7738, doi: 10.1073/pnas.1601085113.
Pastick, N. J., M. T. Jorgenson, B. K. Wylie, B. J. Minsley, L. Ji, M. A. Walvoord, B. D. Smith, J. D. Abraham, and J. R. Rose, 2013: Extending airborne electromagnetic surveys for regional active layer and permafrost mapping with remote sensing and ancillary data, Yukon Flats Ecoregion, central Alaska. Permafrost and Periglacial Processes, 24(3), 184-199, doi: 10.1002/ppp.1775.
Phoenix, G. K., and J. W. Bjerke, 2016: Arctic browning: Extreme events and trends reversing Arctic greening. Global Change Biology, 22(9), 2960-2962, doi: 10.1111/gcb.13261.
Ping, C. L., G. J. Michaelson, J. M. Kimble, V. E. Romanovsky, Y. L. Shur, D. K. Swanson, and D. A. Walker, 2008: Cryogenesis and soil formation along a bioclimate gradient in Arctic North America. Journal of Geophysical Research: Biogeosciences, 113(G3), doi: 10.1029/2008jg000744.
Pithan, F., and T. Mauritsen, 2014: Arctic amplification dominated by temperature feedbacks in contemporary climate models. Nature Geoscience, 7(3), 181-184, doi: 10.1038/ngeo2071.
Post, W. M., W. R. Emanuel, P. J. Zinke, and A. G. Stangenberger, 1982: Soil carbon pools and world life zones. Nature, 298, 156-159, doi: 10.1038/298156a0.
Potter, C. S., and S. A. Klooster, 1997: Global model estimates of carbon and nitrogen storage in litter and soil pools: Response to changes in vegetation quality and biomass allocation. Tellus B: Chemical and Physical Meteorology, 49(1), 1-17, doi: 10.3402/tellusb.v49i1.15947.
Qian, H., R. Joseph, and N. Zeng, 2010: Enhanced terrestrial carbon uptake in the northern high latitudes in the 21st century from the coupled carbon cycle climate model intercomparison project model projections. Global Change Biology, 16(2), 641-656, doi: 10.1111/j.1365-2486.2009.01989.x.
Rachold, V., M. N. Grigoriev, F. E. Are, S. Solomon, E. Reimnitz, H. Kassens, and M. Antonow, 2000: Coastal erosion vs riverine sediment discharge in the Arctic Shelf seas. International Journal of Earth Sciences, 89(3), 450-460, doi: 10.1007/s005310000113.
Rachold, V., H. Eicken, V. V. Gordeev, M. N. Grigoriev, H.W. Hubberten, A. P. Lisitzin, V. P. Shevchenko, and L. Schirrmeister, 2004: Modern terrigenous organic carbon input to the Arctic Ocean. In: The Organic Carbon Cycle in the Arctic Ocean. [R. Stein and R. W. MacDonald (eds.)]. Springer Berlin Heidelberg, 33-55 pp.
Rachold, V., D. Y. Bolshiyanov, M. N. Grigoriev, H.-W. Hubberten, R. Junker, V. V. Kunitsky, F. Merker, P. Overduin, and W. Schneider, 2007: Nearshore Arctic subsea permafrost in transition. Eos, Transactions American Geophysical Union, 88(13), 149-150, doi: 10.1029/2007EO130001.
Racine, C. H., R. Jandt, C. P. Meyer, and J. Dennis, 2004: Tundra fire and vegetation change along a hillslope on the Seward Peninsula, Alaska, USA. Arctic, Antarctic, and Alpine Research, 36(1), 1-10, doi: 10.1657/1523-0430(2004)036[0001:tfavca]2.0.co;2.
Randerson, J. T., Y. Chen, G. R. van der Werf, B. M. Rogers, and D. C. Morton, 2012: Global burned area and biomass burning emissions from small fires. Journal of Geophysical Research: Biogeosciences, 117(G4), doi: 10.1029/2012JG002128.
Randerson, J. T., H. Liu, M. G. Flanner, S. D. Chambers, Y. Jin, P. G. Hess, G. Pfister, M. C. Mack, K. K. Treseder, L. R. Welp, F. S. Chapin, J. W. Harden, M. L. Goulden, E. Lyons, J. C. Neff, E. A. G. Schuur, and C. S. Zender, 2006: The impact of boreal forest fire on climate warming. Science, 314(5802), 1130-1132, doi: 10.1126/science.1132075.
Raynolds, M. K., D. A. Walker, H. E. Epstein, J. E. Pinzon, and C. J. Tucker, 2012: A new estimate of tundra-biome phytomass from trans-Arctic field data and AVHRR NDVI. Remote Sensing Letters, 3(5), 403-411, doi: 10.1080/01431161.2011.609188.
Raz-Yaseef, N., M. S. Torn, Y. Wu, D. P. Billesbach, A. K. Liljedahl, T. J. Kneafsey, V. E. Romanovsky, D. R. Cook, and S. D. Wullschleger, 2016: Large CO2 and CH4 emissions from polygonal tundra during spring thaw in northern Alaska. Geophysical Research Letters, 44(1), 504-513, doi: 10.1002/2016GL071220.
Riley, W. J., Z. M. Subin, D. M. Lawrence, S. C. Swenson, M. S. Torn, L. Meng, N. M. Mahowald, and P. Hess, 2011: Barriers to predicting changes in global terrestrial methane fluxes: Analyses using CLM4Me, a methane biogeochemistry model integrated in CESM. Biogeosciences, 8(7), 1925-1953, doi: 10.5194/bg-8-1925-2011.
Rocha, A. V., M. M. Loranty, P. E. Higuera, M. C. Mack, F. S. Hu, B. M. Jones, A. L. Breen, E. B. Rastetter, S. J. Goetz, and G. R. Shaver, 2012: The footprint of Alaskan tundra fires during the past half-century: Implications for surface properties and radiative forcing. Environmental Research Letters, 7(4), 044039, doi: 10.1088/1748-9326/7/4/044039.
Rogers, J. C., and J. L. Morack, 1980: Geophysical evidence of shallow nearshore permafrost, Prudhoe Bay, Alaska. Journal of Geophysical Research: Solid Earth, 85(B9), 4845-4853, doi: 10.1029/JB085iB09p04845.
Romanovsky, V. E., S. L. Smith, and H. H. Christiansen, 2010: Permafrost thermal state in the polar Northern Hemisphere during the international polar year 2007–2009: A synthesis. Permafrost and Periglacial Processes, 21(2), 106-116, doi: 10.1002/ppp.689.
Romanovsky, V. E., S. L. Smith, K. Isaksen, N. I. Shiklomanov, D. A. Streletskiy, A. L. Kholodov, H. H. Christiansen, D. S. Drozdov, G. V. Malkova, and S. S. Marchenko, 2016: The Arctic: Terrestrial permafrost. In: State of the Climate in 2015, Bulletin of the American Meteorological Society, S149-S152 pp.
Rupp, T. S., P. Duffy, M. Leonawicz, M. Lindgren, A. Breen, T. Kurkowski, A. Floyd, A. Bennett, and L. Krutikov, 2016: Climate scenarios, land cover, and wildland fire. In: Baseline and Projected Future Carbon Storage and Greenhouse-Gas Fluxes in Ecosystems of Alaska, pp. 17-52. [Z. Zhu and A. D. McGuire (eds.)].
Ruppel, C. D., and J. D. Kessler, 2017: The interaction of climate change and methane hydrates. Reviews of Geophysics, doi: 10.1002/2016RG000534.
Salmon, V. G., P. Soucy, M. Mauritz, G. Celis, S. M. Natali, M. C. Mack, and E. A. G. Schuur, 2016: Nitrogen availability increases in a tundra ecosystem during five years of experimental permafrost thaw. Global Change Biology, 22(5), 1927–1941, doi: 10.1111/gcb.13204.
Saugier, B., J. Roy, and H. A. Mooney, 2001: Estimations of global terrestrial productivity: Converging toward a single number? Terrestrial global productivity, Academic Press, pp. 543-557. [URL]
Schädel, C., E. A. G. Schuur, R. Bracho, B. Elberling, C. Knoblauch, H. Lee, Y. Luo, G. R. Shaver, and M. R. Turetsky, 2014: Circumpolar assessment of permafrost C quality and its vulnerability over time using long-term incubation data. Global Change Biology, 20(2), 641-652, doi: 10.1111/gcb.12417.
Schädel, C., M. K. F. Bader, E. A. G. Schuur, C. Biasi, R. Bracho, P. Capek, S. De Baets, K. Diakova, J. Ernakovich, C. Estop-Aragones, D. E. Graham, I. P. Hartley, C. M. Iversen, E. Kane, C. Knoblauch, M. Lupascu, P. J. Martikainen, S. M. Natali, R. J. Norby, J. A. O/’Donnell, T. R. Chowdhury, H. Santruckova, G. Shaver, V. L. Sloan, C. C. Treat, M. R. Turetsky, M. P. Waldrop, and K. P. Wickland, 2016: Potential carbon emissions dominated by carbon dioxide from thawed permafrost soils. Nature Climate Change, 6(10), 950-953, doi: 10.1038/nclimate3054.
Schaefer, K., T. Zhang, L. Bruhwiler, and A. P. Barrett, 2011: Amount and timing of permafrost carbon release in response to climate warming. Tellus B: Chemical and Physical Meteorology, 63(2), 165-180, doi: 10.1111/j.1600-0889.2011.00527.x.
Schaefer, K., H. Lantuit, V. E. Romanovsky, E. A. G. Schuur, and R. Witt, 2014: The impact of the permafrost carbon feedback on global climate. Environmental Research Letters, 9(8), 085003, doi: 10.1088/1748-9326/9/8/085003.
Schaphoff, S., U. Heyder, S. Ostberg, D. Gerten, J. Heinke, and W. Lucht, 2013: Contribution of permafrost soils to the global carbon budget. Environmental Research Letters, 8(1), 014026, doi: 10.1088/1748-9326/8/1/014026.
Schirrmeister, L., C. Siegert, V. V. Kunitzky, P. M. Grootes, and H. Erlenkeuser, 2002: Late quaternary ice-rich permafrost sequences as a paleoenvironmental archive for the Laptev Sea region in northern Siberia. International Journal of Earth Sciences, 91(1), 154-167, doi: 10.1007/s005310100205.
Schirrmeister, L., G. Grosse, S. Wetterich, P. P. Overduin, J. Strauss, E. A. G. Schuur, and H.-W. Hubberten, 2011: Fossil organic matter characteristics in permafrost deposits of the northeast Siberian Arctic. Journal of Geophysical Research: Biogeosciences, 116(G2), G00M02, doi: 10.1029/2011jg001647.
Schneider von Deimling, T., M. Meinshausen, A. Levermann, V. Huber, K. Frieler, D. M. Lawrence, and V. Brovkin, 2012: Estimating the near-surface permafrost-carbon feedback on global warming. Biogeosciences, 9(2), 649-665, doi: 10.5194/bg-9-649-2012.
Schneider von Deimling, T., G. Grosse, J. Strauss, L. Schirrmeister, A. Morgenstern, S. Schaphoff, M. Meinshausen, and J. Boike, 2015: Observation-based modelling of permafrost carbon fluxes with accounting for deep carbon deposits and thermokarst activity. Biogeosciences, 12(11), 3469-3488, doi: 10.5194/bg-12-3469-2015.
Schuur, E., A. D. McGuire, J. Johnstone, M. Mack, S. Rupp, E. Euskirchen, A. Melvin, H. Genet, A. Breen, X. Walker, M. Jean, and M. Frey, 2016: Identifying Indicators of State Change and Forecasting Future Vulnerability in Alaskan Boreal Ecosystems. Department of Defense Strategic Environmental Research and Development Program. SERDP Project RC-2109, 144 pp.
Schuur, E. A. G., A. D. McGuire, C. Schädel, G. Grosse, J. W. Harden, D. J. Hayes, G. Hugelius, C. D. Koven, P. Kuhry, D. M. Lawrence, S. M. Natali, D. Olefeldt, V. E. Romanovsky, K. Schaefer, M. R. Turetsky, C. C. Treat, and J. E. Vonk, 2015: Climate change and the permafrost carbon feedback. Nature, 520(7546), 171-179, doi: 10.1038/nature14338.
Schuur, E. A. G., B. W. Abbott, W. B. Bowden, V. Brovkin, P. Camill, J. G. Canadell, J. P. Chanton, F. S. Chapin, III, T. R. Christensen, P. Ciais, B. T. Crosby, C. I. Czimczik, G. Grosse, J. Harden, D. J. Hayes, G. Hugelius, J. D. Jastrow, J. B. Jones, T. Kleinen, C. D. Koven, G. Krinner, P. Kuhry, D. M. Lawrence, A. D. McGuire, S. M. Natali, J. A. O’Donnell, C. L. Ping, W. J. Riley, A. Rinke, V. E. Romanovsky, A. B. K. Sannel, C. Schädel, K. Schaefer, J. Sky, Z. M. Subin, C. Tarnocai, M. R. Turetsky, M. P. Waldrop, K. M. Walter Anthony, K. P. Wickland, C. J. Wilson, and S. A. Zimov, 2013: Expert assessment of vulnerability of permafrost carbon to climate change. Climatic Change, 119(2), 359-374, doi: 10.1007/s10584-013-0730-7.
Schuur, E. A. G., J. G. Vogel, K. G. Crummer, H. Lee, J. O. Sickman, and T. E. Osterkamp, 2009: The effect of permafrost thaw on old carbon release and net carbon exchange from tundra. Nature, 459(7246), 556-559, doi: 10.1038/nature08031.
Schuur, E. A. G., J. Bockheim, J. G. Canadell, E. Euskirchen, C. B. Field, S. V. Goryachkin, S. Hagemann, P. Kuhry, P. M. Lafleur, H. Lee, G. Mazhitova, F. E. Nelson, A. Rinke, V. E. Romanovsky, N. Shiklomanov, C. Tarnocai, S. Venevsky, J. G. Vogel, and S. A. Zimov, 2008: Vulnerability of permafrost carbon to climate change: Implications for the global carbon cycle. BioScience, 58(8), 701-714, doi: 10.1641/b580807.
Shakhova, N., I. Semiletov, I. Leifer, A. Salyuk, P. Rekant, and D. Kosmach, 2010: Geochemical and geophysical evidence of methane release over the east Siberian Arctic Shelf. Journal of Geophysical Research: Oceans, 115, C08007, doi: 10.1029/2009jc005602.
Shakhova, N., I. Semiletov, I. Leifer, V. Sergienko, A. Salyuk, D. Kosmach, D. Chernykh, C. Stubbs, D. Nicolsky, V. Tumskoy, and O. Gustafsson, 2014: Ebullition and storm-induced methane release from the east Siberian Arctic Shelf. Nature Geoscience, 7(1), 64-70, doi: 10.1038/ngeo2007.
Shaver, G. R., J. Canadell, F. S. Chapin, J. Gurevitch, J. Harte, G. Henry, P. Ineson, S. Jonasson, J. Melillo, L. Pitelka, and L. Rustad, 2000: Global warming and terrestrial ecosystems: A conceptual framework for analysis. BioScience, 50(10), 871-882, doi: 10.1641/0006-3568(2000)050[0871:GWATEA]2.0.CO;2.
Shiklomanov, N. I., D. A. Streletskiy, and F. E. Nelson, 2012: Northern Hemisphere component of the global Circumpolar Active Layer Monitoring (CALM) program. 10th International Conference on Permafrost, 377-382.
Shiklomanov, N. I., D. A. Streletskiy, J. D. Little, and F. E. Nelson, 2013: Isotropic thaw subsidence in undisturbed permafrost landscapes. Geophysical Research Letters, 40(24), 6356-6361, doi: 10.1002/2013GL058295.
Shur, Y. L., and M. T. Jorgenson, 2007: Patterns of permafrost formation and degradation in relation to climate and ecosystems. Permafrost and Periglacial Processes, 18(1), 7-19, doi: 10.1002/ppp.582.
Sistla, S. A., J. C. Moore, R. T. Simpson, L. Gough, G. R. Shaver, and J. P. Schimel, 2013: Long-term warming restructures Arctic tundra without changing net soil carbon storage. Nature, 497(7451), 615-618, doi: 10.1038/nature12129.
Slater, A. G., and D. M. Lawrence, 2013: Diagnosing present and future permafrost from climate models. Journal of Climate, 26(15), 5608-5623, doi: 10.1175/jcli-d-12-00341.1.
Smith, L. C., G. M. MacDonald, A. A. Velichko, D. W. Beilman, O. K. Borisova, K. E. Frey, K. V. Kremenetski, and Y. Sheng, 2004: Siberian peatlands a net carbon sink and global methane source since the early Holocene. Science, 303(5656), 353-356, doi: 10.1126/science.1090553.
Smith, S. L., S. A. Wolfe, D. W. Riseborough, and F. M. Nixon, 2009: Active-layer characteristics and summer climatic indices, Mackenzie Valley, Northwest Territories, Canada. Permafrost and Periglacial Processes, 20(2), 201-220, doi: 10.1002/ppp.651.
Smith, S. L., V. E. Romanovsky, A. G. Lewkowicz, C. R. Burn, M. Allard, G. D. Clow, K. Yoshikawa, and J. Throop, 2010: Thermal state of permafrost in North America: A contribution to the international polar year. Permafrost and Periglacial Processes, 21(2), 117-135, doi: 10.1002/ppp.690.
Stackpoole, S., D. Butman, D. Clow, K. Verdin, B. V. Gaglioti, and R. Striegl, 2016: Chapter 8. Carbon burial, transport, and emission from inland aquatic ecosystems in Alaska. Baseline and Projected Future Carbon Storage and Greenhouse-Gas Fluxes in Ecosystems of Alaska. Z. Zhu and A. D. McGuire, Eds., 196 pp. [URL]
Strauss, J., L. Schirrmeister, G. Grosse, S. Wetterich, M. Ulrich, U. Herzschuh, and H.-W. Hubberten, 2013: The deep permafrost carbon pool of the Yedoma region in Siberia and Alaska. Geophysical Research Letters, 40, 6165-6170, doi: 10.1002/2013gl058088.
Strauss, J., L. Schirrmeister, G. Grosse, D. Fortier, G. Hugelius, C. Knoblauch, V. Romanovsky, C. Schädel, T. Schneider von Deimling, E. A. G. Schuur, D. Shmelev, M. Ulrich, and A. Veremeeva, 2017: Deep Yedoma permafrost: A synthesis of depositional characteristics and carbon vulnerability. Earth-Science Reviews, 172, 75-86, doi: 10.1016/j.earscirev.2017.07.007.
Sweeney, C., E. Dlugokencky, C. E. Miller, S. Wofsy, A. Karion, S. Dinardo, R. Y. W. Chang, J. B. Miller, L. Bruhwiler, A. M. Crotwell, T. Newberger, K. McKain, R. S. Stone, S. E. Wolter, P. E. Lang, and P. Tans, 2016: No significant increase in long-term CH4 emissions on North Slope of Alaska despite significant increase in air temperature. Geophysical Research Letters, 43(12), 6604-6611, doi: 10.1002/2016GL069292.
Tarnocai, C., J. G. Canadell, E. A. G. Schuur, P. Kuhry, G. Mazhitova, and S. Zimov, 2009: Soil organic carbon pools in the northern circumpolar permafrost region. Global Biogeochemical Cycles, 23, Gb2023, doi: 10.1029/2008gb003327.
Treat, C. C., M. C. Jones, P. Camill, A. Gallego-Sala, M. Garneau, J. W. Harden, G. Hugelius, E. S. Klein, U. Kokfelt, P. Kuhry, J. Loisel, P. J. H. Mathijssen, J. A. O’Donnell, P. O. Oksanen, T. M. Ronkainen, A. B. K. Sannel, J. Talbot, C. Tarnocai, and M. Väliranta, 2016: Effects of permafrost aggradation on peat properties as determined from a pan-Arctic synthesis of plant macrofossils. Journal of Geophysical Research: Biogeosciences, 121(1), 78-94, doi: 10.1002/2015jg003061.
Turetsky, M. R., E. S. Kane, J. W. Harden, R. D. Ottmar, K. L. Manies, E. Hoy, and E. S. Kasischke, 2011a: Recent acceleration of biomass burning and carbon losses in Alaskan forests and peatlands. Nature Geoscience, 4(1), 27-31, doi: 10.1038/ngeo1027.
Turetsky, M. R., W. F. Donahue, and B. W. Benscoter, 2011b: Experimental drying intensifies burning and carbon losses in a northern peatland. Nature Communications, 2, 514, doi: 10.1038/ncomms1523.
van der Werf, G. R., J. T. Randerson, L. Giglio, G. J. Collatz, M. Mu, P. S. Kasibhatla, D. C. Morton, R. S. DeFries, Y. Jin, and T. T. van Leeuwen, 2010: Global fire emissions and the contribution of deforestation, savanna, forest, agricultural, and peat fires (1997–2009). Atmospheric Chemistry and Physics, 10(23), 11707-11735, doi: 10.5194/acp-10-11707-2010.
van Leeuwen, T. T., G. R. van der Werf, A. A. Hoffmann, R. G. Detmers, G. Rücker, N. H. F. French, S. Archibald, J. A. Carvalho Jr, G. D. Cook, W. J. de Groot, C. Hély, E. S. Kasischke, S. Kloster, J. L. McCarty, M. L. Pettinari, P. Savadogo, E. C. Alvarado, L. Boschetti, S. Manuri, C. P. Meyer, F. Siegert, L. A. Trollope, and W. S. W. Trollope, 2014: Biomass burning fuel consumption rates: A field measurement database. Biogeosciences, 11(24), 7305-7329, doi: 10.5194/bg-11-7305-2014.
Walker, D. A., M. K. Raynolds, F. J. A. Daniëls, E. Einarsson, A. Elvebakk, W. A. Gould, A. E. Katenin, S. S. Kholod, C. J. Markon, E. S. Melnikov, N. G. Moskalenko, S. S. Talbot, and B. A. Yurtsev, 2009: The Circumpolar Arctic vegetation map. Journal of Vegetation Science, 16(3), 267-282, doi: 10.1111/j.1654-1103.2005.tb02365.x.
Walter Anthony, K., R. Daanen, P. Anthony, T. Schneider von Deimling, C.-L. Ping, J. P. Chanton, and G. Grosse, 2016: Methane emissions proportional to permafrost carbon thawed in Arctic lakes since the 1950s. Nature Geoscience, 9, 679-682, doi: 10.1038/ngeo2795.
Walter Anthony, K. M., P. Anthony, G. Grosse, and J. Chanton, 2012: Geologic methane seeps along boundaries of Arctic permafrost thaw and melting glaciers. Nature Geoscience, 5(6), 419-426, doi: 10.1038/ngeo1480.
Walter Anthony, K. M., S. A. Zimov, G. Grosse, M. C. Jones, P. M. Anthony, F. S. C. Iii, J. C. Finlay, M. C. Mack, S. Davydov, P. Frenzel, and S. Frolking, 2014: A shift of thermokarst lakes from carbon sources to sinks during the Holocene epoch. Nature, 511(7510), 452-456, doi: 10.1038/nature13560.
Walter, K. M., M. E. Edwards, G. Grosse, S. A. Zimov, and F. S. Chapin, 2007: Thermokarst lakes as a source of atmospheric CH4 during the last deglaciation. Science, 318(5850), 633-636, doi: 10.1126/science.1142924.
Wang, G., Y. Li, Y. Wang, and Q. Wu, 2008: Effects of permafrost thawing on vegetation and soil carbon pool losses on the Qinghai–Tibet Plateau, China. Geoderma, 143(1–2), 143-152, doi: 10.1016/j.geoderma.2007.10.023.
Wik, M., R. K. Varner, K. W. Anthony, S. MacIntyre, and D. Bastviken, 2016: Climate-sensitive northern lakes and ponds are critical components of methane release. Nature Geoscience, 9, 99-105, doi: 10.1038/ngeo2578.
World Wildlife Fund, 2012: Terrestrial ecoregions of the world. [URL]
Xu, X., W. J. Riley, C. D. Koven, D. P. Billesbach, R. Y. W. Chang, R. Commane, E. S. Euskirchen, S. Hartery, Y. Harazono, H. Iwata, K. C. McDonald, C. E. Miller, W. C. Oechel, B. Poulter, N. RazYaseef, C. Sweeney, M. Torn, S. C. Wofsy, Z. Zhang, and D. Zona, 2016: A multi-scale comparison of modeled and observed seasonal methane emissions in northern wetlands. Biogeosciences, 13(17), 5043-5056, doi: 10.5194/bg-13-5043-2016.
Young, A. M., P. E. Higuera, P. A. Duffy, and F. S. Hu, 2016: Climatic thresholds shape northern high-latitude fire regimes and imply vulnerability to future climate change. Ecography.
Yue, C., P. Ciais, D. Zhu, T. Wang, S. S. Peng, and S. L. Piao, 2016: How have past fire disturbances contributed to the current carbon balance of boreal ecosystems? Biogeosciences, 13(3), 675-690, doi: 10.5194/bg-13-675-2016.
Zhang, T., J. A. Heginbottom, R. G. Barry, and J. Brown, 2000: Further statistics on the distribution of permafrost and ground ice in the Northern Hemisphere. Polar Geography, 24(2), 126-131, doi: 10.1080/10889370009377692.
Zhuang, Q., J. M. Melillo, M. C. Sarofim, D. W. Kicklighter, A. D. McGuire, B. S. Felzer, A. Sokolov, R. G. Prinn, P. A. Steudler, and S. Hu, 2006: CO2 and CH4 exchanges between land ecosystems and the atmosphere in northern high latitudes over the 21st century. Geophysical Research Letters, 33(17), doi: 10.1029/2006gl026972.
Zimov, S. A., E. A. G. Schuur, and F. S. Chapin, 2006: Permafrost and the global carbon budget. Science, 312(5780), 1612-1613, doi: 10.1126/science.1128908.
Zona, D., B. Gioli, R. Commane, J. Lindaas, S. C. Wofsy, C. E. Miller, S. J. Dinardo, S. Dengel, C. Sweeney, A. Karion, R. Y.-W. Chang, J. M. Henderson, P. C. Murphy, J. P. Goodrich, V. Moreaux, A. Liljedahl, J. D. Watts, J. S. Kimball, D. A. Lipson, and W. C. Oechel, 2016: Cold season emissions dominate the Arctic tundra methane budget. Proceedings of the National Academy of Sciences USA, 113(1), 40-45, doi: 10.1073/pnas.1516017113.
Carbon dioxide equivalent (CO2e): Amount of CO2 that would produce the same effect on the radiative balance of Earth’s climate system as another greenhouse gas, such as methane (CH4) or nitrous oxide (N2O), on a 100-year timescale. For comparison to units of carbon, each kg CO2e is equivalent to 0.273 kg C (0.273 = 1/3.67). See Box P.2, p. 12, in the Preface for more details.↩