Agricultural greenhouse gas (GHG) emissions in 2015 totaled 567 teragrams (Tg)1 of carbon dioxide equivalent (CO2e)2 in the United States and 60 Tg CO2e in Canada, not including land-use change; for Mexico, total agricultural GHG emissions were 80 Tg CO2e in 2014 (not including land-use change) (high confidence). The major agricultural non-CO2 emission sources were nitrous oxide (N2O) from cropped and grazed soils and enteric methane (CH4) from livestock (very high confidence, very likely).3
Agricultural regional carbon budgets and net emissions are directly affected by human decision making. Trends in food production and agricultural management, and thus carbon budgets, can fluctuate significantly with changes in global markets, diets, consumer demand, regional policies, and incentives (very high confidence).
Most cropland carbon stocks are in the soil, and cropland management practices can increase or decrease soil carbon stocks. Integration of practices that can increase soil carbon stocks include maintaining land cover with vegetation (especially deep-rooted perennials and cover crops), protecting the soil from erosion (using reduced or no tillage), and improving nutrient management. The magnitude and longevity of management-related carbon stock changes have strong environmental and regional differences, and they are subject to subsequent changes in management practices (high confidence, likely).
North America’s growing population can achieve benefits such as reduced GHG emissions, lowered net global warming potential, increased water and air quality, reduced CH4 flux in flooded or relatively anoxic systems, and increased food availability by optimizing nitrogen fertilizer management to sustain crop yields and reduce nitrogen losses to air and water (high confidence, likely).
Various strategies are available to mitigate livestock enteric and manure CH4 emissions. Promising and readily applicable technologies can reduce enteric CH4 emissions from ruminants by 20% to 30%. Other mitigation technologies can reduce manure CH4 emissions by 30% to 50%, on average, and in some cases as much as 80%. Methane mitigation strategies have to be evaluated on a production-system scale to account for emission tradeoffs and co-benefits such as improved feed efficiency or productivity in livestock (high confidence, likely).
Projected climate change likely will increase CH4 emissions from livestock manure management locations, but it will have a lesser impact on enteric CH4 emissions (high confidence). Potential effects of climate change on agricultural soil carbon stocks are difficult to assess because they will vary according to the nature of the change, onsite ecosystem characteristics, production system, and management type (high confidence).
Very High | Likely | As Likely As Not | Unlikely | Very Unlikely |
---|---|---|---|---|
≥ 9 in 10 | ≥ 2 in 3 | ≈ 1 in 2 | ≤ 1 in 3 | ≤ 1 in 10 |
Note: Confidence levels are provided as appropriate for quantitative, but not qualitative, Key Findings and statements. See Guide to this Report for more on uncertainty of numerical estimates.
<b>Hristov</b>, A. N., J. M. F. <b>Johnson</b>, C. W. Rice, M. E. Brown, R. T. Conant, S. J. Del Grosso, N. P. Gurwick, C. A. Rotz, U. M. Sainju, R. H. Skinner, T. O. West, B. R. K. Runkle, H. Janzen, S. C. Reed, N. Cavallaro, and G. Shrestha, 2018: Chapter 5: Agriculture. In Second State of the Carbon Cycle Report (SOCCR2): A Sustained Assessment Report [Cavallaro, N., G. Shrestha, R. Birdsey, M. A. Mayes, R. G. Najjar, S. C. Reed, P. Romero-Lankao, and Z. Zhu (eds.)]. U.S. Global Change Research Program, Washington, DC, USA, pp. 229-263, https://doi.org/10.7930/SOCCR2.2018.Ch5.
Agricultural production is a fundamental activity conducted on 45% of the U.S. land area, 55% of Mexico’s land area, and 7% of Canada’s land area (World Bank 2016). Because of this vast spatial extent and the strong role that land management plays in how agricultural ecosystems function, agricultural lands and activities represent a large portion of the North American carbon budget. Accordingly, improved quantification of the agricultural carbon cycle, new trends in agriculture, and added opportunities for emissions reductions provide a critical foundation for considering the relationships between agriculture and carbon cycling at local, regional, continental, and global scales. More than 145 countries have specifically included agriculture in their targets and actions for mitigating climate change (FAO 2016), and agriculture has featured particularly prominently in recent target and action commitments made by developing countries to reduce greenhouse gas (GHG) emissions (Richards et al., 2015).
Conversion of vast native forest and prairie to agriculture across North America between 1860 and 1960 resulted in carbon dioxide (CO2) fluxes to the atmosphere from biota and soils that exceeded those from fossil fuel emissions over the same period (Houghton et al., 1983). Correspondingly, soil organic carbon (SOC) declined in many soils during the 50 years following conversion from native ecosystems to production agriculture (Huggins et al., 1998; Janzen et al., 1998; Slobodian et al., 2002). Crop yields and corresponding above- and belowground biomass have steadily increased since the 1930s due to genetic and management innovations, which provide more organic input from which to build SOC (Johnson et al., 2006; Hatfield and Walthall 2015). This, coupled with improved input-use efficiencies may reduce GHG-emissions per unit yield (GHG intensity), with additional improvements possible through management optimization (Grassini and Cassman 2012; Pittelkow et al., 2015). Options include reducing tillage, integrating perennials onto the landscape, reducing or eliminating bare-fallow land (i.e., land without living plants), adding cover crops, and enrolling lands in conservation easement programs. These options, originally proposed to control erosion, have potential co-benefits in terms of increased soil health, plant productivity, and soil carbon stabilization (Lehman et al., 2015). Conversely, returning lands previously enrolled in conservation easements (e.g., the Conservation Reserve Program [CRP] and other land set-aside efforts) to row-crop production, tillage, or aggressive harvesting of crop residues all risk degrading soil quality and exacerbating SOC loss. Of note is that the net results of land use and land management practices in an agricultural setting vary according to many factors, such as crop or production system type, soil type, climate, and the collection of practices at any given site. For example, many traditional practices followed by Indigenous people on tribal lands are based on an integrated approach to natural resource management and response to environmental change that may provide agricultural options uniquely suited to varied environmental settings (see Ch. 7: Tribal Lands).
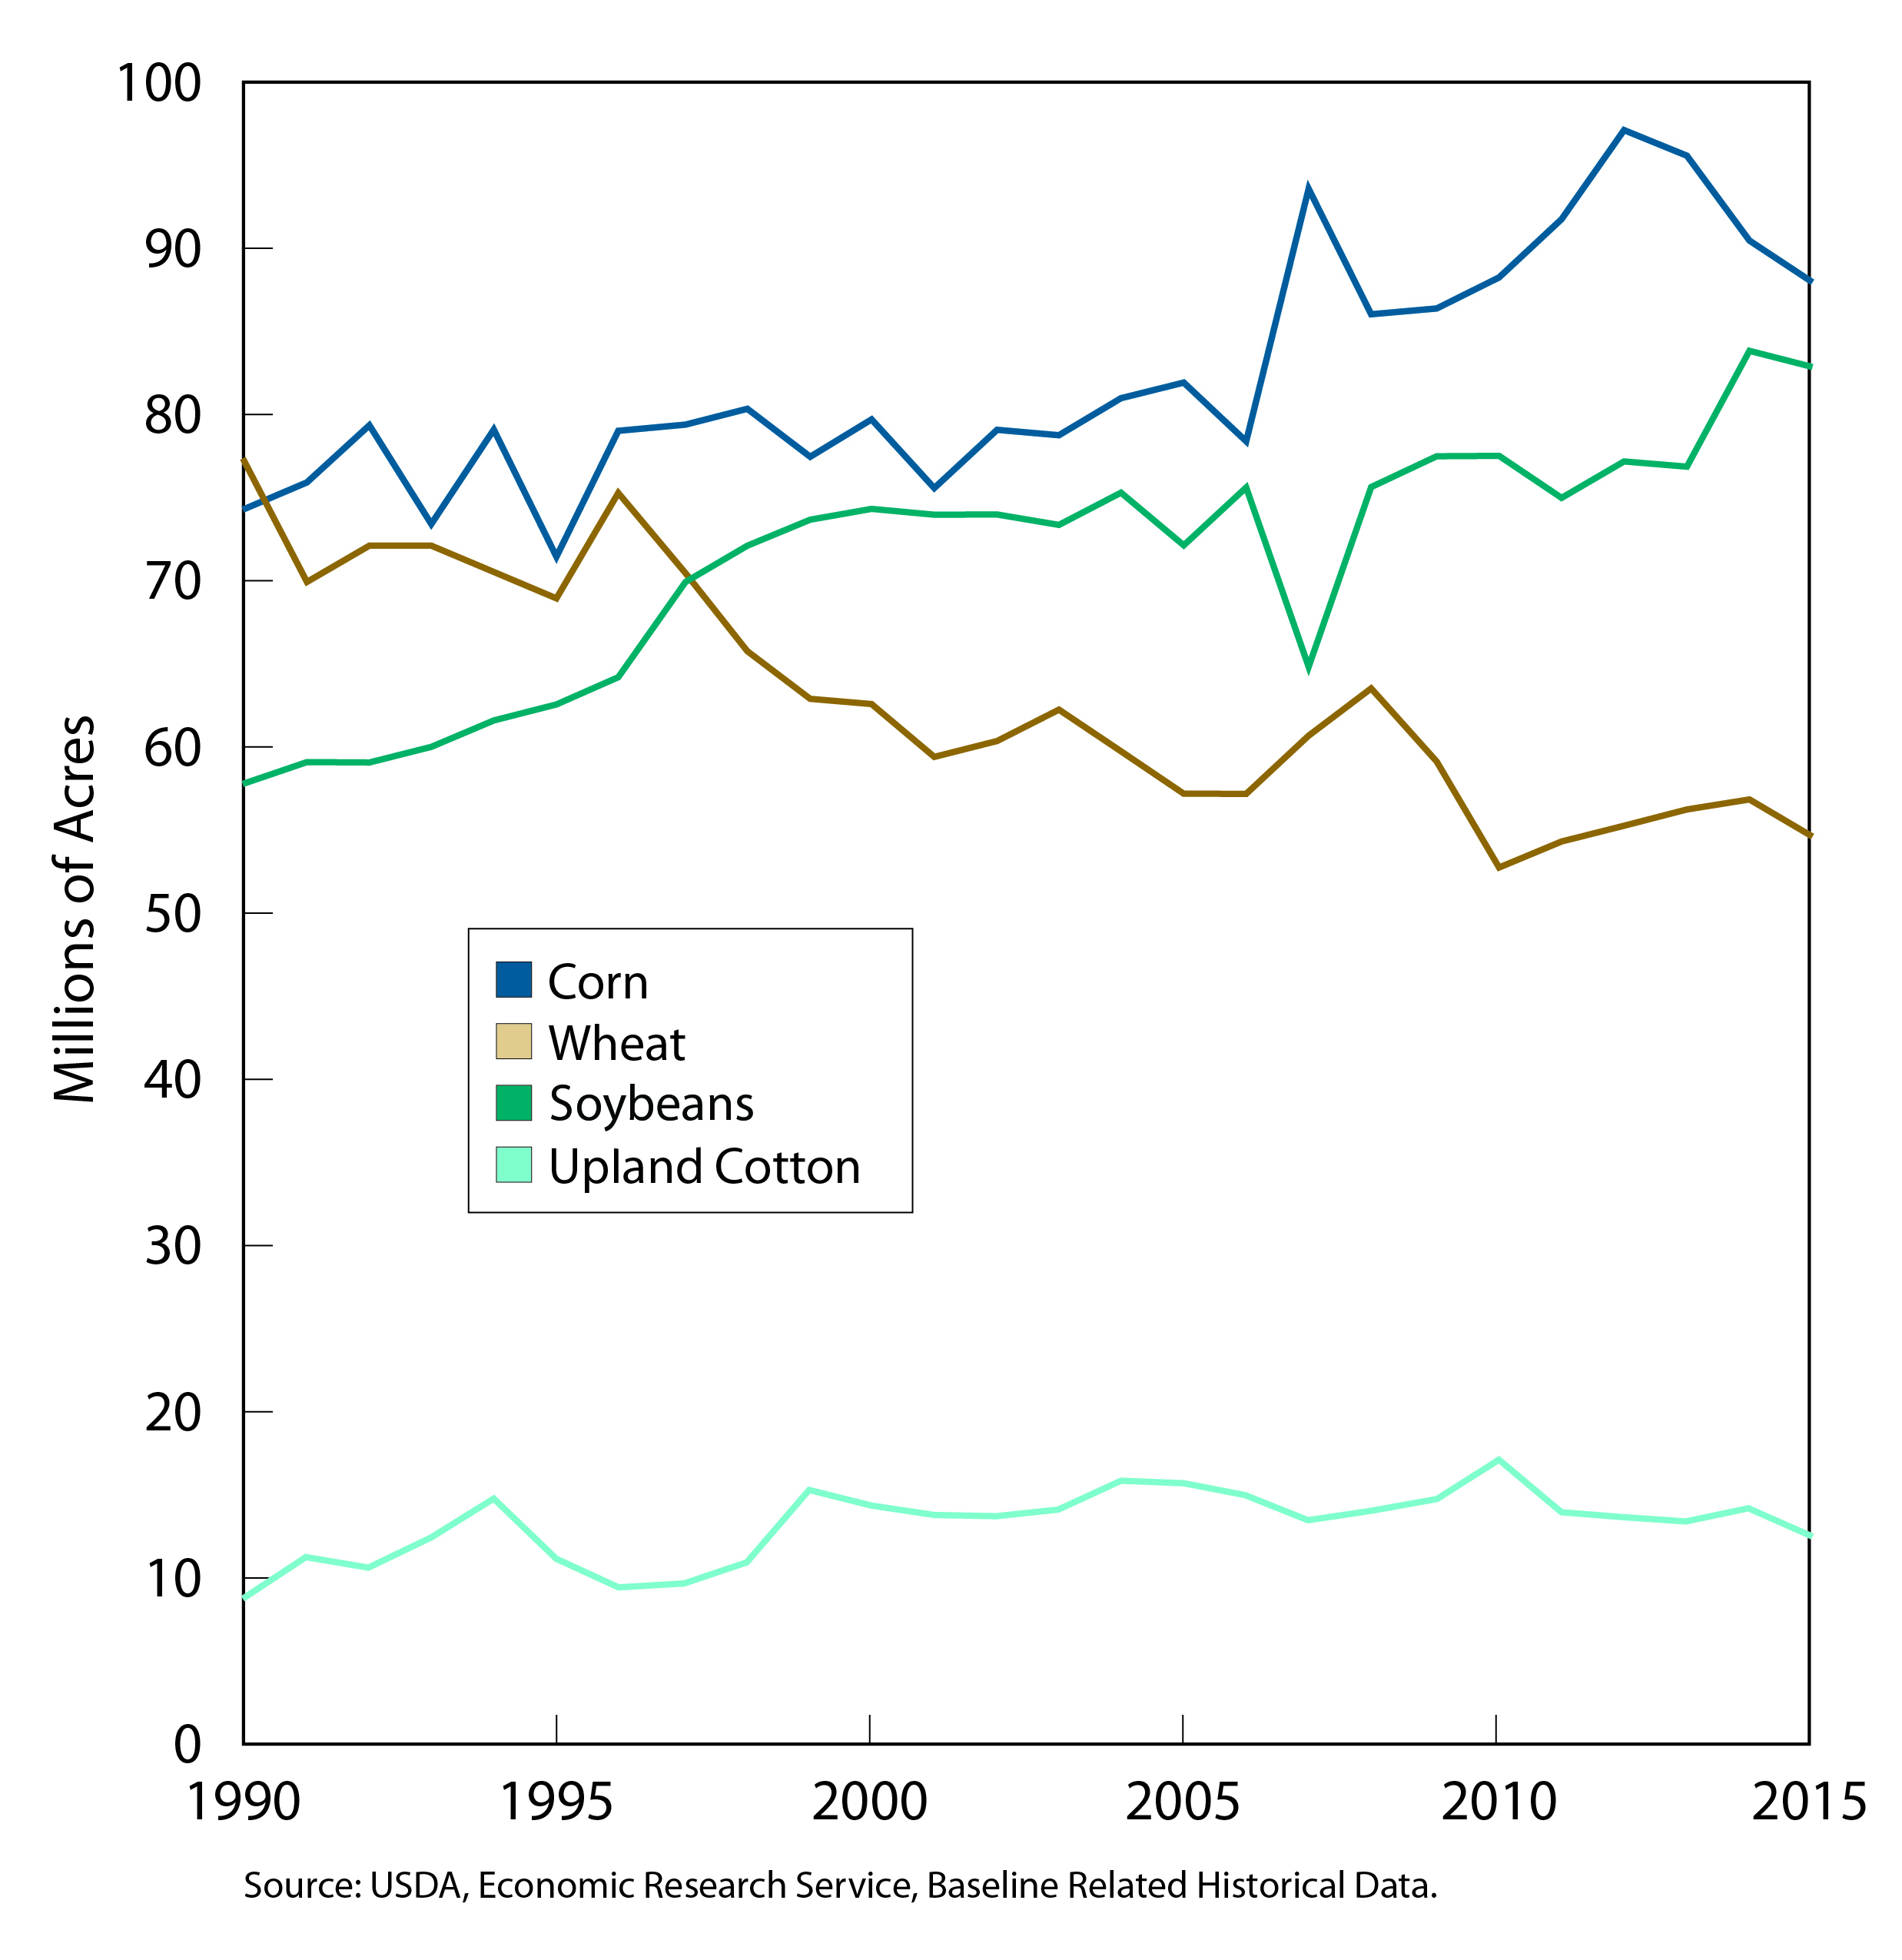
Agricultural land in the United States totaled 408.2 million hectares (ha) in 2014, of which 251 million ha were in permanent meadows and pastures, 152.2 million ha were in arable land, and 2.6 million ha were in permanent crops (FAOSTAT 2016). Compared with the distribution in 2007, these numbers reflect a 4.7 million ha decline in total agricultural lands, driven by declines in arable land and permanent crops but partially offset by a modest increase in permanent meadows and pastures. Although arable lands have been declining, the combined acreage of the four major crops (corn, wheat, soybeans, and cotton) has risen slightly, with increases in land planted in corn and soybeans and decreases in cotton and wheat (see Figure 5.1). Despite the overall slight decline in agricultural land area, the value of U.S. agricultural production rose over the past decade as a result of increased production efficiency and higher prices (USDA 2017a; see also www.ers.usda.gov). Canada has about 65 million ha of agricultural land, of which about 46 million ha are arable, accounting for only about 7% of the country’s total land area (FAOSTAT 2017). Prominent crops on Canada’s arable lands include cereals (e.g., wheat, barley, and maize), oilseeds (e.g., canola and soybeans), and pulses (e.g., peas and lentils). Natural and seeded pastures available for grazing in Canada make up about 20 million ha (Legesse et al., 2016). Agricultural land in Mexico makes up 107 million ha, of which 23 million ha are arable land, 2.7 million ha are permanent crops, and 81 million ha are permanent meadows and pastures (FAOSTAT 2017). Mexico’s major crops are fruits, corn, grains, vegetables, and sugarcane.
A number of social and economic factors drive CO2 and other GHG emissions associated with agriculture (see Table 5.1), including dietary preferences and traditions; domestic and global commodity markets; federal incentives for conservation programs; and technical capabilities for production, processing, and storage in different geographic regions. For example, policies and economic factors that influence bioenergy and biofuel feedstock production systems have diverse direct and indirect impacts on the carbon cycle as discussed later in this chapter and in Ch. 3: Energy Systems. A biofuel’s carbon footprint depends on the feedstock and its associated management as well as the efficiency of the eventual energy produced from the feedstock. Changes in the management of these social and economic factors can affect soil carbon sequestration and storage and agricultural GHG emissions. Another driver of changes in agricultural production systems is consumer demand for types of food (e.g., meat versus dairy versus vegetable) and provenance of food (e.g., grass-fed, organic, and local). Such influences can have both negative and positive effects on the carbon cycle in direct and indirect ways (see Box. 5.1, Food Waste and Carbon). Decision support tools have been developed over the last decade to address agricultural impacts on climate and environmental drivers that play a role in the carbon cycle (for examples, see Ch.18: Carbon Cycle Science in Support of Decision Making).
Emission Source | Canadaa | United Statesb | Mexicoc | Total by Source |
---|---|---|---|---|
Enteric Fermentation | 25 | 166.5 | 43.3 | 234.8 |
Manure Management | 8 | 84.0 | 25.7f | 117.7 |
Agricultural Soil Management | 24d | 295.0 | 0 | 318.0 |
Rice Cultivation | 0 | 12.3 | 0.2 | 12.5 |
Liming, Urea Application, and Others | 3 | 8.7 | 7.5g | 19.2 |
Field Burning of Agricultural Residues | 0 | 0.4 | 1.3 | 1.7 |
Crop Residues | NRe | NR | 1.9 | 1.9 |
Total by Countryh | 60 | 566.9 | 79.9 | 705.8 |
Notes
a Source: ECCC (2018); data for 2016.
b Source: U.S. EPA (2018); data for 2015.
c Source: FAOSTAT (2017); average data for 1990–2014.
d Includes emissions from field burning of agricultural residues.
e Not reported.
f Includes manure applied to soils, manure left on pasture, and manure management.
g Synthetic fertilizer.
h As reported in source; may not match sum of individual emission categories due to rounding.
Agricultural land carbon storage and loss are the net result of multiple fluxes including plant photosynthetic uptake (i.e., atmospheric CO2 capture by plants), ecosystem respiratory loss (i.e., carbon released as CO2 from plants and soil organisms), harvested biomass removal either by grazing or cutting, input from additional feeds, enteric methane (CH4) production by livestock, and the return of manure by grazing animals or addition of manure or other carbon-rich fertilizer amendments to agricultural lands.
The most extensive perennial systems in North America are grasslands, pasture, and hayed lands (see Ch. 10: Grasslands). Other perennial crops (i.e., crops growing and harvested over multiple years) of regional importance include tree crops (mostly fruit and nuts) and vineyards. Because many perennial fruit, nut, and vegetable systems generally are intensively managed, the type of management—such as cover crops and intercropping, irrigation and tillage, fertilizer use, and intensity of cultural activities—largely determines the carbon balance of these production systems. Additionally, biofuel feedstock crops, including perennial grasses and short-rotation woody crops, occupy a very small percentage of agricultural land area, but they have the potential to either sequester carbon or create a carbon debt, depending on the system and land use that the system replaced (e.g., Adler et al., 2007, 2012; Mladenoff et al., 2016). Although differences in net carbon and GHG balance do exist, perennial bioenergy crops generally increase soil carbon in lands converted from annual crops because belowground carbon allocation (to roots) increases once the crops are established, even though the biomass is harvested for energy (Anderson-Teixeira et al., 2013; Valdez et al., 2017). However, managing perennials as biofuel crops often requires additional nitrogenous fertilizer, which can increase nitrous oxide (N2O) emissions and reduce the associated mitigation potential (Johnson and Barbour 2016; see Ch. 3: Energy Systems).
Perennial systems avoid the 4- to 8-month fallow period common among many annual row-crop systems (Drinkwater and Snapp 2007); therefore, perennial plants can use the sun’s energy to drive photosynthesis outside the typical growing season (Baker and Griffis 2005), contributing to increased soil carbon sequestration as compared to annual systems (Sainju et al., 2014). In agricultural systems dominated by perennial plants, photosynthesis generally, but not always, exceeds ecosystem respiration, so on balance these ecosystems remove more CO2 from the atmosphere than they contribute each year (Gilmanov et al., 2010). The total net amount of CO2 exchanged between perennial systems and the atmosphere varies among regions, with net carbon loss occurring most often in drought-prone and desert systems (Liebig et al., 2012). In grazed ecosystems, better management practices, such as prescribed grazing, adaptive multipaddock grazing, improved grass species and introduction of legumes, fertilization, and irrigation, generally will increase soil carbon sequestration (Conant et al., 2001; Teague et al., 2013). Estimates of the potential for U.S. pasture and hayed lands to sequester carbon (with improved management) vary, ranging from near 0 to 3 or more megagrams of carbon (Mg C) per hectare per year, with reasonable mean values of up to about 0.5 Mg C per hectare per year (Conant et al., 2001).
When productivity increases in agricultural systems, land managers frequently remove more aboveground biomass. In some cases, this increase in carbon removal by harvesting offsets the amount of carbon that would otherwise be sequestered, but the main driver of soil carbon sequestration is the production of belowground biomass that is not removed from the field. As a result, increased forage productivity often is associated with increased soil carbon sequestration (Allard et al., 2007; Ammann et al., 2007; Cong et al., 2014; Skinner and Dell 2016) because increased aboveground biomass normally is associated with increased belowground biomass. Initial conditions and ecosystem characteristics influence carbon sequestration potential. Depleted soils likely will accumulate additional carbon, whereas soils in which carbon inputs and outputs are roughly equal will show no change or perhaps a net loss of carbon over time (Smith 2004). Grazed pastures typically sequester more soil carbon than hayed land (Franzluebbers and Stuedemann 2009; Franzluebbers et al., 2000; Senapati et al., 2014) because cutting can cause a greater initial reduction and slower recovery in photosynthetic uptake of carbon than grazing (Skinner and Goslee 2016). Perennial root systems also become active early and remain active late in the growing season and thus can take up and use reactive nitrogen before it is lost from the system. The capture and efficient use of nitrogen (e.g., nitrate and ammonia applied at the correct time and rates) can avoid nitrogen losses. As a result, N2O emissions for perennial systems are typically much lower than those for annual systems (Ma et al., 2000; Qin et al., 2004; Robertson and Vitousek 2009).
As with perennial systems, carbon storage or loss in annually cropped lands is the net result of inputs from unharvested plant residue (especially below ground); root exudation and turnover; organic matter deposition; soil amendments such as manure; and losses from respiration, residue, leaching, soil organic matter mineralization (decomposition), and harvested biomass removal. In turn, these input and output pathways respond to previous and current land use, soil properties (e.g., soil type and depth), climate, and other environmental factors. Typically, annual cropping systems are managed intensively; as such, their associated carbon stocks are closely related to land management choices (e.g., tillage, crop and crop rotation, residue management, fertilizer and nutrient inputs, extent and efficiency of drainage, and irrigation and use of cover crops) and the duration of those practices.
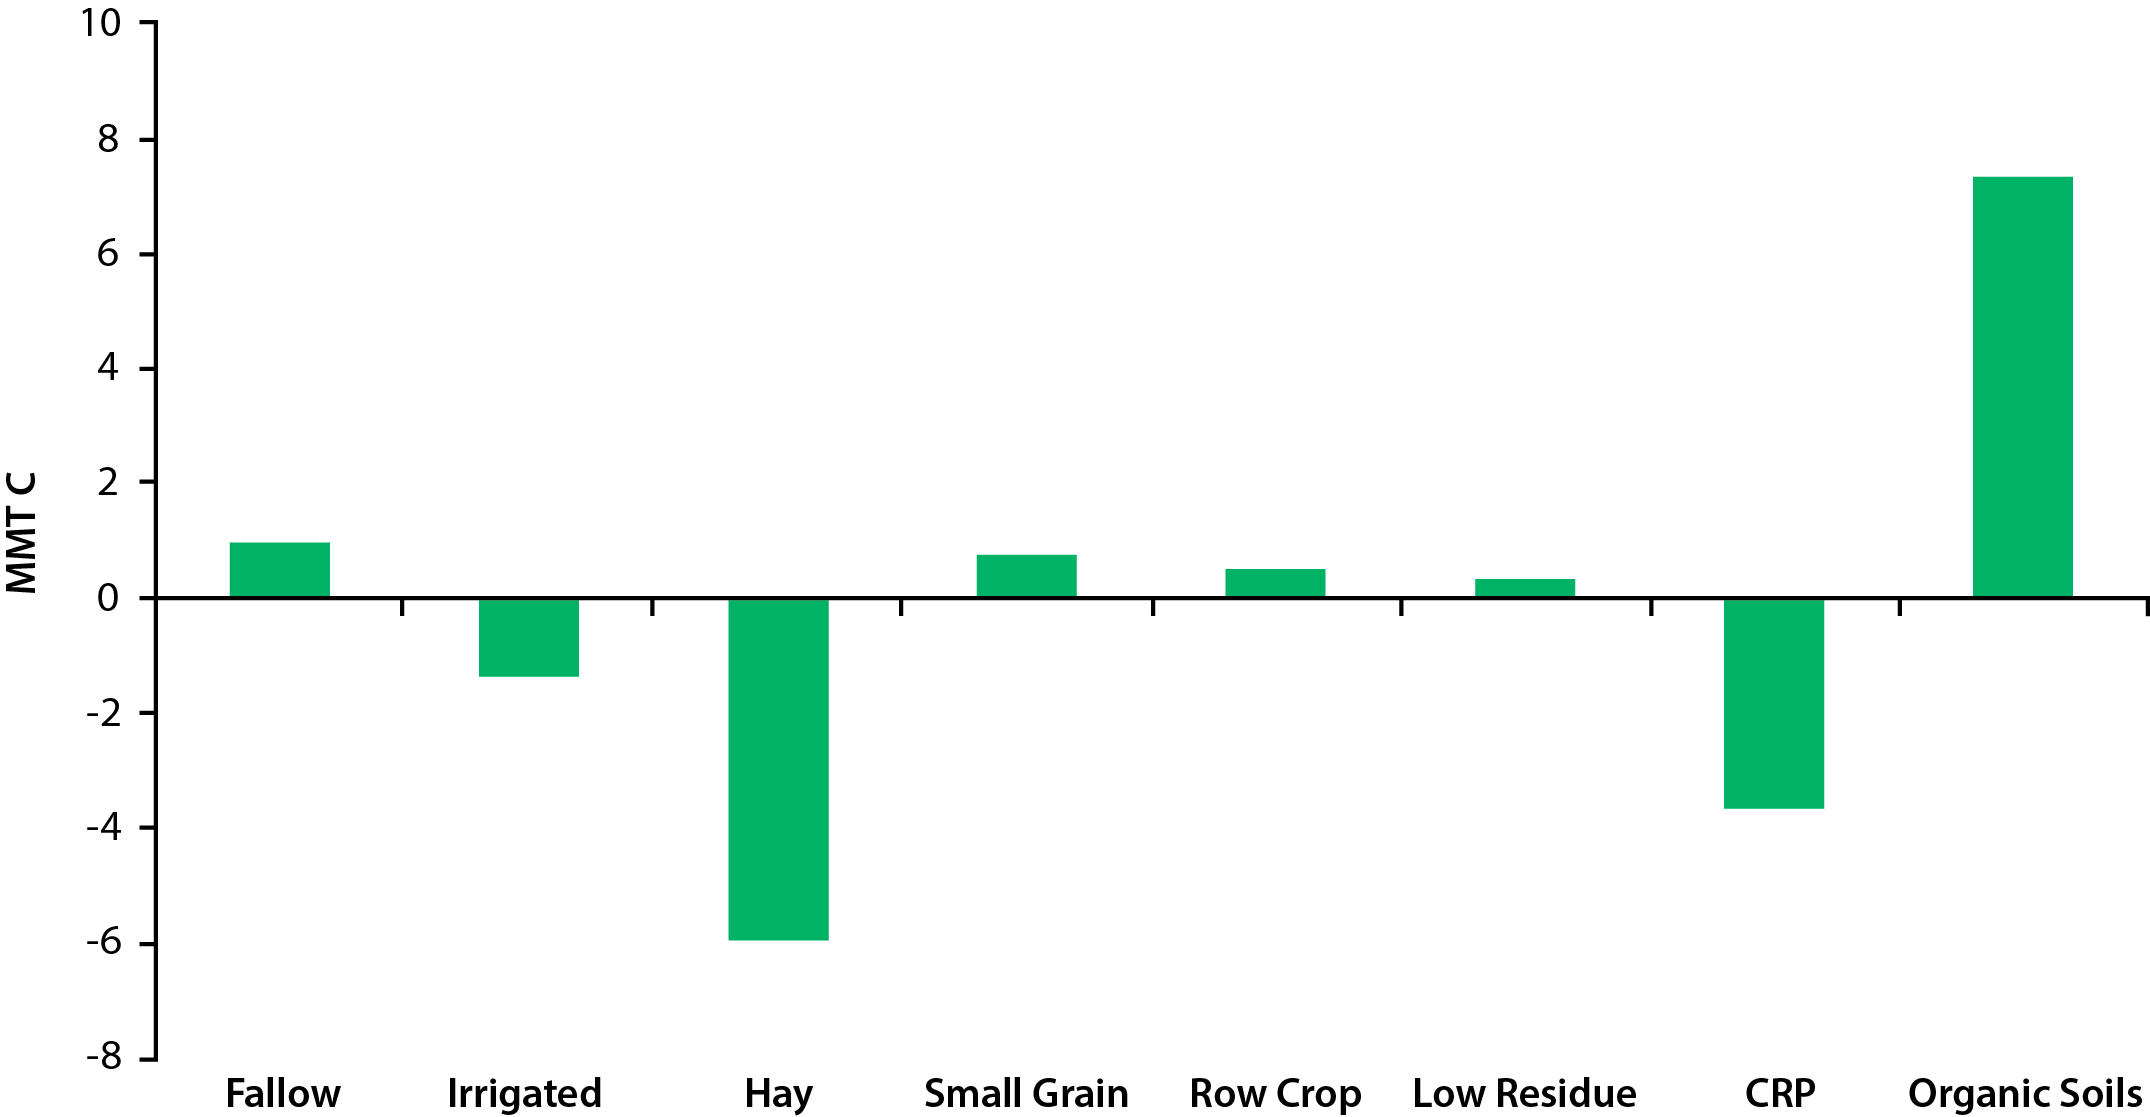
Studies to date suggest that annually cropped mineral soils in the United States sequester a small amount of carbon, but carbon emissions from cropped organic soils and a number of other farm management practices largely offset this benefit (Del Grosso and Baranski 2016; U.S. EPA 2016; see Figure 5.2). Cropped organic soils (e.g., Histosols) comprise only a small portion (<1%) of overall U.S. cropland, but these organic soils can be a large source of atmospheric carbon on a per area basis. This carbon loss occurs because cropped organic soils commonly result from draining wetlands, which greatly enhances decomposition rates in these high-carbon soils that, historically, have been under water and relatively safe from decomposition. Reversion of these drained and cropped organic soils to wetlands or flooded rice production slows the soil carbon losses but also can result in increased CH4 and N2O emissions, implying that water management can play a key role in the net carbon and GHG balances (Bird et al., 2003; Deverel et al., 2016; Oikawa et al., 2017). However, N2O does not necessarily increase with land-use conversion to paddy rice because there is evidence of N2O uptake by recently converted upland crops to flooded rice (Ye and Horwath 2016). Other practices that tend to lead to carbon loss include leaving land fallow without vegetation, growing low-residue crops (e.g., cotton), and plowing intensively (USDA 2014). Conversely, several practices may increase soil carbon stocks, such as including hay and grass in annual crop rotations, growing cover crops, maintaining plant cover, reducing the fallow (vegetation-free) period by increasing cropping intensity especially on marginal land as encouraged by CRP, and possibly reducing tillage intensity (USDA 2014). This increase in soil carbon stocks can vary by ecosystem but is particularly prevalent where these practices are used on soils previously depleted of their original carbon stores.
Compared to perennial crops, annual crop systems tend to have higher nitrogen losses, including N2O emissions. In addition, nitrogen fertilizer additions generally lead to increased CH4 emissions and decreased CH4 oxidation from soils, particularly under anoxic conditions or flooded soil systems such as rice (Liu and Greaver 2009).
The North American livestock sector currently represents a significant source of GHG emissions, generating CO2, CH4, and N2O throughout the production process. Livestock contributions to GHG emissions occur either directly (e.g., from enteric fermentation and manure management) or indirectly (e.g., from feed-production activities and conversion of forest into pasture or feed crops).
Methane and CO2 are natural end-products of microbial fermentation of carbohydrates and, to a lesser extent, amino acids in the rumen of ruminant animals and the hindgut of all farm animals. Methane is produced in strictly anaerobic conditions by highly specialized methanogenic microbes. In ruminants, the vast majority of enteric CH4 production occurs in the rumen (i.e., the largest compartment of the ruminants’ complex stomach); rectal emissions account for about 3% of total enteric CH4 emissions (Hristov et al., 2013b). Methanogenic microbes inhabit the digestive system of many monogastric and nonruminant herbivore animals (Jensen 1996). In these species, CH4 is formed by processes like those occurring in the rumen and is similarly increased by intake of fibrous feeds. Summarizing published data, Jensen (1996) estimated that a 100-kg pig produces about 4.3% of the daily CH4 emissions of a 500-kg cow. Nonruminant herbivore animals such as horses consume primarily fibrous feeds and emit greater amounts of CH4 than nonruminant species that consume primarily nonfibrous diets, but a horse’s CH4 production per unit of body weight is still significantly less than that of ruminants. Wild animals, specifically ruminants (e.g., bison, elk, and deer), also emit CH4 from enteric fermentation in their complex stomachs or the lower gut. The current contribution of wild ruminants to global GHG emissions is relatively low (Hristov 2012).
The U.S. Environmental Protection Agency (EPA) reports that CH4 emissions from enteric fermentation and manure management amounted to about 232.8 teragrams (Tg) per year CO2e (functionally equivalent to 63.5 Tg C) in 2015, with an additional 17.7 Tg per year CO2e (4.8 Tg C) as N2O emitted from manure management (U.S. EPA 2018). Combined, these emissions represented 3.8% of total U.S. GHG emissions. About 97% of the enteric fermentation and 57% of the CH4 emissions from manure management were from beef and dairy cattle; 78% of the N2O emissions from manure management also were attributed to beef and dairy cattle. These estimates are derived from a “bottom-up” approach that begins with estimates of emissions on a per-animal basis and multiplies those estimates over total relevant numbers of animals. “Top-down” approaches, based on measurements of changes in GHG concentrations over large areas and inferences about the sources of those changes, yield different estimates for CH4 emissions. Combining satellite data and modeling, several studies proposed that livestock emissions may range from 40% to 90% greater than EPA estimates (Miller et al., 2013; Wecht et al., 2014). There is more uncertainty in predicting CH4 emissions from manure, partially because these emissions depend heavily on the particular manure handling system and temperature. The sources of discrepancy between the top-down and bottom-up approaches need to be identified to derive accurate estimates for both total and livestock CH4 emissions in North America (NASEM 2018).
There is no disagreement, however, that cattle are a significant source of CH4 emissions. Based on U.S. EPA (2018) estimates, CH4 emissions from cattle make up 25.9% of total U.S. CH4 emissions if only enteric emissions are counted, or 36.2% if emissions from manure management are included. In a national life cycle assessment of fluid milk, 72% of GHG emissions associated with milk production occurred on the farm, with 25% being from enteric CH4 fermentation. The remaining 28% was associated with processing, packaging, distribution, retail, and consumers (Thoma et al., 2013). A similar life cycle assessment of beef indicates that 87% of GHG emissions associated with beef are from cattle production, with only 13% resulting from post-farm processes (Asem-Hiablie et al., 2018). Similar to ruminants, animal production is the main contributor of GHG emissions in the swine industry. A life cycle assessment of the U.S. pork industry (Thoma et al., 2011) reported the following breakdown of emission contributions for each stage of the production cycle: 9.6%, sow barn (including feed and manure management); 52.5%, nursery-to-finish (including feed and manure handling); 6.9%, processing (including 5.6% for processing and 1.3% for packaging); 7.5%, retail (e.g., electricity and refrigerants); and 23.5%, the consumer (e.g., refrigeration, cooking, and CH4 from food waste in landfills). Major sources of GHG emissions in the poultry industry differ depending on the type of production. For broilers (i.e., meat-producing birds), feed production contributes 78% of the emissions; direct on-farm energy use, 8%; post-farm processing and transport of meat, 7%; and manure storage and processing, 6%. For layers (i.e., egg-producing birds), feed production contributes 69% of emissions; direct on-farm energy use, 4%; post-farm processing and transport, 6%; and manure storage and processing, 20% (MacLeod et al., 2013).
Manure can be a major source of GHG emissions, depending on the type of livestock. For ruminants, manure emissions normally are less than those from enteric production, but for nonruminants, manure is the major source of GHG emissions. Microbial activity breaks down organic carbon in manure, releasing both CH4 and CO2, and the amount of each produced is related to oxygen availability. Much of the carbon in manure eventually ends up in the atmosphere in one of these two forms, and because CH4 is a more powerful GHG than CO2, converting this biogenic carbon to CO2 would be beneficial.
Methane emissions from all manure produced and handled in the United States were estimated to be 66.3 Tg CO2e in 2015 (U.S. EPA 2018). These emissions occur in the housing facility, during long-term storage, and during field application (see Table 5.2). The housing facility usually is a relatively small source. Manure lying on a barn floor or open-lot surface is exposed to aerobic conditions where CH4 emissions are low (IPCC 2006; USDA-ARS 2016). Manure deposited by grazing animals also is exposed to aerobic conditions, with CH4 emissions similar to those from a barn floor or open lot. When manure in the housing facility is allowed to accumulate in a bedded pack up to a meter deep, anaerobic conditions develop, leading to greater CH4 emissions (IPCC 2006).
Species | Portion Lost from Each Farm Source (%)a | Total Emissionsb (Teragrams of Carbon Dioxide Equivalent) |
||
---|---|---|---|---|
Housing Facility | Long-Term Storage | Field Application and Grazing | ||
Dairy Cattle | 15 to 20 | 70 to 80 | 5 to 10 | 34.8 |
Swine | 10 to 15 | 80 to 90 | 1 | 24.6 |
Poultry | 45 to 55 | 45 to 55 | 1 | 3.4 |
Beef Cattle | 10 to 15 | 15 to 20 | 60 to 70 | 3.1 |
Horses | 5 | 35 | 60 | 0.2 |
All Other | 5 | 35 | 60 | 0.1 |
Total | 15 to 18 | 70 to 80 | 5 to 10 | 66.3 |
Notes
a Estimated from emissions factors (IPCC 2006) and experience with the Integrated Farm System Model (USDA-ARS 2016)
and assumed common manure management practices for each species.
b From U.S. EPA (2018); 2015 emissions data.
Long-term storage normally is the major source of carbon emissions from manure (see Table 5.2). Liquid or slurry manure typically is stored for 4 to 6 months prior to cropland application. During storage, anaerobic conditions are maintained in which CH4 formation and emission rates are largely controlled by manure temperature (IPCC 2006; USDA-ARS 2016). Longer storage periods will produce greater emissions. Manure solids can float to the surface, particularly in slurry manure, where a crust is formed. This natural crust can reduce storage CH4 emissions by 30% to 40% (IPCC 2006; USDA-ARS 2016). Solid manure may be stored up to several months in a stack with or without active composting. This type of storage maintains more aerobic conditions, which reduce CH4 emissions.
Following storage, manure typically is applied to cropland as a nutrient source for plant growth. During unloading from storage and field application, any CH4 remaining in the manure is released. These emissions are small compared to those from other sources. Following application of the manure spread onto the soil in a thin layer, aerobic conditions suppress further CH4 production. Manure also may be incorporated into the soil so that any CH4 produced is oxidized and consumed (Le Mer and Roger 2001). Thus, optimizing the timing, quantity, and incorporation of manure applications with plant productivity and growth patterns and needs can reduce the associated CH4 and N2O emissions.
The First State of the Carbon Cycle Report (CCSP 2007) showed total agricultural and grazing lands in North America (e.g., cropland, pasture, rangeland, shrub lands, and arid lands) accounting for 17% of global terrestrial carbon stocks. Most of this carbon pool existed within soils; less than 5% resided in cropland vegetation. More recent data estimate that the annual U.S. soil carbon sequestration rate decreased between 1990 and 2013, primarily due to changes in land use and variability in weather patterns. Worth noting are the large interannual fluctuations in the size of the mineral soil CO2 sink (USDA 2016). The major non-CO2 emissions from U.S. agriculture in 2013 were N2O from cropped and grazed soils (44% of U.S N2O emissions) and enteric CH4 from livestock (28% of U.S. CH4 emissions). In 2015, the major non-CO2 emissions from U.S. agriculture were N2O from agricultural soil management (52% of all agricultural emissions, or 4.4% of all U.S. GHG emissions) and enteric CH4 from livestock (29% of agricultural emissions, or 2.5% of all U.S. GHG emissions). Combined with forestry, the agricultural sector contributed to a total net carbon sequestration of 270 Tg CO2e in 2013 (USDA 2016), while total agricultural GHG emissions (excluding land use, land-use change, and forestry activities) amounted to 567 Tg CO2e in 2015 (U.S. EPA 2018).
Agricultural GHG emissions in North America were 706 Tg CO2e in 2014 and 2015 (Table 5.1), including 567 Tg CO2e in the United States (excluding emissions from land use, land-use change, and forestry; U.S. EPA 2018), 59.0 Tg CO2e in Canada, and 79.9 Tg CO2e in Mexico (Table 5.1). Agricultural non-CO2 emissions were primarily N2O from cropped and grazed soils and CH4 from enteric fermentation in livestock. In 2014 and 2015, North America’s major sources and annual rates of GHG emissions (in CO2e) included: agricultural soil management (318.0 Tg), enteric fermentation (234.8 Tg), manure management (117.7 Tg), and rice cultivation (12.5 Tg; Table 5.1). Trends that drive North American GHG emissions from agriculture include changes in five areas: 1) the amount of nitrogen fertilizer applied, which correlates with land area planted in corn, cotton, and wheat (USDA 2016); 2) the number of ruminants, especially beef cattle and dairy cows because they produce large quantities of enteric and manure CH4; 3) trends in human diet choices, which drive changes in land use, numbers of livestock, and volumes of inputs like fertilizer; 4) area of agricultural land opened by clearing forest, which converts large amounts of carbon in plants and soils to CO2; and 5) the amount of food wasted, which leads to CH4 emissions from landfills and also drives additional production with associated GHG emissions (e.g., Hall et al., 2009). Overall, actively managed agricultural lands have a strong capacity to reduce GHG emissions to the atmosphere and take up and store carbon. Varying management options thus could lead to substantial reductions in emitted CO2 and CH4 and sequester significant amounts of carbon.
According to the U.S. 2012 Agricultural Census, 370 million ha were classified as farmland (see Table 5.3). Such lands declined by 3.1 million ha between 2007 and 2012 (USDA-NASS 2012). Out of the converted croplands, 18% changed to nonagricultural uses (e.g., urban growth and transportation); another 3% reverted to forest; and the remaining 79% were used for other types of agricultural land, primarily pastures (USDA-NRCS 2015). The conversion of farmland to other uses appears to have slowed compared with the period from 2002 to 2007, when greater than 9.6 million ha of farmland were converted to other uses (USDA-NASS 2012). In 2012, 19% of the total 786.8 million ha in the contiguous 48 states, Hawaiʻi, Puerto Rico, and the U.S. Virgin Islands was classified as cropland, 1% as CRP, 6% as pastureland, and 21% as rangeland (USDA-NRCS 2015).
Land | Acreage (Million Hectares) | No Till (%)b | Other Conservation Tillage (%) | Cover Crop | Conservation Easement |
---|---|---|---|---|---|
Total Agricultural Lands 2012 | 370.1 | ||||
Croplandc | 157.7 | 24 | 19.67 | 2.41 | 3.38 |
Pastures | 49 | NAd | |||
Rangeland (Includes Federal and Nonfederal Lands) | 246.7 | ||||
Conservation Reserve Program | 1.5 | ||||
Crop | Acreage (Million Hectares) | Percentage of Cropland | Managed Under No Till or Strip Till (%)e | ||
Corn | 38.3 | 24.3 | 31 | ||
Soybeans | 30.8 | 19.5 | 46 | ||
Wheat | 19.8 | 12.6 | 33 | ||
Cotton | 3.8 | 2.4 | 43 | ||
Sorghum | 1.1 | 1.6 | NA | ||
Rice | 1.1 | 0.7 | NA | ||
Hayf | 22.8 | 14.4 | NA |
Notes
a The percentage of no-tilled land does not imply that these lands are managed in a long-term, no-till system.
b Duration of no-till practice is not available; this value does not necessarily reflect a continuous practice.
c USDA-NASS (2012).
d Not applicable.
e Wade et al. (2015).
f USDA-NRCS (2015).
Similar to these trends in North America, global GHG emissions from large ruminants, such as beef and dairy cattle, are about seven times greater than emissions from swine or poultry (Gerber et al., 2012). Dairy production systems, however, are considerably more efficient than beef systems. As an example, Eshel et al. (2014) estimated, using a full life cycle assessment, that GHG emissions per human-edible megacalorie (MCal) were 9.6 kg CO2e for beef versus 2 for pork, 1.71 for poultry, and 1.85 for dairy. Similarly, GHG emissions per kg of human-edible protein were 214 kg CO2e for beef, 42 for pork, 20 for poultry, and 32 for dairy (Eshel et al., 2014).
U.S. cattle inventories have fluctuated during the last several decades from a peak of over 130 million heads (both beef and dairy) in the 1970s to a low of 88.5 million in 2014. Cattle numbers increased to 89 million in 2015 and an estimated 92 million in 2016 (USDA-NASS 2016). According to the 2016 inventory, there were 30.3 million beef cows, 9.3 million dairy cows, 19.8 million heifers weighing 227 kg or more, 16.3 million steers at 227 kg or more, 14 million calves under 227 kg, and 2.1 million bulls. Beef and dairy cows, because of their high feed consumption and higher-fiber diets, are the largest emitters of enteric CH4, producing about 95 and 146 kg CH4 per head per year, respectively; emissions from feedlot cattle fed high-grain diets are considerably less at 43 kg per year per head (U.S. EPA 2018). Increased cattle productivity has resulted in increased feed efficiency and decreased enteric CH4 emission intensity (i.e., CH4 emitted per unit of milk or meat). As an example, the estimated CH4 emission intensity for the U.S. dairy herd has decreased from 31 g per kg milk in 1924 to 14 g per kg in 2015 (Global Research Alliance on Agricultural Greenhouse Gases 2015).
Cattle inventories in Canada have fluctuated annually, but long-term trends are relatively stable—about 12 million heads in January 2016, down slightly from a peak in 2005 (Statistics Canada 2016). Beef cattle account for more than 80% of these animals. In recent decades, improvements in management efficiency have led to a decline in GHG emissions per unit of livestock product. For example, estimated emissions per kilogram of liveweight beef leaving the farm declined from 14 kg CO2e in 1981 to 12 kg CO2e in 2011 (Legesse et al., 2016).
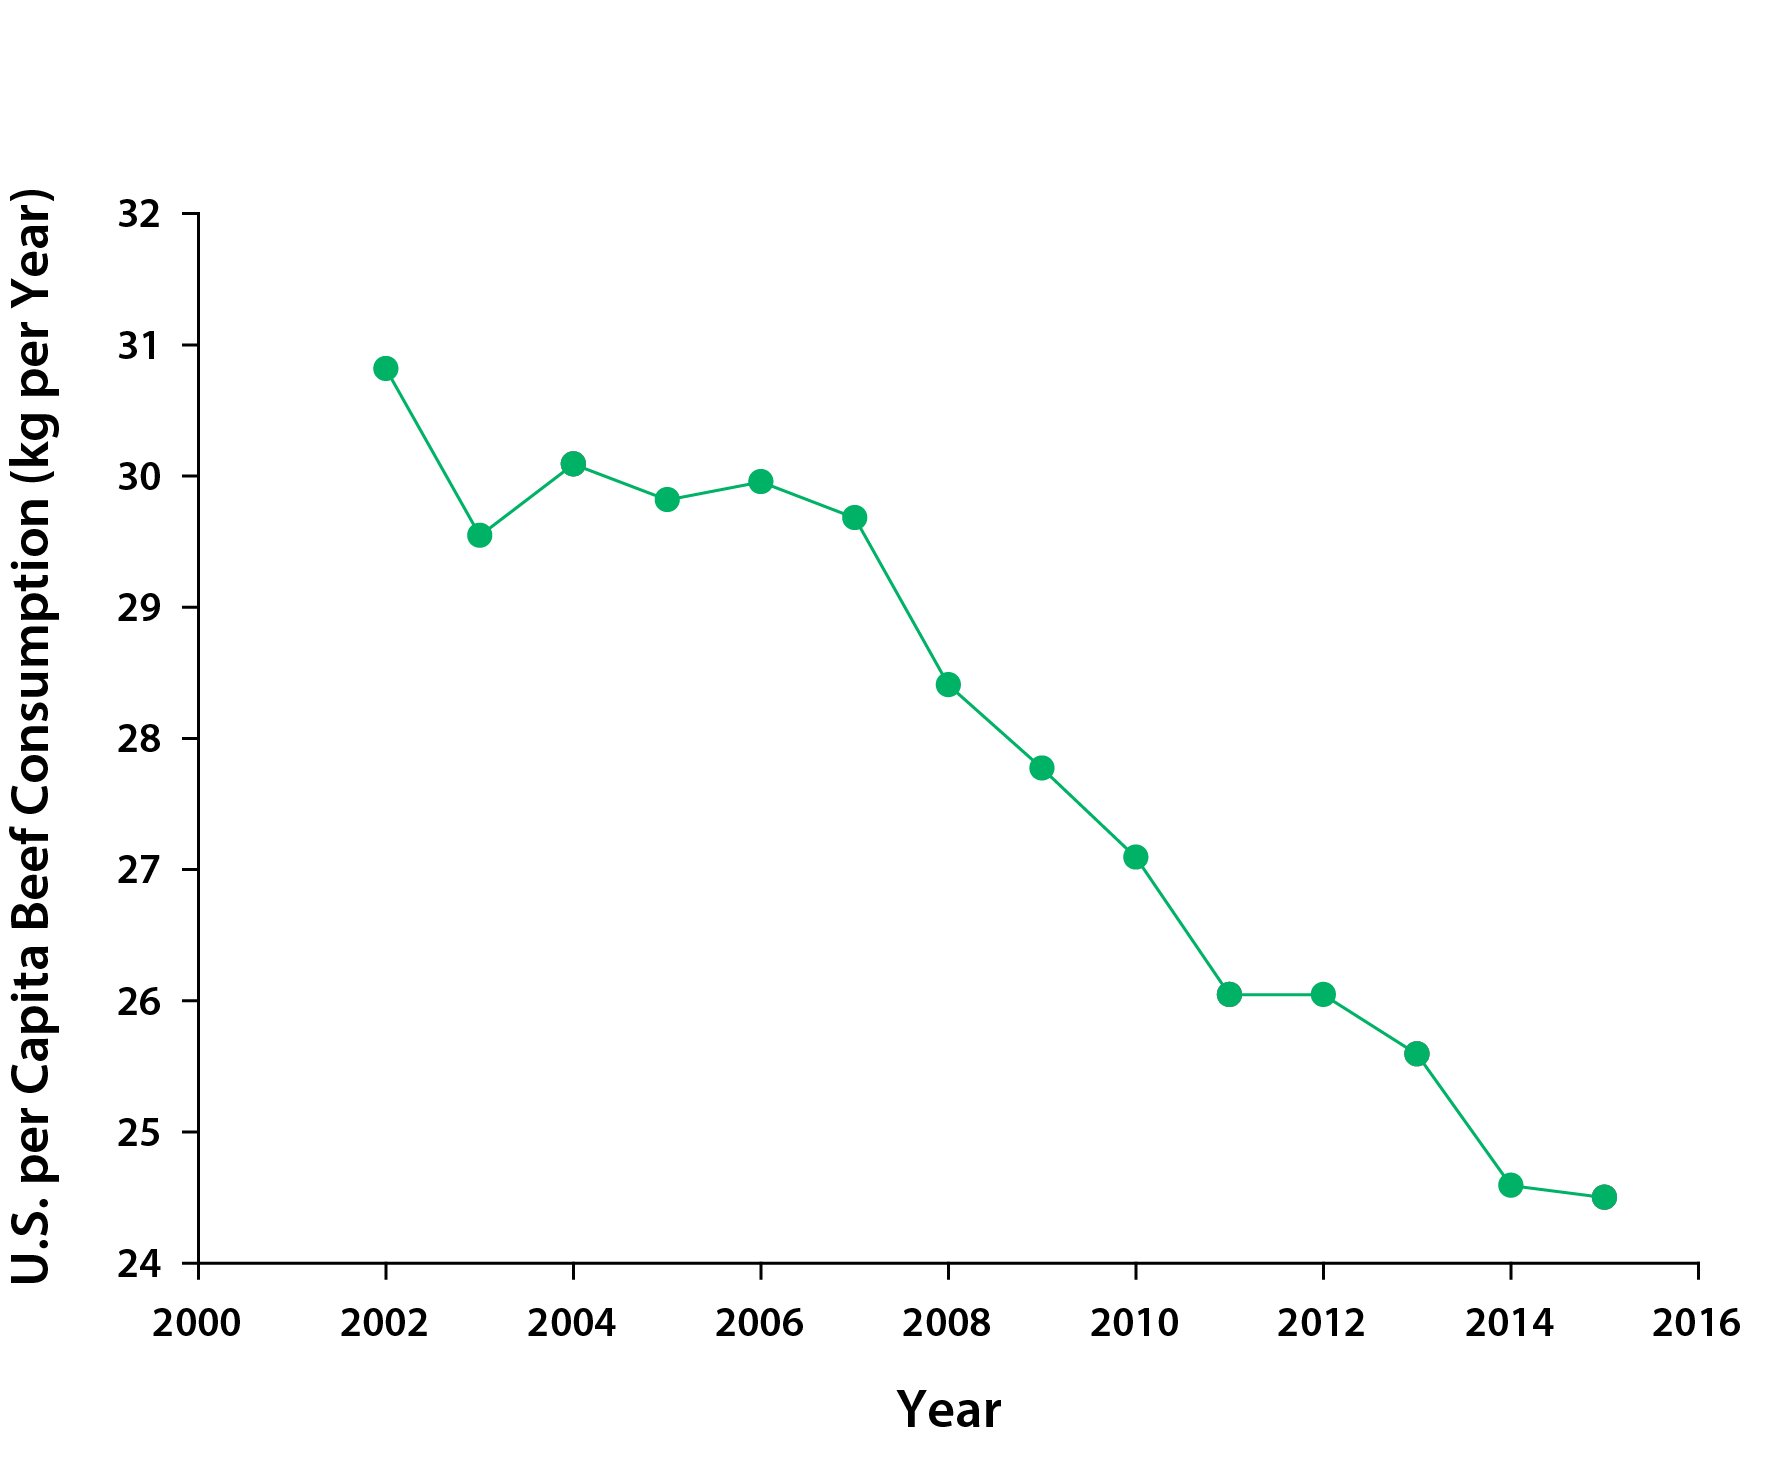
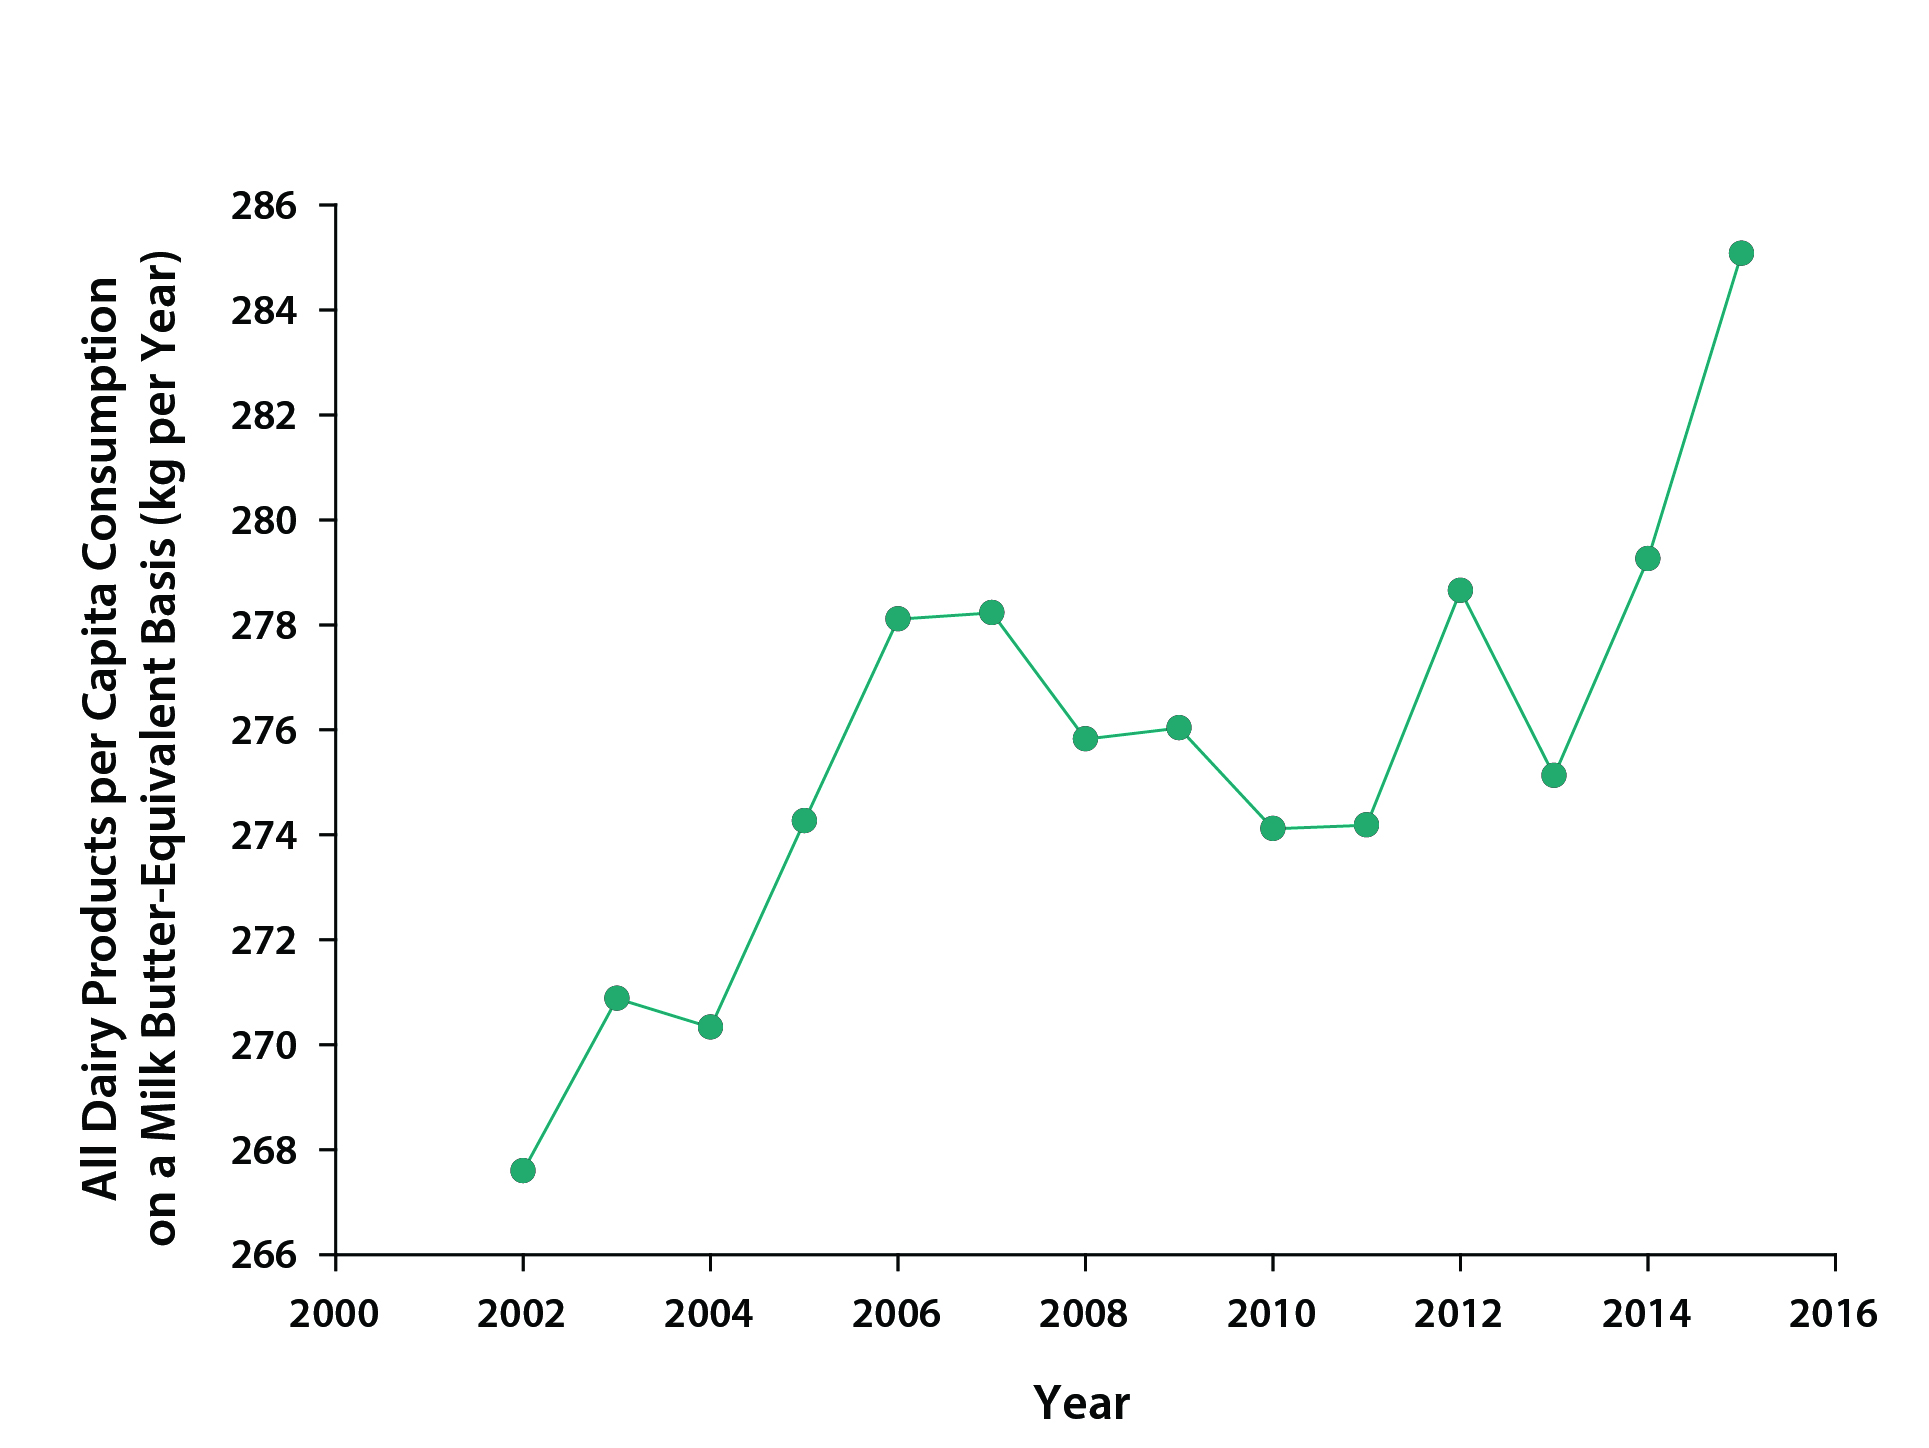
U.S. beef consumption has been declining steadily over the past decade (see Figure 5.3) while consumption of dairy products has been increasing (see Figure 5.4). The previously mentioned life cycle assessment analyses that found greater carbon efficiency of dairy versus beef suggest that this trend should translate to lower emissions from the livestock sector. Most of the beef and veal consumed in the United States was domestically produced (about 86% in 2015; 18.6% of imported beef was from Canada), while about 9.6% of beef produced in the United States in 2015 was exported to other countries. Fluid milk consumption per capita has been decreasing—from about 89 kg per year in 2000 to 71 kg per year in 2015, while consumption of cheese, butter, and yogurt, most of which is domestically produced, has been steadily increasing. As in the United States, per capita consumption of livestock products in Canada also has declined in recent decades. For example, beef and fluid milk consumption decreased from 39 kg of beef per capita in 1980 to 24 kg in 2015 (Agriculture and Agri-Food Canada 2016) and from 90 liters of fluid milk per capita in 1996 to 71 liters in 2015 (Government of Canada 2016).
The strong influence of these carbon-intensive food consumption patterns on the global carbon cycle highlights the challenge of assigning emissions to a particular country. As mentioned previously, 2.5% of beef consumed in the United States is imported from Canada. Most inventories assign these emissions to the country where production occurs, but a main lever that could influence GHG emissions associated with this production rests, in this case, with the United States, because demand is a strong driver of supply and production.
Climate change, including changes in temperature, precipitation, and the frequency of extreme events, could alter the productivity of agricultural systems through its effects on plant and animal growth as well as carbon sequestration and storage by influencing soil respiration and plant allocation to soil carbon. Climate change also could have an indirect effect on enteric CH4 emissions (i.e., from ruminant animals) and directly influence manure and soil-derived CH4 emissions through temperature increases. The effect on enteric emissions is through increased or decreased feed (i.e., dry matter) intake; projected increased ambient temperatures can decrease dry matter intake and thus proportionally reduce enteric CH4 emissions. As an example, the average maximum temperature for the northeastern United States is projected to increase 6.5°C by 2100 (projected by Representative Concentration Pathway 8.5, a high-emissions scenario). This temperature increase is expected to decrease dry matter intake of dairy cows in the region by an additional 0.9 kg per day due to heat stress (Hristov et al., 2017a). This decreased intake will amount to a reduction in daily enteric CH4 emissions of about 17 g per cow. If this reduction is extrapolated over 365 days and 1.4 million cows in the northeastern United States, the increased temperature will lead to a decrease in enteric CH4 emissions from dairy cows of about 8.7 metric tons per year, but the net effect on CO2e per kg of product depends on the effect of temperature on productivity. In contrast, increased temperatures are expected to increase manure CH4 emissions. The microbial decomposition of manure, producing CH4, is sensitive to temperature, so the projected climate changes suggest an increase in emissions of about 4% by midcentury and 8% by 2100 (Rotz et al., 2016).
Climate change effects on soil carbon sequestration will involve a balancing act between the impacts of elevated CO2, higher temperatures, and either increasing or decreasing precipitation depending on the region under consideration. Elevated CO2 and increased precipitation are expected to increase carbon inputs into systems and increase their potential to sequester carbon, whereas higher temperatures are expected to increase ecosystem respiration. Also, yields of major crops (corn, soybeans, wheat, and rice) are predicted to decline as global temperature increases (Zhao et al., 2017). Reduced precipitation or soil moisture along with the drying effects of warming would be expected to decrease plant production and carbon inputs in most upland systems. In unmanaged ecosystems, limited nitrogen availability could constrain the positive effects of elevated CO2 on plant growth (Norby et al., 2010; Thornton et al., 2007), although in managed pasture and hayland systems, fertilization would be expected to overcome such constraints. Tubiello et al. (2007) suggested that the balance between competing pressures would result in greater crop yields in temperate regions compared with those in semiarid and tropical regions. However, several analyses suggest that increased atmospheric CO2 will increase soil CO2 respiration by almost as much as the stimulation of inputs, resulting in little net change in soil carbon pools (Dieleman et al., 2012; Todd-Brown et al., 2014; van Groenigen et al., 2014). Because the potential effects of climate on soil carbon sequestration could be relatively small in most North American agricultural systems, at least compared with the large changes expected in the Arctic (Todd-Brown et al., 2014; see Ch. 11: Arctic and Boreal Carbon), management is projected to have a greater effect on carbon sequestration than will changes in climate (Álvaro-Fuentes and Paustian 2011; Lugato and Berti 2008).
The 2018 EPA inventory (U.S. EPA 2018) attributed 567 Tg CO2e to the agricultural sector for 2015 (excluding emissions related to land use, land-use change, and forestry activities), accounting for 8.5% of total U.S. emissions.1 This proportion reflects a small increase since 1990, primarily due to increased CH4 emissions from manure management. Nitrous oxide emissions from agricultural soil management were the largest sources of GHGs at 295 Tg CO2e, and these emissions, largely due to synthetic nitrogen fertilizer applications, accounted for 77.7% of all U.S. N2O emissions. Other sources primarily included enteric fermentation (166.5 Tg CO2e), manure management (66.3 Tg CO2e and 17.7 Tg CO2e as CH4 and N2O, respectively), rice cultivation (12.3 Tg CO2e), field burning (0.4 Tg CO2e), and CO2 emissions from urea fertilization and liming (4.9 and 3.8 Tg CO2e, respectively). Within the enteric fermentation emissions, beef cattle accounted for 70.9% and dairy cattle 25.6%. Worth noting is that these numbers have been relatively stable since 1990 even though production of beef and dairy products has increased. Agricultural croplands remaining as cropland in the United States (i.e., not converted to or from other land uses) represent a small sink sequestering an estimated 0.1% of the CO2e removed from the atmosphere by land use, land-use change, and forestry activities (U.S. EPA 2018). As noted previously, agricultural practices that remove CO2 from the atmosphere include conversion from cropland to permanent pastures or hay production, reduction in acreage managed with summer fallow, adoption of conservation tillage practices, and increased applications of manure or sewage sludge. Overall, SOC increases in croplands remaining cropland and croplands converted to grasslands collectively offset losses caused by recent conversions of long-term grassland to cropland (U.S. EPA 2015, 2016, 2018; see also Ch. 12: Soils, Section 12.5.1).
In Canada, agricultural soils (55.2 million ha) contain about 4.1 petagrams (Pg) C (0- to 30-cm soil depth) and 5.5 Pg C (0- to 100-cm soil depth), as calculated from the Canadian Soil Information Service National Soil Database and reported in Ch. 12: Soils. As of 2013, Canadian agricultural land removed 11 Tg CO2 per year, which would counter about 2% of the total Canadian national GHG emissions (ECCC 2018). The reduction was attributed to decreased summer fallow and increased adoption of no-till practices in Canadian prairies. However, this value is starting to decline (e.g., down from 13 Tg CO2 in 2005) because changes in SOC stocks and fluxes tend to approach equilibrium at some point after a change in conditions.
Most cropland carbon stocks are in the soil and reflect management history and practices that increase or decrease soil carbon stocks. Integration of practices that can increase soil carbon stocks include 1) maintaining land cover with vegetation (e.g., use of deep-rooted perennials, elimination of summer fallow, and inclusion of cover crops in annual systems); 2) protecting the soil from erosion (e.g., reduced or no tillage and residue cover); and 3) improving nutrient management (Srinivasarao et al., 2015; Swan et al., 2015). The magnitude and longevity of carbon stock changes have strong environmental and regional differences that are subject to subsequent changes in management practices. Conversely, practices that convert lands from perennial systems, such as converting retired or other lands to row crops, consistently show release of stored carbon back to the atmosphere (Gelfand et al., 2011; Huang et al., 2002). Other management practices with the potential to release stored carbon are inadequate return of crop residues (e.g., Blanco-Canqui and Lal 2009), aggressive tillage (Conant et al., 2007), over application of nitrogen fertilizer, and burning of crop residue (Robertson and Grace 2004; Wang et al., 2011).
The timescale for carbon storage in soils is a critical factor for GHG mitigation. Numerous estimates of the rates and potential magnitude of long-term soil carbon accumulation, storage, and sequestration related to management have been reviewed and presented (e.g., Minasny et al., 2017; Paustian et al., 2016; Sperow 2016; Stockmann et al., 2013; Swan et al., 2015). Management practices that increase carbon inputs include planting high-residue crops and returning crop biomass to the soil; minimizing or eliminating summer fallow (particularly bare fallow); adding cover crops to reduce winter fallow; extending and intensifying cropping rotations (e.g., double-cropping or relay cropping and adding forage perennials); retiring marginal lands to perennials; and adding perennials in buffer strips, field borders, filter strips, grassed waterways, vegetative barriers, and herbaceous wind barriers (e.g., Mosier et al., 2006; Paustian et al., 2016; Sainju et al., 2010; Sperow 2016). Swan et al. (2015) estimated carbon storage rates of 0.42 to 0.95 Mg C per hectare per year among conservation practices that shift to perennials (e.g., retiring marginal land or planting perennials as barriers or borders), while inclusion of cover crops was estimated to accrue 0.15 to 0.27 Mg C per hectare per year. Practices that eliminate summer fallow can increase SOC directly by increasing carbon input or modifying microclimate (i.e., temperature and water), a practice that can decrease mineralization rates by reducing temperature and water content (Halvorson et al., 2002; Sainju et al., 2015).
Numerous publications have reported that no-tillage practices store more carbon in soil than those using conventional tillage (e.g., Paustian et al., 2016; Sperow 2016; West and Post 2002). Conversely, others have disputed this claim, especially when including soil carbon measurements deeper than 30 cm (e.g., Baker et al., 2007; Luo et al., 2010; Powlson et al., 2014; Ugarte et al., 2014). No-tillage and other conservation practices were developed to control soil erosion, and this co-benefit is well established. Erosion removes soil carbon from farm fields and relocates that carbon to other parts of the landscape; the amount of this transported carbon that is sequestered in sediments compared to the amount converted to CO2 or CH4 is difficult to estimate (Doetterl et al., 2016). In Ch. 12: Soils, the role of soil erosion is discussed in greater detail and suggests that burial of eroded carbon constitutes a small sink. Comparing SOC sequestration rates from a system managed without tillage to a system with tillage results in negative, neutral, and positive rates of SOC sequestration: 1) 27 ± 19 Mg SOC per hectare per year, (n = 49; Liebig et al., 2005), 2) 0.40 ± 61 Mg SOC per hectare per year (n = 44; Johnson et al., 2005), or 0.45 ± 0.04 Mg SOC per hectare per year (n = 147; Franzluebbers 2010). Likewise, studies using eddy covariance techniques report divergent responses to tillage. For example, Bernacchi et al. (2005) demonstrated that no-tillage agriculture on clay-rich soil built SOC, whereas others (Baker and Griffis 2005; Chi et al., 2016; Verma et al., 2005) used gas exchange techniques to suggest conservation or no-tillage systems were near carbon neutral. In another review, Collins et al. (2012) found that carbon sequestration rates varied from no measurable increase (Staben et al., 1997) to 4 Mg C per hectare per year (Lee et al., 2007), varying with depth monitored, study duration, fertilizer formulation, and location. Several rationales have been postulated for this variability. If sampling depth is shallower than the tillage depth, the apparent change in SOC may be an artifact of sampling depth (Baker et al., 2007) or caused by residue redistribution (Staricka et al., 1991) and vertical stratification of soil carbon (Luo et al., 2010). Meta-analyses by Luo et al. (2010) and Ugarte et al. (2014) suggest that other factors contributing to variability in SOC sequestration include climatic and soil properties interacting with management factors (e.g., cropping frequency, crop rotation diversity, nitrogen, and drainage) along with impacts on rooting depth and above- and belowground biomass, as well as soil heterogeneity and the long time frames required to find a definitive increase or decrease in SOC. Collectively, the evidence indicates that adoption of no tillage may store more carbon, especially in the soil surface, compared to storage with conventional tillage. However, conclusively measuring short-term changes is difficult because of soil heterogeneity and slow rates of change (also discussed in Ch. 12: Soils). In particular, increased N2O or CH4 emissions have been shown to occur for as many as 10 years after no-till adoption (Six et al., 2004), though this effect is greater and more consistent in medium to poorly drained soils (Rochette 2008). Thus, quantifying GHG mitigation by management also must account for changes in N2O and CH4, which can occur coincidently with changes in soil carbon storage (VandenBygaart 2016).
From a carbon emissions perspective, biofuels have received a great deal of attention because of their potential to produce a more carbon neutral liquid fuel relative to fossil fuels. Biofuels from annual crops currently supply about 5% of U.S. energy use, mostly from corn grain ethanol (~36% of the corn grain harvest) and soy biodiesel (~25 % of the soybean harvest; USDA 2017b). Although the potential for reduced GHG emissions with biofuels is compelling, some life cycle assessment analyses suggest that corn grain ethanol has marginally lower (or even greater) GHG emissions compared with those from fossil fuels (e.g., Del Grosso et al., 2014; Fargione et al., 2008). However, more recent studies suggest that currently available technologies can achieve greater GHG reductions of 27% to 43% compared to gasoline when assessed on an energy equivalent basis (Canter et al., 2015; Flugge et al., 2017). Reasons for reduced net GHG intensity for grain- and oil-based biofuels include improved crop-management practices and diminished emissions from land-use change because most of the yield gap from diverting food and feed crops to biofuel feedstocks has been met by increasing per-unit area yields, taking into account the benefits of co-products (e.g., using dried distiller grains for livestock feed) and implementing more efficient feedstock conversion technologies (Flugge et al., 2017). Typically, cellulosic biomass conversion technologies are considered too expensive to compete with liquid fuels derived from other sources (Winchester and Reilly 2015), but innovations at all levels are advancing conversion technology. The impact of cellulosic biofuels on the carbon cycle (Fulton et al., 2015) will depend on ensuring that appropriate mitigation strategies are followed during feedstock choice (perennial or annual) and cultivation (e.g., related to soil carbon stock changes [Blanco-Canqui 2013; Johnson et al., 2012, 2014; Qin et al., 2015]), transportation, and conversion to biofuels (U.S. DOE 2016).
Many common conservation practices improve soil aeration, aggregate stability, and nutrient reserves, while modulating temperature and water and increasing microbial activity and diversity. As a result, soil under some conservation-management regimes can be more resilient to climate variability and more productive (Lal 2015; Lehman et al., 2015). For example, adoption of practices that can conserve soil carbon (e.g., perennial crops, cover crops, and no tillage) may reverse the effects of tillage-intense systems associated with environmental and soil degradation (Mazzoncini et al., 2011). Plant material maintained on the soil surface improves soil physical properties (e.g., Johnson et al., 2016), nutrient availability, and microbial biomass and activity (Feng et al., 2003; Weyers et al., 2013). These improvements result in enhanced soil and water quality and soil productivity (Franzluebbers 2008). Cover crops improve soil health by increasing microbial diversity, biomass, and activity (Bronick and Lal 2005; Lehman et al., 2012, 2015; Schutter and Dick 2002); they also improve soil aggregation, water retention, and nutrient cycling (Blanco-Canqui et al., 2013; Drinkwater et al., 1998; Kladivko et al., 2014; Liebig et al., 2005; Sainju et al., 2006). Thus, there are management practices that simultaneously benefit a number of soil health and carbon storage attributes.
Enteric fermentation and manure management represent 44% of the 2015 agricultural GHG emissions in the United States (U.S. EPA 2018) and 36% and 58% of the agricultural emissions in Canada and Mexico, respectively (FAOSTAT 2017). Of the total U.S. GHG emissions in 2015, however, emissions from enteric fermentation and manure management made up only 3.8% (U.S. EPA 2018). Methane mitigation practices for livestock include practices related to reducing emissions from enteric fermentation (i.e., cattle) and manure management (i.e., cattle and swine) as discussed by Hristov et al. (2013b) and Herrero et al. (2016). Increasing forage digestibility and digestible forage intake generally will reduce CH4 emissions from rumen fermentation (and stored manure) when scaled per unit of animal product. Enteric CH4 emissions may be reduced when corn silage replaces grass silage in the diet. Legume silages also may have an advantage over grass silage because of their lower fiber content and the additional benefit of reducing or replacing inorganic nitrogen fertilizer use. Dietary lipids are effective in reducing enteric CH4 emissions, but the applicability of this practice will depend on its cost and effects on feed intake, production, and milk composition in dairy cows. Inclusion of concentrate feeds in the diet of ruminants likely will decrease enteric CH4 emissions per unit of animal product, particularly when the inclusion is above 40% of dry matter intake.
A number of feed additives, such as nitrates, also can effectively decrease enteric CH4 emissions in ruminants. Because these additives can be toxic to the animals, proper adaptation is critical. However, nitrates may slightly increase N2O emissions, which decreases their overall mitigating effect by 10% to 15% (Petersen et al., 2015). Through their effect on feed efficiency, ionophores are likely to have a moderate CH4-mitigating effect in ruminants fed high-grain or grain-forage diets. Some direct-fed microbial products, such as live yeast or yeast culture, might have a moderate CH4-mitigating effect by increasing animal productivity and feed efficiency, but the effect is expected to be inconsistent. Vaccines against rumen methanogens may offer mitigation opportunities in the future, but the extent of CH4 reduction appears small, and adaptation and persistence of the effect are unknown. A recently discovered enteric CH4 inhibitor, 3-nitrooxypropanol, has shown promising results with both beef and dairy cattle. Under industry-relevant conditions, the inhibitor persistently decreased enteric CH4 emissions by 30% in dairy cows, without negatively affecting animal productivity (Hristov et al., 2015). Similar or even greater mitigation potential has been reported for beef cattle (Romero-Perez et al., 2015). If its effectiveness is proven in long-term studies, this mitigation practice could lead to a substantial reduction of enteric CH4 emissions from the ruminant livestock sector.
Animal management also can have an impact on the intensity (i.e., emissions per unit of animal product) of CH4 emissions from livestock systems. For example, increasing animal productivity through genetic selection for feed efficiency can be an effective strategy for reducing CH4 emission intensity. Other management practices for significantly decreasing total GHG emissions in beef and other meat production systems include reducing age at slaughter of finished cattle and the number of days that animals consume feed in the feedlot. Improved animal health, reduced mortality and morbidity, and improved reproductive performance also can increase herd productivity and reduce GHG emission intensity in livestock production (Hristov et al., 2013a).
Several practices are known to reduce CH4 emissions from manure but cannot be considered in isolation of other GHG sources and pollutants such as N2O and ammonia (NH3). Practices such as the use of solid manure storage and composting can reduce CH4 emissions, but N2O and NH3 emissions will increase, and the end result may not be a reduction in overall GHG emissions. Mitigation of carbon emissions also may have tradeoffs with other pollutants including other gaseous emissions, nutrient leaching to groundwater, and nutrient runoff to surface waters. For example, eliminating long-term manure storage can greatly reduce CH4 emissions, but daily spreading of manure throughout the year can cause greater nutrient runoff. Mitigation strategies must be considered from a whole-farm perspective to ensure a net environmental benefit (Montes et al., 2013).
Potential CH4 mitigation strategies include manure solids separation, aeration, acidification, biofiltration, composting, and anaerobic digestion (Montes et al., 2013). Removal of solids from liquid manure reduces available carbon for methanogenesis, and composting or storing the solids in a stack under more aerobic conditions reduces total CH4 emissions. For long-term manure storage, covers likely will become mandatory to reduce NH3, CH4, and N2O emissions. Semipermeable covers such as the natural crust on slurry manure or added floating materials such as straw, wood chips, expanded clay pellets, and some types of plastic can reduce CH4 and NH3 emissions from storage by 30% to 80%, but they also may increase N2O emissions. Greater reductions and perhaps near elimination of emissions can be achieved by sealing the cover and using a flare to convert the accumulated CH4 to CO2. Anaerobic digesters also can be used to enhance CH4 production, capturing the produced biogas and using it on the farm to heat water and generate electricity. Extracting the carbon from manure reduces storage emissions, and the reduction in purchased gas and electricity provides other off-farm environmental benefits. Composting solid manure in aerated windrows can greatly reduce CH4 emissions, but this processing will increase NH3 and N2O emissions (Montes et al., 2013).
Experimental processes of acidification and biofiltration show potential for reducing CH4 emissions if practical and economical systems can be developed (Montes et al., 2013). Decreasing the pH of manure reduces NH3 and CH4 emissions, but the cost of the acid, safety in handling, and difficulty in maintaining the low pH all deter its use. Biofiltration can extract CH4 from ventilation air in barns, but the large size and cost preclude adoption. Biofilters also may create N2O emissions, offsetting some of the carbon reduction benefits.
Rice emits four to five times more CH4 and N2O to the atmosphere (Linquist et al., 2012) and uses two to three times more water per kg than other cereals (Bouman et al., 2007; Tuong et al., 2005). Sustainably oriented production practices have been developed with the goal of mitigating the environmental impact of rice and improving the economic benefits through reductions in production costs. These practices include the irrigation management practice of alternate wetting and drying (AWD) or intermittent flooding, whereby the soil surface is allowed to dry for several days to a week before rewetting in midseason. This practice can be repeated up to five times during the growing season without reducing harvest yield. The concurrent re-oxygenation of the soil layer keeps CH4 emissions low, and studies have shown that water-saving irrigation methods such as AWD reduce net CH4 emissions produced under water-saturated conditions (Linquist et al., 2015; Rogers et al., 2013). Even one 6-day, midseason drainage event, temporarily reducing anaerobic soil conditions, can reduce post-drainage CH4 emissions by 64% with no evident effect on yield (Sigren et al., 1997). This practice also has the co-benefit of reducing grain arsenic concentrations because it changes the soil reduction-oxidation (redox) potential (Linquist et al., 2015). Other irrigation techniques that reduce the inundated soil period also will reduce the CH4 emissions from rice paddies. These methods include the use of drill-seeding rather than water-seeding or transplanting rice (Pittelkow et al., 2014) and carry the additional benefit of reducing the pumping requirements of irrigation water; thus, they will reduce GHG production associated with the energy use of burning fossil fuels—whether through diesel or indirectly through electricity generation. The reduced pumping benefits are particularly true in rice production regions of the Midsouth that are distinct from those in California, where irrigation needs are met from gravity-fed reservoirs draining the Sierra Nevada mountains. However, for any CH4-reducing rice production regime, care must be taken to keep N2O emissions low. As indicated, rates of N2O emissions are particularly sensitive to inputs from nitrogen fertilization, fallow-season field conditions, and midseason or season-end drainage events (Pittelkow et al., 2013). In many cases, both CH4 and N2O are released in any drainage event, with end-of-season drainage transferring 10% of seasonal CH4 and 27% of seasonal N2O to the atmosphere as entrapped gases are released from the soil.
Between 1960 and 2000, global crop net primary production (NPP) more than doubled, and global cropland area in 2011 was estimated to be 1.3 billion ha (Wolf et al., 2015). Global crop NPP in 2011 was estimated at 5.25 Pg C, of which 2.05 Pg was harvested and respired offsite (Wolf et al., 2015). Global livestock feed intake was 2.42 Pg C, of which 52% was grazed and the rest was either harvested biomass or residue collected from croplands. Global human food intake was 0.57 Pg C in 2011 (Wolf et al., 2015). The global agricultural carbon budget indicates a general increase in NPP, harvested biomass, and movement of carbon among global regions. At the global scale, cereal crops declined and have been replaced primarily with corn, soybean, and oil crops. While total NPP and yield (i.e., biomass per area) have increased in nearly all global regions since 1960, the most pronounced increase has been in southern and eastern Asia where harvested biomass has tripled. Also, cropland NPP in the former Soviet Union significantly declined in 1991, with the level of production recovering around 2010 (Wolf et al., 2015).
Annual crop cultivation and crop burning often is considered carbon neutral (IPCC 2006; U.S. EPA 2018) because biomass is harvested and regrown annually. Although biomass itself is technically carbon neutral, this assumption does not necessarily account for changes in soil carbon that may be associated with production practices, which affect the carbon cycle and net emissions. The impact of non-CO2 emissions is accounted for in the other categories. The increased global uptake of carbon by croplands influences the annual oscillation of global atmospheric carbon (Gray et al., 2014), as more carbon is taken up and released annually than would occur without extensive global cropland production. The cycling of cropland biomass into soils and the cultivation of soils influence how much of the carbon in crop biomass is respired back to the atmosphere versus remaining in the soil, ultimately determining if a cropping system is a net source or sink.
As previously discussed, enteric and manure fermentation are the sources of livestock CH4 emissions. These two sources are affected by different factors and carry different levels of uncertainties. The U.S. EPA estimated 95% confidence interval lower and upper uncertainty bounds for agricultural GHG emissions at –11% and +18% (CH4 emissions from enteric fermentation) and –18% and +20% and –16% and +24% (CH4 and N2O emissions from manure management, respectively; U.S. EPA 2018). Whereas emissions from enteric fermentation are relatively well studied and predictable, there is larger uncertainty regarding manure CH4 emissions and net effects of different intensities and types of grazing (see also Ch. 10: Grasslands). Large datasets have established CH4 emissions from enteric fermentation at 16 to19 g per kg dry matter intake for dairy cows (higher-producing cows have lower emissions per unit of feed intake) to 21 to 22 g per kg dry matter intake for beef cows on pasture (Hristov et al., 2013b). Levels of manure CH4 emissions, however, largely depend on the type of storage facility, duration of storage, and climate (Montes et al., 2013). Emissions from certain dairy manure systems (e.g., flush systems with settling ponds and anaerobic lagoons) can be higher than estimates used by current inventories. So-called top-down approaches have suggested that livestock CH4 emissions are considerably greater than EPA inventories. Miller et al. (2013) and Wecht et al. (2014) proposed that livestock CH4 emissions may be in the range of 12 to 17 Tg per year, which is roughly 30% and 85% greater than EPA’s estimate for 2012 (U.S. EPA 2016). Thus, future research is needed to address these discrepancies and reconcile top-down and bottom-up estimates.
Large uncertainties in GHG emissions from agricultural systems also exist because of their high spatial and temporal variability, measurement methods, cropping systems, management practices, and variations of soil and climatic conditions among regions (Hristov et al., 2017b, 2018). Uncertainty in GHG measurements often exceeds 100% (Parkin and Venterea 2010). Finally, there is considerable uncertainty in soil carbon accumulation and emissions from soils under different conditions and management practices, all of which are complicated by uncertainties about the total amount of land area under different management practices (see Ch. 12: Soils for more information on soil carbon balance).
Whole-farm models representing all major farm components and processes provide useful tools for integrating emission sources to predict farm-scale GHG emissions (Del Prado et al., 2013). By predicting emission processes and their interactions, models can provide a better understanding of production system emissions and be used to explore how different management decisions could affect GHG emissions. This approach has been used to estimate the carbon footprint of common U.S. dairy production systems at around 1 ± 0.1 kg CO2e per kg fat- and protein-corrected milk produced, in which about half of these emissions come from enteric CH4 emissions (Rotz and Thoma 2017). With a similar approach, the carbon footprint of beef cattle production was found to be 18.3 ± 1.7 kg CO2e per kg carcass weight, with about 60% of emissions in the form of enteric and manure management CH4 (Rotz et al., 2015).
Uncertainty exists in any measurement or projection of GHG emissions. The uncertainty of farm-scale projections is related to the uncertainty in projecting emissions from individual sources (Chianese et al., 2009). The IPCC (2006) suggested a ±20% uncertainty in predicting both enteric and manure management CH4 emissions. Through the use of process-based models representing common management strategies for the United States, the uncertainty for predicting enteric emissions may be reduced to ±10%, but uncertainty for manure management likely will remain around ±20% (Chianese et al., 2009). Considering these uncertainties along with those of other agricultural emission sources, total GHG emissions can be determined with an uncertainty of ±10% to ±15%. As process-level models improve, verified with accurate measurements, this uncertainty can be reduced. As with inventories, uncertainties also are great for modeling agricultural carbon fluxes related to soil processes. Improving the modeling of these processes and incorporating them into large-scale carbon flux models will help increase understanding and reduce uncertainties in carbon models for agricultural lands.
Adler, P. R., S. J. Del Grosso, D. Inman, R. E. Jenkins, S. Spatari, and Y. Jhang, 2012: Mitigation opportunities for life-cycle greenhouse gas emissions during feedstock productions across heterogeneous landscapes. In: Managing Agricultural Greenhouse Gases. [A. Liebig, A. J. Franzluebbers, and R. F. Follett (eds.)]. Academic Press, pp. 203-219.
Adler, P. R., S. J. Del Grosso, and W. J. Parton, 2007: Life-cycle assessment of net greenhouse-gas flux for bioenergy cropping systems. Ecological Applications, 17(3), 675-691, doi: 10.1890/05-2018.
Agriculture and Agri-Food Canada, 2016: Per Capita Disappearance: Protein Disappearance of Animal Protein Sources in Canada. [URL]
Allard, V., J. F. Soussana, R. Falcimagne, P. Berbigier, J. M. Bonnefond, E. Ceschia, P. D’hour, C. Hénault, P. Laville, C. Martin, and C. Pinarès-Patino, 2007: The role of grazing management for the net biome productivity and greenhouse gas budget (CO2, N2O and CH4) of semi-natural grassland. Agriculture, Ecosystems and Environment, 121(1-2), 47-58, doi: 10.1016/j.agee.2006.12.004.
Álvaro-Fuentes, J., and K. Paustian, 2011: Potential soil carbon sequestration in a semiarid Mediterranean agroecosystem under climate change: Quantifying management and climate effects. Plant and Soil, 338(1-2), 261-272, doi: 10.1007/s11104-010-0304-7.
Ammann, C., C. R. Flechard, J. Leifeld, A. Neftel, and J. Fuhrer, 2007: The carbon budget of newly established temperate grassland depends on management intensity. Agriculture, Ecosystems and Environment, 121(1-2), 5-20, doi: 10.1016/j.agee.2006.12.002.
Anderson-Teixeira, K. J., M. D. Masters, C. K. Black, M. Zeri, M. Z. Hussain, C. J. Bernacchi, and E. H. DeLucia, 2013: Altered belowground carbon cycling following land-use change to perennial bioenergy crops. Ecosystems, 16(3), 508-520, doi: 10.1007/s10021-012-9628-x.
Asem-Hiablie, S., C. A. Rotz, T. Battagliese, and K. R. StackhouseLawson, 2018: A life cycle assessment of the environmental impacts of a beef system in the United States of America. International Journal of Life Cycle Assessment, doi: 10.1007/s11367-018-1464-6.
Bahadur, K. C. K., I. Haque, A. F. Legwegoh, and E. D. G. Fraser, 2016: Strategies to reduce food loss in the global south. Sustainability, 8(7), 1-13, doi: 10.3390/su8070595.
Baker, J. M., and T. J. Griffis, 2005: Examining strategies to improve the carbon balance of corn/bean agriculture using eddy covariance and mass balance techniques. Agricultural and Forest Meteorology, 128(3-4), 163-177.
Baker, J. M., T. E. Ochsner, R. T. Venterea, and T. J. Griffis, 2007: Tillage and soil carbon sequestration—what do we really know? Agriculture, Ecosystems and Environment, 118(1-4), 1-5, doi: 10.1016/j.agee.2006.05.014.
Bernacchi, C. J., S. E. Hollinger, and T. Meyers, 2005: The conversion of the corn/soybean ecosystem to no-till agriculture may result in a carbon sink. Global Change Biology, 11, 1867-1872, doi: 10.1111/j.1365-2486.2005.01050.x.
Bird, J. A., C. van Kessel, and W. R. Horwath, 2003: Stabilization and 13C-carbon and immobilization of 15N-nitrogen from rice straw in humic fractions. Soil Science Society of America Journal, 67, 806-816, doi: 10.2136/sssaj2003.8060.
Blanco-Canqui, H., 2013: Crop residue removal for bioenergy reduces soil carbon pools: How can we offset carbon losses? Bioenergy Research, 6(1), 358-371, doi: 10.1007/s12155-012-9221-3.
Blanco-Canqui, H., and R. Lal, 2009: Crop residue removal impacts on soil productivity and environmental quality. Critical Reviews in Plant Sciences, 28(3), 139-163, doi: 10.1080/07352680902776507.
Blanco-Canqui, H., J. D. Holman, A. J. Schlegel, J. Tatarko, and T. M. Shaver, 2013: Replacing fallow with cover crops in a semiarid soil: Effects on soil properties. Soil Science Society of America Journal, 77(3), 1026-1034, doi: 10.2136/sssaj2013.01.0006.
Bouman, B. A. M., E. Humphreys, T. P. Tuong, and R. Barker, 2007: Rice and water. In: Advances in Agronomy. [D. L. Sparks (ed.)]. Academic Press, 187-237 pp.
Bronick, C. J., and R. Lal, 2005: Soil structure and management: A review. Geoderma, 124(1-2), 3-22, doi: 10.1016/j.geoderma.2004.03.005.
Canter, C. E., J. B. Dunn, J. Han, Z. Wang, and M. Wang, 2015: Policy implications of allocation methods in the life cycle analysis of integrated corn and corn stover ethanol production. Bioenergy Research, 9(1), 77-87, doi: 10.1007/s12155-015-9664-4.
CCSP, 2007: First State of the Carbon Cycle Report (SOCCR): The North American Carbon Budget and Implications for the Global Carbon Cycle. A Report by the U.S. Climate Change Science Program and the Subcommittee on Global Change Research. [A. W. King, L. Dilling, G. P. Zimmerman, D. M. Fairman, R. A. Houghton, G. Marland, A. Z. Rose, and T. J. Wilbanks (eds.)]. National Oceanic and Atmospheric Administration, National Climatic Data Center, Asheville, NC, USA, 242 pp.
Chambers, A., R. Lal, and K. Paustian, 2016: Soil carbon sequestration potential of U.S. croplands and grasslands: Implementing the 4 per thousand initiative. Journal of Soil and Water Conservation, 71(3), 68A-74A, doi: 10.2489/jswc.71.3.68A.
Chi, J., S. Waldo, S. Pressley, P. O’Keeffe, D. Huggins, C. Stöckle, W. L. Pan, E. Brooks, and B. Lamb, 2016: Assessing carbon and water dynamics of no-till and conventional tillage cropping systems in the inland Pacific Northwest U.S. using the eddy covariance method. Agricultural and Forest Meteorology, 218-219, 37-49, doi: 10.1016/j.agrformet.2015.11.019.
Chianese, D. S., C. A. Rotz, and T. L. Richard, 2009: Simulation of methane emissions from dairy farms to assess greenhouse gas reduction strategies. Transactions of the ASABE, 52(4), 1313-1323, doi: 10.13031/2013.27781.
Collins, H. P., M. M. Mikha, T. T. Brown, J. L. Smith, D. R. Huggins, and U. M. Sainju, 2012: Agricultural management and soil carbon dynamics: Western U.S. croplands. In: Managing Agricultural Greenhouse Gases. [M. A. Liebig, A. J. Franzluebbers, and R. F. Follett (eds.)]. Elsevier, pp. 59-77.
Conant, R. T., K. Paustian, and E. T. Elliott, 2001: Grassland management and conversion into grassland: Effects on soil carbon. Ecological Applications, 11(2), 343-355, doi: 10.1890/1051-0761(2001)011[0343:gmacig]2.0.co;2.
Conant, R. T., M. Easter, K. Paustian, A. Swan, and S. Williams, 2007: Impacts of periodic tillage on soil C stocks: A synthesis. Soil and Tillage Research, 95(1-2), 1-10, doi: 10.1016/j.still.2006.12.006.
Cong, W.-F., J. van Ruijven, L. Mommer, G. B. De Deyn, F. Berendse, E. Hoffland, and S. Lavorel, 2014: Plant species richness promotes soil carbon and nitrogen stocks in grasslands without legumes. Journal of Ecology, 102(5), 1163-1170, doi: 10.1111/1365-2745.12280.
Del Grosso, S. J., and M. Baranski, 2016: USDA agriculture and forestry greenhouse gas inventory. Technical Bulletin. [S. J. Del Grosso and M. Baranski (eds.)]. Office of the Chief Economist U.S. Department of Agriculture, 137 pp.
Del Grosso, S., P. Smith, M. Galdos, A. Hastings, and W. Parton, 2014: Sustainable energy crop production. Current Opinion in Environmental Sustainability, 9-10, 20-25, doi: 10.1016/j.cosust.2014.07.007.
Del Prado, A., P. Crosson, J. E. Olesen, and C. A. Rotz, 2013: Whole-farm models to quantify greenhouse gas emissions and their potential use for linking climate change mitigation and adaptation in temperate grassland ruminant-based farming systems. Animal, 7(Suppl 2), 373-385, doi: 10.1017/S1751731113000748.
Deverel, S. J., T. Ingrum, and D. Leighton, 2016: Present-day oxidative subsidence of organic soils and mitigation in the SacramentoSan Joaquin Delta, California, USA. Hydrogeology Journal, 24, 569-586, doi: 10.1007/s10040-016-1391-1.
Dieleman, W. I., S. Vicca, F. A. Dijkstra, F. Hagedorn, M. J. Hovenden, K. S. Larsen, J. A. Morgan, A. Volder, C. Beier, J. S. Dukes, J. King, S. Leuzinger, S. Linder, Y. Luo, R. Oren, P. De Angelis, D. Tingey, M. R. Hoosbeek, and I. A. Janssens, 2012: Simple additive effects are rare: A quantitative review of plant biomass and soil process responses to combined manipulations of CO2 and temperature. Global Change Biology, 18(9), 2681-2693, doi: 10.1111/j.1365-2486.2012.02745.x.
Doetterl, S., A. A. Berhe, E. Nadeu, Z. Wang, M. Sommer, and P. Fiener, 2016: Erosion, deposition and soil carbon: A review of process-level controls, experimental tools and models to address C cycling in dynamic landscapes. Earth-Science Reviews, 154, 102-122, doi: 10.1016/j.earscirev.2015.12.005.
Drinkwater, L. E., and S. S. Snapp, 2007: Nutrients in agroecosystems: Rethinking the management paradigm. Advances in Agronomy, 92, 163-186, doi: 10.1016/S0065-2113(04)92003-2.
Drinkwater, L. E., P. Wagoner, and M. Sarrantonio, 1998: Legume-based cropping systems have reduced carbon and nitrogen losses. Nature, 396(6708), 262-265, doi: 10.1038/24376.
ECCC, 2017: Canadian Environmental Sustainability Indicators: Greenhouse Gas Emissions. [URL]
ECCC, 2018: National Inventory Report, 1990-2016: Greenhouse Sources and Sinks in Canada. [URL]
Eshel, G., A. Shepon, T. Makov, and R. Milo, 2014: Land, irrigation water, greenhouse gas, and reactive nitrogen burdens of meat, eggs, and dairy production in the United States. Proceedings of the National Academy of Sciences USA, 111(33), 11996-12001, doi: 10.1073/pnas.1402183111.
FAO, 2013: Food Wastage Footprint Impacts on Natural Resources. Vol. 249, Food and Agriculture Organization of the United Nations.
FAO, 2016: The agriculture sectors in the intended nationally determined contributions: Analysis. Environment and Natural Resources Management Working Paper No. 62. [R. Strohmaier, J. Rioux, A. Seggel, A. Meybeck, M. Bernoux, M. Salvatore, J. Miranda, and A. Agostini (eds.)]. [URL]
FAOSTAT, 2016: Food and Agriculture Data. Food and Agricultural Organization of the United Nations. [URL]
FAOSTAT, 2017: Food and Agriculture Data. Food and Agricultural Organization of the United Nations. [URL]
Fargione, J., J. Hill, D. Tilman, S. Polasky, and P. Hawthorne, 2008: Land clearing and the biofuel carbon debt. Science, 319(5867), 1235-1238, doi: 10.1126/science.1152747.
Feng, Y., A. C. Motta, D. W. Reeves, C. H. Burmester, E. van Santen, and J. A. Osborne, 2003: Soil microbial communities under conventional-till and no-till continuous cotton systems. Soil Biology and Biochemistry, 35(12), 1693-1703, doi: 10.1016/j.soilbio.2003.08.016.
Flugge, M., J. Lewandrowski, J. Rosenfeld, C. Boland, T. Hendrickson, K. Jaglo, S. Kolansky, K. Moffroid, M. Riley-Gilbert, and D. Pape, 2017: A Life-Cycle Analysis of the Greenhouse Gas Emissions of Corn-Based Ethanol. Report Prepared By ICF Under USDA Contract No. AG-3142-D-16-0243.
Foley, J. A., N. Ramankutty, K. A. Brauman, E. S. Cassidy, J. S. Gerber, M. Johnston, N. D. Mueller, C. O’Connell, D. K. Ray, P. C. West, C. Balzer, E. M. Bennett, S. R. Carpenter, J. Hill, C. Monfreda, S. Polasky, J. Rockstrom, J. Sheehan, S. Siebert, D. Tilman, and D. P. Zaks, 2011: Solutions for a cultivated planet. Nature, 478(7369), 337-342, doi: 10.1038/nature10452.
Franzluebbers, A. J., 2008: Linking soil and water quality in conservation agricultural systems. Journal of Integrative Biosciences, 29(6), 15-29.
Franzluebbers, A. J., 2010: Achieving soil organic carbon sequestration with conservation agricultural systems in the Southeastern United States. Soil Science Society of America Journal, 74(2), 347, doi: 10.2136/sssaj2009.0079.
Franzluebbers, A. J., and J. A. Stuedemann, 2009: Soil-profile organic carbon and total nitrogen during 12 years of pasture management in the Southern Piedmont USA. Agriculture, Ecosystems and Environment, 129(1-3), 28-36, doi: 10.1016/j.agee.2008.06.013.
Franzluebbers, A. J., J. A. Stuedemann, H. H. Schomberg, and S. R. Wilkinson, 2000: Soil organic C and N pools under long-term pasture management in the Southern Piedmont USA. Soil Biology and Biochemistry, 32(4), 469-478, doi: 10.1016/s0038-0717(99)00176-5.
Fulton, L. M., L. R. Lynd, A. Korner, N. Greene, and L. R. Tonachel, 2015: The need for biofuels as part of a low carbon energy future. Biofuels, Bioproducts and Biorefining, 9(5), 476-483, doi: 10.1002/bbb.1559.
Garnett, T., M. C. Appleby, A. Balmford, I. J. Bateman, T. G. Benton, P. Bloomer, B. Burlingame, M. Dawkins, L. Dolan, D. Fraser, M. Herrero, I. Hoffmann, P. Smith, P. K. Thornton, C. Toulmin, S. J. Vermeulen, and H. C. Godfray, 2013: Agriculture. Sustainable intensification in agriculture: Premises and policies. Science, 341(6141), 33-34, doi: 10.1126/science.1234485.
Gelfand, I., T. Zenone, P. Jasrotia, J. Chen, S. K. Hamilton, and G. P. Robertson, 2011: Carbon debt of Conservation Reserve Program (CRP) grasslands converted to bioenergy production. Proceedings of the National Academy of Sciences USA, 108(33), 13864-13869, doi: 10.1073/pnas.1017277108.
Gerber, P., M. MacLeod, C. Opio, T. Vellinga, A. Falcucci, V. Weiler, G. Tempio, G. Gianni, and K. Dietze, 2012: Greenhouse gas emissions from livestock food chains: A global assessment. Bratislava, EAAP.
Gilmanov, T. G., L. Aires, Z. Barcza, V. S. Baron, L. Belelli, J. Beringer, D. Billesbach, D. Bonal, J. Bradford, E. Ceschia, D. Cook, C. Corradi, A. Frank, D. Gianelle, C. Gimeno, T. Gruenwald, H. Guo, N. Hanan, L. Haszpra, J. Heilman, A. Jacobs, M. B. Jones, D. A. Johnson, G. Kiely, S. Li, V. Magliulo, E. Moors, Z. Nagy, M. Nasyrov, C. Owensby, K. Pinter, C. Pio, M. Reichstein, M. J. Sanz, R. Scott, J. F. Soussana, P. C. Stoy, T. Svejcar, Z. Tuba, and G. Zhou, 2010: Productivity, respiration, and light-response parameters of world grassland and agroecosystems derived from flux-tower measurements. Rangeland Ecology and Management, 63(1), 16-39, doi: 10.2111/rem-d-09-00072.1.
Global Research Alliance on Agricultural Greenhouse Gases, 2015: Reducing the Emissions Intensity of Livestock Production: Case Studies of Success. [URL]
Government of Canada, 2016: Per Capita Consumption of Milk and Cream. [URL]
Grassini, P., and K. G. Cassman, 2012. High-yield maize with large net energy yield and small global warming intensity. Proceedings of the National Academy of Sciences USA, 109: 1074-1079. doi: 10.1073/pnas.1116364109.
Gray, J. M., S. Frolking, E. A. Kort, D. K. Ray, C. J. Kucharik, N. Ramankutty, and M. A. Friedl, 2014: Direct human influence on atmospheric CO2 seasonality from increased cropland productivity. Nature, 515(7527), 398-401, doi: 10.1038/nature13957.
Gunders, D., 2012: Wasted: How America is losing up to 40 percent of its food from farm to fork to landfill. Natural Resources Defense Council. [URL]
Gustavsson, J., C. Cederberg, U. Sonesson, R. V. Otterdijk, and A. Meybeck, 2011: Global Food Losses and Food Waste: Extent, Causes, and Prevention. Food and Agriculture Organization of the United Nations.
Hall, K. D., J. Guo, M. Dore, and C. C. Chow, 2009: The progressive increase of food waste in America and its environmental impact. PLOS One, 4(11), e7940, doi: 10.1371/journal.pone.0007940.
Halvorson, A. D., B. J. Wienhold, and A. L. Black, 2002: Tillage, nitrogen, and cropping system effects on soil carbon sequestration. Soil Science Society of America Journal, 66(3), 906, doi: 10.2136/sssaj2002.9060.
Hatfield, J. L., and C. L. Walthall, 2015: Soil biological fertility: Foundation for the next revolution in agriculture? Communications in Soil Science and Plant Analysis, 46, 753-762, doi: 10.1080/00103624.2015.1005227.
Heller, M. C., and G. A. Keoleian, 2015: Greenhouse gas emission estimates of U.S. dietary choices and food loss. Journal of Industrial Ecology, 19(3), 391-401, doi: 10.1111/jiec.12174.
Herrero, M., B. Henderson, P. Havlík, P. K. Thornton, R. T. Conant, P. Smith, S. Wirsenius, A. N. Hristov, P. Gerber, M. Gill, K. Butterbach-Bahl, H. Valin, T. Garnett, and E. Stehfest, 2016: Greenhouse gas mitigation potentials in the livestock sector. Nature Climate Change, 6(5), 452-461, doi: 10.1038/nclimate2925.
Houghton, R. A., J. E. Hobbie, J. M. Melillo, B. Moore, B. J. Peterson, G. R. Shaver, and G. M. Woodwell, 1983: Changes in the carbon content of terrestrial biota and soils between 1860 and 1980: A net release of CO2 to the atmosphere. Ecological Monographs, 53(3), 235-262, doi: 10.2307/1942531.
Hristov, A. N., E. Kebreab, M. Niu, J. Oh, A. Bannink, A. R. Bayat, T. M. Boland, A. F. Brito, D. P. Casper, L. A. Crompton, J. Dijkstra, P. C. Garnsworthy, N. Haque, A. L. F. Hellwing, P. Huhtanen, M. Kreuzer, B. Kuhla, P. Lund, J. Madsen, C. Martin, P. J. Moate, S. Muetzel, C. Muñoz, N. Peiren, J. M. Powell, C. K. Reynolds, A. Schwarm, K. J. Shingfield, T. M. Storlien, M. R. Weisbjerg, D. R. Yáñez-Ruiz, and Z. Yu, 2018: Symposium review: Uncertainties in enteric methane inventories, measurement techniques, and prediction models. Journal of Dairy Science, 101(7), 6655-6674, doi: 10.3168/jds.2017-13536.
Hristov, A. N., A. T. Degaetano, C. A. Rotz, E. Hoberg, H. Skinner, T. Felix, H. Li, P. Patterson, G. Roth, M. Hall, T. L. Ott, L. Baumgard, W. Staniar, M. Hulet, C. Dell, A. Brito, and D. Hollinger, 2017a: Climate change effects on livestock in the Northeast U.S. and strategies for adaptation. Climatic Change, doi: 10.1007/s10584-017-2023-z.
Hristov, A. N., M. Harper, R. Meinen, R. Day, J. Lopes, T. Ott, A. Venkatesh, and C. A. Randles, 2017b: Discrepancies and uncertainties in bottom-up gridded inventories of livestock methane emissions for the contiguous United States. Environmental Science & Technology, 51(23),13668-13677, doi: 10.1021/acs.est.7b03332.
Hristov, A. N., J. Oh, F. Giallongo, T. W. Frederick, M. T. Harper, H. L. Weeks, A. F. Branco, P. J. Moate, M. H. Deighton, S. R. Williams, M. Kindermann, and S. Duval, 2015: An inhibitor persistently decreased enteric methane emission from dairy cows with no negative effect on milk production. Proceedings of the National Academy of Sciences USA, 112(34), 10663-10668, doi: 10.1073/pnas.1504124112.
Hristov, A. N., T. Ott, J. Tricarico, C. A. Rotz, G. Waghorn, A. Adesogan, J. Dijkstra, F. Montes, J. Oh, E. Kebreab, S. Oosting, P. J. Gerber, B. Henderson, H. Makkar, and J. L. Firkins, 2013a: Mitigation of methane and nitrous oxide emissions from animal operations: III. A review of animal management mitigation options. Journal of Animal Science, 91, 5095-5113, doi: 10.2527/jas.2013-6585.
Hristov, A. N., J. Oh, C. Lee, R. Meinen, F. Montes, T. Ott, J. Firkins, A. Rotz, C. Dell, A. Adesogan, W. Yang, J. Tricarico, E. Kebreab, G. Waghorn, J. Dijkstra, and S. Oosting, 2013b: Mitigation of greenhouse gas emissions in livestock production–A review of technical options for non-CO2 emissions. FAO Animal Production and Health Paper no. 177. [P. J. Gerber, B. Henderson, and H. P. S. Makkar (eds.)].
Hristov, A. N., 2012: Historic, pre-European settlement, and present-day contribution of wild ruminants to enteric methane emissions in the United States. Journal of Animal Science, 90(4), 1371-1375, doi: 10.2527/jas.2011-4539.
Huang, X., E. L. Skidmore, and G. L. Tibke, 2002: Soil quality of two Kansas soils as influenced by the Conservation Reserve Program. Journal of Soil and Water Conservation, 57(6), 344-350.
Huggins, D. R., G. A. Buyanovsky, G. H. Wagner, J. R. Brown, R. G. Darmody, T. R. Peck, G. W. Lesoing, M. B. Vanotti, and L. G. Bundy, 1998: Soil organic C in the tallgrass prairie-derived region of the corn belt: Effects of long-term crop management. Soil and Tillage Research, 47(3-4), 219-234, doi: 10.1016/s0167-1987(98)00108-1.
IPCC, 2006: Agriculture, forestry, and other land use. In: Guidelines for National Greenhouse Gas Inventories. [S. Eggleston, L. Buendia, K. Miwa, T. Ngara, and K. Tanabe (eds.)]. Published for the Intergovernmental Panel on Climate Change by the Institute for Global Environmental Strategies.
Janzen, H. H., C. A. Campbell, R. C. Izaurralde, B. H. Ellert, N. Juma, W. B. McGill, and R. P. Zentner, 1998: Management effects on soil C storage on the Canadian prairies. Soil and Tillage Research, 47(3-4), 181-195, doi: 10.1016/s0167-1987(98)00105-6.
Jensen, B. B., 1996: Methanogenesis in monogastric animals. Environmental Monitoring and Assessment, 42(1-2), 99-112, doi: 10.1007/BF00394044.
Johnson, J. M. F., and N. W. Barbour, 2016: Nitrous oxide emission and soil carbon sequestration from herbaceous perennial biofuel feedstocks. Soil Science Society of America Journal, 80, 1057-1070, doi: 10.2136/sssaj2015.12.0436.
Johnson, J. M. F., J. M. Novak, G. E. Varvel, D. E. Stott, S. L. Osborne, D. L. Karlen, J. A. Lamb, J. Baker, and P. R. Adler, 2014: Crop residue mass needed to maintain soil organic carbon levels: Can it be determined? Bioenergy Research, 7(2), 481-490, doi: 10.1007/s12155-013-9402-8.
Johnson, J. M. F., J. S. Strock, J. E. Tallaksen, and M. Reese, 2016: Corn stover harvest changes soil hydrology and soil aggregation. Soil and Tillage Research, 161, 106-115, doi: 10.1016/j.still.2016.04.004.
Johnson, J. M. F., R. R. Allmaras, and D. C. Reicosky, 2006: Estimating source carbon from crop residues, roots and rhizodeposits using the national grain-yield database. Agronomy Journal, 98, 622-636, doi: 10.2134/agronj2005.0179.
Johnson, J. M. F., S. L. Weyers, D. W. Archer, and N. W. Barbour, 2012: Nitrous oxide, methane emission, and yield-scaled emission from organically and conventionally managed systems. Soil Science Society of America Journal, 76(4), 1347, doi: 10.2136/sssaj2012.0017.
Johnson, J. M. F., Reicosky, R. Allmaras, T. Sauer, R. Venterea, and C. Dell, 2005: Greenhouse gas contributions and mitigation potential of agriculture in the central USA. Soil and Tillage Research, 83(1), 73-94, doi: 10.1016/j.still.2005.02.010.
Kladivko, E. J., T. C. Kaspar, D. B. Jaynes, R. W. Malone, J. Singer, X. K. Morin, and T. Searchinger, 2014: Cover crops in the upper Midwestern United States: Potential adoption and reduction of nitrate leaching in the Mississippi River Basin. Journal of Soil and Water Conservation, 69(4), 279-291, doi: 10.2489/jswc.69.4.279.
Lal, R., 2015: Restoring soil quality to mitigate soil degradation. Sustainability, 7(5), 5875-5895, doi: 10.3390/su7055875.
Le Mer, J., and P. Roger, 2001: Production, oxidation, emission and consumption of methane by soils: A review. European Journal of Soil Biology, 37(1), 25-50, doi: 10.1016/s1164-5563(01)01067-6.
Lee, D. K., V. N. Owens, and J. J. Doolittle, 2007: Switchgrass and soil carbon sequestration response to ammonium nitrate, manure, and harvest frequency on Conservation Reserve Program land. Agronomy Journal, 99(2), 462, doi: 10.2134/agronj2006.0152.
Legesse, G., K. A. Beauchemin, K. H. Ominski, E. J. McGeough, R. Kroebel, D. MacDonald, S. M. Little, and T. A. McAllister, 2016: Greenhouse gas emissions of Canadian beef production in 1981 as compared with 2011. Animal Production Science, 56(3), 153, doi: 10.1071/an15386.
Lehman, R. M., W. I. Taheri, S. L. Osborne, J. S. Buyer, and D. D. Douds, 2012: Fall cover cropping can increase arbuscular mycorrhizae in soils supporting intensive agricultural production. Applied Soil Ecology, 61, 300-304, doi: 10.1016/j.apsoil.2011.11.008.
Lehman, R., C. Cambardella, D. Stott, V. Acosta-Martinez, D. Manter, J. Buyer, J. Maul, J. Smith, H. Collins, J. Halvorson, R. Kremer, J. Lundgren, T. Ducey, V. Jin, and D. Karlen, 2015: Understanding and enhancing soil biological health: The solution for reversing soil degradation. Sustainability, 7(1), 988-1027, doi: 10.3390/su7010988.
Liebig, M. A., X. Dong, J. E. T. McLain, and C. J. Dell, 2012: Greenhouse gas flux from managed grasslands in the U.S. Managing Agricultural Greenhouse Gases: Coordinated Agricultural Research Through GRACEnet to Address our Changing Climate. [M. A. Liebig, A. J. Franzluebbers, and R. F. Follett (eds.)]. Elsevier, pp. 183-202. [URL]
Liebig, M., J. Morgan, J. Reeder, B. Ellert, H. Gollany, and G. Schuman, 2005: Greenhouse gas contributions and mitigation potential of agricultural practices in northwestern USA and Western Canada. Soil and Tillage Research, 83(1), 25-52, doi: 10.1016/j.still.2005.02.008.
Linquist, B. A., M. M. Anders, M. A. Adviento-Borbe, R. L. Chaney, L. L. Nalley, E. F. da Rosa, and C. van Kessel, 2015: Reducing greenhouse gas emissions, water use, and grain arsenic levels in rice systems. Global Change Biology, 21(1), 407-417, doi: 10.1111/gcb.12701.
Linquist, B., K. J. Groenigen, M. A. Adviento-Borbe, C. Pittelkow, and C. Kessel, 2012: An agronomic assessment of greenhouse gas emissions from major cereal crops. Global Change Biology, 18(1), 194-209, doi: 10.1111/j.1365-2486.2011.02502.x.
Liu, L., and T. L. Greaver, 2009: A review of nitrogen enrichment effects on three biogenic GHGs: The CO2 sink may be largely offset by stimulated N2O and CH4 emission. Ecology Letters, 12(10), 1103-1117, doi: 10.1111/j.1461-0248.2009.01351.x.
Lugato, E., and A. Berti, 2008: Potential carbon sequestration in a cultivated soil under different climate change scenarios: A modelling approach for evaluating promising management practices in north-east Italy. Agriculture, Ecosystems and Environment, 128(1-2), 97-103, doi: 10.1016/j.agee.2008.05.005.
Luo, Z., E. Wang, and O. J. Sun, 2010: Can no-tillage stimulate carbon sequestration in agricultural soils? A meta-analysis of paired experiments. Agriculture, Ecosystems and Environment, 139(1-2), 224-231, doi: 10.1016/j.agee.2010.08.006.
Ma, Z., C. W. Wood, and D. I. Bransby, 2000: Impacts of soil management on root characteristics of switchgrass. Biomass and Bioenergy, 18(2), 105-112, doi: 10.1016/s0961-9534(99)00076-8.
MacLeod, M., P. Gerber, A. Mottet, G. Tempio, A. Falcucci, C. Opio, T. Vellinga, B. Henderson, and H. Steinfeld, 2013: Greenhouse Gas Emissions from Pig and Chicken Supply Chains - A Global Life Cycle Assessment. Food and Agriculture Organization of the United Nations. [URL]
Mazzoncini, M., T. B. Sapkota, P. Barberi, D. Antichi, and R. Risaliti, 2011: Long-term effect of tillage, nitrogen fertilization and cover crops on soil organic carbon and total nitrogen content. Soil and Tillage Research, 114(2), 165-174, doi: 10.1016/j.still.2011.05.001.
Miller, S. M., S. C. Wofsy, A. M. Michalak, E. A. Kort, A. E. Andrews, S. C. Biraud, E. J. Dlugokencky, J. Eluszkiewicz, M. L. Fischer, G. Janssens-Maenhout, B. R. Miller, J. B. Miller, S. A. Montzka, T. Nehrkorn, and C. Sweeney, 2013: Anthropogenic emissions of methane in the United States. Proceedings of the National Academy of Sciences USA, 110(50), 20018-20022, doi: 10.1073/pnas.1314392110.
Minasny, B., B. P. Malone, A. B. McBratney, D. A. Angers, D. Arrouays, A. Chambers, V. Chaplot, Z.-S. Chen, K. Cheng, B. S. Das, D. J. Field, A. Gimona, C. B. Hedley, S. Y. Hong, B. Mandal, B. P. Marchant, M. Martin, B. G. McConkey, V. L. Mulder, S. O’Rourke, A. C. Richer-de-Forges, I. Odeh, J. Padarian, K. Paustian, G. Pan, L. Poggio, I. Savin, V. Stolbovoy, U. Stockmann, Y. Sulaeman, C.-C. Tsui, T.-G. Vågen, B. van Wesemael, and L. Winowiecki, 2017: Soil carbon 4 per mille. Geoderma, 292, 59-86, doi: 10.1016/j.geoderma.2017.01.002.
Mladenoff, D. J., R. Sahajpal, C. P. Johnson, and D. E. Rothstein, 2016: Recent land use change to agriculture in the U.S. Lake States: Impacts on cellulosic biomass potential and natural lands. PLOS One, 11(2), e0148566, doi: 10.1371/journal.pone.0148566.
Montes, F., R. Meinen, C. Dell, A. Rotz, A. N. Hristov, J. Oh, G. Waghorn, P. J. Gerber, B. Henderson, H. P. Makkar, and J. Dijkstra, 2013: Mitigation of methane and nitrous oxide emissions from animal operations: II. A review of manure management mitigation options. Journal of Animal Science, 91(11), 5070-5094, doi: 10.2527/jas.2013-6584.
Mosier, A. R., A. D. Halvorson, C. A. Reule, and X. J. Liu, 2006: Net global warming potential and greenhouse gas intensity in irrigated cropping systems in northeastern Colorado. Journal of Environmental Quality, 35(4), 1584-1598, doi: 10.2134/jeq2005.0232.
NASEM, 2018: Improving Characterization of Anthropogenic Methane Emissions in the United States. National Academies of Sciences, Engineering, and Medicine. Washington, D.C. The National Academies Press, 250 pp., doi: 10.17226/24987.
Nelson, R. G., C. M. Hellwinckel, C. C. Brandt, T. O. West, D. G. De La Torre Ugarte, and G. Marland, 2009: Energy use and carbon dioxide emissions from cropland production in the United States, 1990-2004. Journal of Environmental Quality, 38(2), 418-425, doi: 10.2134/jeq2008.0262.
Norby, R. J., J. M. Warren, C. M. Iversen, B. E. Medlyn, and R. E. McMurtrie, 2010: CO2 enhancement of forest productivity constrained by limited nitrogen availability. Proceedings of the National Academy of Sciences USA, 107(45), 19368-19373, doi: 10.1073/pnas.1006463107.
Oikawa, P., C. Sturtevant, S. Knox, J. Verfaillie, Y. W. Huang, and D. Baldocchi, 2017: Revisiting the partitioning of net ecosystem exchange of CO2 into photosynthesis and respiration with simultaneous flux measurements of 13CO2 and CO2, soil respiration and a biophysical model, CANVEG. Agricultural and Forest Meteorology, 234-235, 149-163, doi: 10.1016/j.agrformet.2016.12.016.
Parfitt, J., M. Barthel, and S. Macnaughton, 2010: Food waste within food supply chains: Quantification and potential for change to 2050. Philosophical Transactions of the Royal Society B: Biological Sciences, 365(1554), 3065-3081, doi: 10.1098/rstb.2010.0126.
Parkin, T. B., and R. T. Venterea, 2010: Chamber-based trace gas flux measurements. In: USDA-ARS GRACEnet Project Protocols. [R. F. Follett (ed.)]. pp. 3-1 to 3-39. [URL]
Paustian, K., J. Lehmann, S. Ogle, D. Reay, G. P. Robertson, and P. Smith, 2016: Climate-smart soils. Nature, 532(7597), 49-57, doi: 10.1038/nature17174.
Petersen, S. O., A. L. F. Hellwing, M. Brask, O. Højberg, M. Poulsen, Z. Zhu, K. R. Baral, and P. Lund, 2015: Dietary nitrate for methane mitigation leads to nitrous oxide emissions from dairy cows. Journal of Environmental Quality, 44(4), 1063, doi: 10.2134/jeq2015.02.0107.
Pittelkow, C. M., M. A. Adviento-Borbe, J. E. Hill, J. Six, C. van Kessel, and B. A. Linquist, 2013: Yield-scaled global warming potential of annual nitrous oxide and methane emissions from continuously flooded rice in response to nitrogen input. Agriculture, Ecosystems and Environment, 177, 10-20, doi: 10.1016/j.agee.2013.05.011.
Pittelkow, C. M., X. Q. Liang, B. A. Linquist, K. J. van Groenigen, J. Lee, M. E. Lundy, N. van Gestel, J. Six, R. T. Venterea, and C. van Kessel, 2015: Productivity limits and potentials of the principles of conservation agriculture. Nature, 517, doi: 10.1038/nature13809.
Pittelkow, C. M., Y. Assa, M. Burger, R. G. Mutters, C. A. Greer, L. A. Espino, J. E. Hill, W. R. Horwath, C. van Kessel, and B. A. Linquist, 2014: Nitrogen management and methane emissions in direct-seeded rice systems. Agronomy Journal, 106(3), 968, doi: 10.2134/agronj13.0491.
Porter, S. D., D. S. Reay, P. Higgins, and E. Bomberg, 2016: A half-century of production-phase greenhouse gas emissions from food loss and waste in the global food supply chain. Science of the Total Environment, 571, 721-729, doi: 10.1016/j.scitotenv.2016.07.041.
Powlson, D. S., C. M. Stirling, M. L. Jat, B. G. Gerard, C. A. Palm, P. A. Sanchez, and K. G. Cassman, 2014: Limited potential of no-till agriculture for climate change mitigation. Nature Climate Change, 4(8), 678-683, doi: 10.1038/nclimate2292.
Qin, R., P. Stamp, and W. Richner, 2004: Impact of tillage on root systems of winter wheat. Agronomy Journal, 96(6), 1523, doi: 10.2134/agronj2004.1523.
Qin, Z., C. E. Canter, J. B. Dunn, S. Mueller, H. Kwon, J. Han, M. Wander, and M. Wang, 2015: Incorporating Agriculture Management Practices into the Assessment of Soil Carbon Change and Life-Cycle Greenhouse Gas Emissions of Corn Stover Ethanol Production. Argonne National Laboratory. [URL]
Richards, M., L. Gregersen, V. Kuntze, S. Madsen, M. Oldvig, B. Campbell, and I. Vasileiou, 2015: Agriculture’s Prominence in the INDCs. CCAFS Info Note. CGIAR Climate Change Agriculture and Food Security. [URL]
Robertson, G. P., and P. M. Vitousek, 2009: Nitrogen in agriculture: Balancing the cost of an essential resource. Annual Review of Environment and Resources, 34(1), 97-125, doi: 10.1146/annurev.environ.032108.105046.
Robertson, G. P., and P. R. Grace, 2004: Greenhouse gas fluxes in tropical and temperate agriculture: The need for a full-cost accounting of global warming potentials. Environment, Development and Sustainability, 6(1/2), 51-63, doi: 10.1023/B:ENVI.0000003629.32997.9e.
Rochette, P., 2008: No-till only increases N2O emissions in poorly-aerated soils. Soil and Tillage Research, 101(1-2), 97-100, doi: 10.1016/j.still.2008.07.011.
Rogers, C. W., K. R. Brye, R. J. Norman, E. E. Gbur, J. D. Mattice, T. B. Parkin, and T. L. Roberts, 2013: Methane emissions from drill-seeded, delayed-flood rice production on a silt-loam soil in Arkansas. Journal of Environmental Quality, 42(4), 1059-1069, doi: 10.2134/jeq2012.0502.
Romero-Perez, A., E. K. Okine, S. M. McGinn, L. L. Guan, M. Oba, S. M. Duval, M. Kindermann, and K. A. Beauchemin, 2015: Sustained reduction in methane production from long-term addition of 3-nitrooxypropanol to a beef cattle diet. Journal of Animal Science, 93(4), 1780-1791, doi: 10.2527/jas.2014-8726.
Rotz, C. A., and G. Thoma, 2017: Assessing the carbon footprint of dairy production systems. In: Large Dairy Herd Management. [D. Beede (ed.)]. American Dairy Science Association.
Rotz, C. A., R. H. Skinner, A. M. K. Stoner, and K. Hayhoe, 2016: Evaluating greenhouse gas mitigation and climate change adaptation in dairy production using farm simulation. Transactions of the ASABE, 59(6), 1771-1781, doi: 10.13031/trans.59.11594.
Rotz, C. A., S. Asem-Hiablie, J. Dillon, and H. Bonifacio, 2015: Cradle-to-farm gate environmental footprints of beef cattle production in Kansas, Oklahoma, and Texas. Journal of Animal Science, 93(5), 2509-2519, doi: 10.2527/jas.2014-8809.
Sainju, U. M., B. A. Allen, T. Caesar-TonThat, and A. W. Lenssen, 2015: Dryland soil carbon and nitrogen after thirty years of tillage and cropping sequence combination. Agronomy Journal, 107(5), 1822, doi: 10.2134/agronj15.0106.
Sainju, U. M., B. P. Singh, W. F. Whitehead, and S. Wang, 2006: Carbon supply and storage in tilled and nontilled soils as influenced by cover crops and nitrogen fertilization. Journal of Environmental Quality, 35(4), 1507-1517, doi: 10.2134/jeq2005.0189.
Sainju, U. M., J. D. Jabro, and T. Caesar-TonThat, 2010: Tillage, cropping sequence, and nitrogen fertilization effects on dryland soil carbon dioxide emission and carbon content. Journal of Environmental Quality, 37, 98-106, doi: 10.2134/jeq2006.0392.
Sainju, U. M., W. B. Stevens, and T. Caesar-TonThat, 2014: Soil carbon and crop yields affected by irrigation, tillage, cropping system, and nitrogen fertilization. Soil Science Society of America Journal, 78(3), 936, doi: 10.2136/sssaj2013.12.0514.
Schutter, M. E., and R. P. Dick, 2002: Microbial community profiles and activities among aggregates of winter fallow and cover-cropped soil. Soil Science Society of America Journal, 66(1), 142-153, doi: 10.2136/sssaj2002.0142.
Senapati, N., A. Chabbi, F. Gastal, P. Smith, N. Mascher, B. Loubet, P. Cellier, and C. Naisse, 2014: Net carbon storage measured in a mowed and grazed temperate sown grassland shows potential for carbon sequestration under grazed system. Carbon Management, 5(2), 131-144.
Sigren, L. K., S. T. Lewis, F. M. Fisher, and R. L. Sass, 1997: Effects of field drainage on soil parameters related to methane production and emission from rice paddies. Global Biogeochemical Cycles, 11(2), 151-162, doi: 10.1029/97gb00627.
Six, J., S. M. Ogle, F. Jay breidt, R. T. Conant, A. R. Mosier, and K. Paustian, 2004: The potential to mitigate global warming with no-tillage management is only realized when practised in the long term. Global Change Biology, 10(2), 155-160, doi: 10.1111/j.1529-8817.2003.00730.x.
Skinner, R. H., and C. J. Dell, 2016: Yield and soil carbon sequestration in grazed pastures sown with two or five forage species. Crop Science, 56(4), 2035, doi: 10.2135/cropsci2015.11.0711.
Skinner, R. H., and S. C. Goslee, 2016: Defoliation effects on pasture photosynthesis and respiration. Crop Science, 56(4), 2045, doi: 10.2135/cropsci2015.12.0733.
Slobodian, N., K. Van Rees, and D. Pennock, 2002: Cultivation- induced effects on belowground biomass and organic carbon. Soil Science Society of America Journal, 66(3), 924, doi: 10.2136/sssaj2002.9240.
Smil, V., 2012: Harvesting the Biosphere: What We Have Taken from Nature. The MIT Press, 320 pp.
Smith, P., 2004: Soils as carbon sinks: The global context. Soil Use and Management, 20(2), 212-218, doi: 10.1079/sum2004233.
Sperow, M., 2016: Estimating carbon sequestration potential on U.S. agricultural topsoils. Soil and Tillage Research, 155, 390-400, doi: 10.1016/j.still.2015.09.006.
Srinivasarao, C., R. Lal, S. Kundu, and P. B. Thakur, 2015: Conservation agriculture and soil carbon sequestration. Conservation Agriculture, 479-524, doi: 10.1007/978-3-319-11620-4_19.
Staben, M. L., D. F. Bezdicek, M. F. Fauci, and J. L. Smith, 1997: Assessment of soil quality in Conservation Reserve Program and wheat-fallow soils. Soil Science Society of America Journal, 61(1), 124, doi: 10.2136/sssaj1997.03615995006100010019x.
Staricka, J. A., R. R. Allmaras, and W. W. Nelson, 1991: Spatial variation of crop residue incorporated by tillage. Soil Science Society of America Journal, 55(6), 1668, doi: 10.2136/sssaj1991.03615995005500060028x.
Statistics Canada, 2016: Livestock Estimates, January 1, 2016. [URL]
Stockmann, U., M. A. Adams, J. W. Crawford, D. J. Field, N. Henakaarchchi, M. Jenkins, B. Minasny, A. B. McBratney, V. d. R. d. Courcelles, K. Singh, I. Wheeler, L. Abbott, D. A. Angers, J. Baldock, M. Bird, P. C. Brookes, C. Chenu, J. D. Jastrow, R. Lal, J. Lehmann, A. G. O’Donnell, W. J. Parton, D. Whitehead, and M. Zimmermann, 2013: The knowns, known unknowns and unknowns of sequestration of soil organic carbon. Agriculture, Ecosystems and Environment, 164, 80-99, doi: 10.1016/j.agee.2012.10.001.
Swan, A., S. A. Williams, K. Brown, A. Chambers, J. Creque, J. Wick, and K. Paustian, 2015: COMET-Planner. Carbon and Greenhouse Gas Evaluation for NRCS Conservation Practice Planning. A companion report to www.Comet-planner.com. [URL]
Teague, R., F. Provenza, U. Kreuter, T. Steffens, and M. Barnes, 2013: Multi-paddock grazing on rangelands: Why the perceptual dichotomy between research results and rancher experience? Journal of Environmental Management, 128, 699-717, doi: 10.1016/j.jenvman.2013.05.064.
Thoma, G., J. Frank, C. Maxwell, C. East, and D. Nutter, 2011: National Scan-Level Carbon Footprint Study for Production of U.S. Swine. Minnesota Pork Congress. [URL]
Thoma, G., J. Popp, D. Nutter, D. Shonnard, R. Ulrich, M. Matlock, D. S. Kim, Z. Neiderman, N. Kemper, C. East, and F. Adom, 2013: Greenhouse gas emissions from milk production and consumption in the United States: A cradle-to-grave life cycle assessment circa 2008. International Dairy Journal, 31, S3-S14, doi: 10.1016/j.idairyj.2012.08.013.
Thornton, P. E., J.-F. Lamarque, N. A. Rosenbloom, and N. M. Mahowald, 2007: Influence of carbon-nitrogen cycle coupling on land model response to CO2 fertilization and climate variability. Global Biogeochemical Cycles, 21(GB4018), doi: 10.1029/2006gb002868.
Todd-Brown, K. E. O., J. T. Randerson, F. Hopkins, V. Arora, T. Hajima, C. Jones, E. Shevliakova, J. Tjiputra, E. Volodin, T. Wu, Q. Zhang, and S. D. Allison, 2014: Changes in soil organic carbon storage predicted by Earth system models during the 21st century. Biogeosciences, 11(8), 2341-2356, doi: 10.5194/bg-11-2341-2014.
Tubiello, F. N., J. F. Soussana, and S. M. Howden, 2007: Crop and pasture response to climate change. Proceedings of the National Academy of Sciences USA, 104(50), 19686-19690, doi: 10.1073/pnas.0701728104.
Tuong, T. P., B. A. M. Bouman, and M. Mortimer, 2005: More rice, less water–Integrated approaches for increasing water productivity in irrigated rice-based systems in Asia. Plant Production Science, 8(3), 231-241, doi: 10.1626/pps.8.231.
U.S. DOE, 2016: Billion-Ton Report: Advancing Domestic Resources for a Thriving Bioeconomy, Volume 2: Environmental Sustainability Effects of Select Scenarios from Volume 1. [R. A. Efroymson, M. H. Langholtz, K. E. Johnson, and B. J. Stokes (eds.)]. Oak Ridge National Laboratory, Oak Ridge, TN 642 pp.
U.S. EPA, 2015: Inventory of U.S. Greenhouse Gas Emissions and Sinks: 1990-2013. U.S. Environmental Protection Agency. [URL]
U.S. EPA, 2016: Inventory of U.S. Greenhouse Gas Emissions and Sinks: 1990-2014. U.S. Environmental Protection Agency. [URL]
U.S. EPA, 2018: Inventory of U.S. Greenhouse Gas Emissions and Sinks: 1990-2016. U.S. Environmental Protection Agency. [URL]
Ugarte, C. M., H. Kwon, S. S. Andrews, and M. M. Wander, 2014: A meta-analysis of soil organic matter response to soil management practices: An approach to evaluate conservation indicators. Journal of Soil and Water Conservation, 69(5), 422-430, doi: 10.2489/jswc.69.5.422.
USDA, 2014: Quantifying Greenhouse Gas Fluxes in Agriculture and Forestry: Methods for Entity-Scale Inventory. Technical Bulletin 1939. Office of the Chief Economist, Climate Change Program Office, U.S. Department of Agriculture.
USDA, 2016: USDA Agriculture and Forestry Greenhouse Gas Inventory: 1990-2013. Technical Bulletin 1943. [M. Baranski and S. Del Grosso (eds.)]. Office of the Chief Economist, U.S. Department of Agriculture.
USDA, 2017a: USDA Agricultural Projections to 2026. Long-Term Projections Report OCE-2017-1. Interagency Agricultural Projections Committee, 106 pp. [URL]
USDA, 2017b: World Agricultural Supply Demand Estimates. Office of the Chief Economist, U.S. Department of Agriculture.
USDA-ARS, 2016: Integrated Farm System Model. [URL]
USDA-NASS, 2012: 2012 Census of Agriculture – United States Data. United States Department of Agriculture - National Agriculture Statistic Service, Research and Development Division. [URL]
USDA-NASS, 2016: National Agricultural Statistics Service, Quick Stats 2.0. [URL]
USDA-NRCS, 2015: 2012 National Resources Inventory Summary Report. United States Department of Agriculture National Resources Conservation Service. [URL]
Valdez, Z. P., W. C. Hockaday, C. A. Masiello, M. E. Gallagher, and G. P. Robertson, 2017: Soil carbon and nitrogen responses to nitrogen fertilizer and harvesting rates in switchgrass cropping systems. Bioenergy Research, 10(2), 456-464, doi: 10.1007/s12155-016-9810-7.
van Groenigen, K. J., X. Qi, C. W. Osenberg, Y. Luo, and B. A. Hungate, 2014: Faster decomposition under increased atmospheric CO2 limits soil carbon storage. Science, 344(6183), 508-509, doi: 10.1126/science.1249534.
VandenBygaart, A. J., 2016: The myth that no-till can mitigate global climate change. Agriculture, Ecosystems and Environment, 216, 98-99, doi: 10.1016/j.agee.2015.09.013.
Verma, S. B., A. Dobermann, K. G. Cassman, D. T. Walters, J. M. Knops, T. J. Arkebauer, A. E. Suyker, G. G. Burba, B. Amos, H. Yang, D. Ginting, K. G. Hubbard, A. A. Gitelson, E. A. Walter-Shea, 2005: Annual carbon dioxide exchange in irrigated and rainfed maize-based agroecosystems. Agricultural and Forest Meteorology, 131(1-2), 77-96, doi: 10.1016/j.agrformet.2005.05.003.
Vermeulen, S. J., B. M. Campbell, and J. S. I. Ingram, 2012: Climate change and food systems. Annual Review of Environment and Resources, 37(1), 195-222, doi: 10.1146/annurev-environ-020411-130608.
Wade, T., R. Claassen, and S. Wallander, 2015: Conservation-Practice Adoption Rates Vary Widely by Crop and Region, EIB-147. U.S. Department of Agriculture Economic Research Service.
Wang, W., R. C. Dalal, S. H. Reeves, K. Butterbach-Bahl, and R. Kiese, 2011: Greenhouse gas fluxes from an Australian subtropical cropland under long-term contrasting management regimes. Global Change Biology, 17(10), 3089-3101, doi: 10.1111/j.1365-2486.2011.02458.x.
Wecht, K. J., D. J. Jacob, C. Frankenberg, Z. Jiang, and D. R. Blake, 2014: Mapping of North American methane emissions with high spatial resolution by inversion of SCIAMACHY satellite data. Journal of Geophysical Research: Atmospheres, 119(12), 7741-7756, doi: 10.1002/2014jd021551.
West, T. O., and W. M. Post, 2002: Soil organic carbon sequestration rates by tillage and crop rotation: A global data analysis. Soil Science Society of America Journal, 66, 1930-1946.
Weyers, S. L., J. M. F. Johnson, and D. W. Archer, 2013: Assessment of multiple management systems in the upper midwest. Agronomy Journal, 105(6), 1665-1675, doi: 10.2134/agronj2013.0101.
Winchester, N., and J. M. Reilly, 2015: The feasibility, costs, and environmental implications of large-scale biomass energy. Energy Economics, 51, 188-203, doi: 10.1016/j.eneco.2015.06.016.
Wolf, J., T. O. West, Y. Le Page, G. P. Kyle, X. Zhang, G. J. Collatz, and M. L. Imhoff, 2015: Biogenic carbon fluxes from global agricultural production and consumption. Global Biogeochemical Cycles, 29(10), 1617-1639, doi: 10.1002/2015gb005119.
World Bank, 2016. Agricultural Land. [URL]
Ye, R., and W. R. Horwath, 2016: Nitrous oxide uptake in rewetted wetlands with contrasting soil organic carbon contents. Soil Biology and Biochemistry, 100, 110-117, doi: 10.1016/j.soilbio.2016.06.009.
Zhao, C., B. Liu, S. Piao, X. Wang, D. B. Lobell, Y. Huang, M. Huang, Y. Yao, S. Bassu, P. Ciais, J.-L. Durand, J. Elliott, F. Ewert, I. A. Janssens, T. Li, E. Lin, Q. Liu, P. Martre, C. Müller, S. Peng, J. Peñuelas, A. C. Ruane, D. Wallach, T. Wang, D. Wu, Z. Liu, Y. Zhu, Z. Zhu, and S. Asseng, 2017: Temperature increase reduces global yields of major crops in four independent estimates. Proceedings of the National Academy of Sciences USA, 114, 9326-9331, doi: 10.1073/pnas.1701762114.
4 Estimated 95% confidence interval lower and upper uncertainty bounds for agricultural GHG emissions: –11% and +18% (CH4 emissions from enteric fermentation) and –18% and +20% and –16% and +24% (CH4 and N2O emissions from manure management, respectively; U.S. EPA 2018).↩