North America—including its energy systems, land base, and coastal ocean—was a net source of carbon dioxide to the atmosphere from 2004 to 2013, contributing on average about 1,008 teragrams of carbon (Tg C) annually (±50%) (very high confidence).
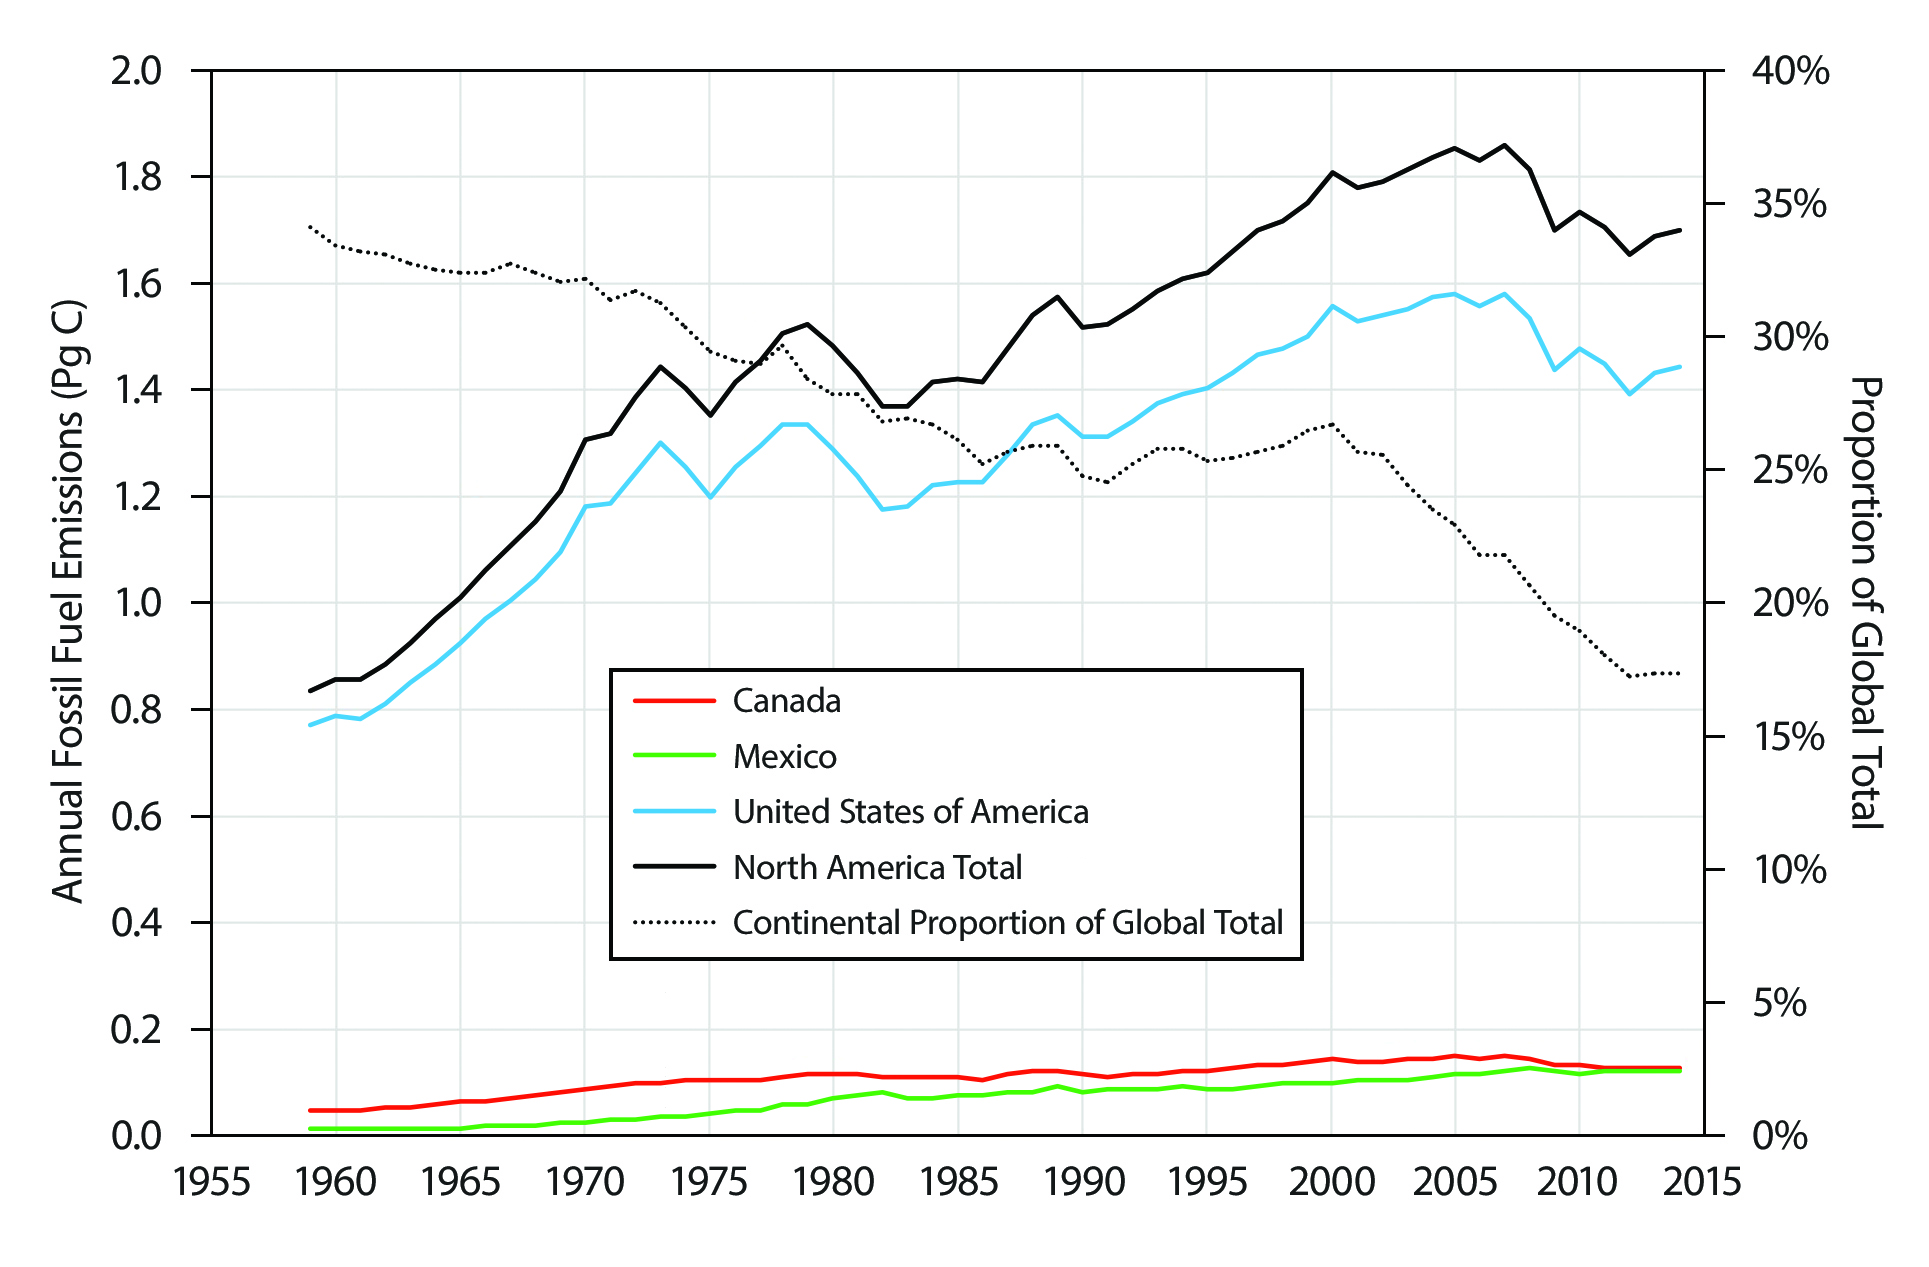
Fossil fuel emissions were the largest carbon source from North America from 2004 to 2013, averaging 1,774 Tg C per year (±5.5%). Emissions during this time showed a decreasing trend of 23 Tg C per year, a notable shift from the increasing trend over the previous decade. The continental proportion of the global total fossil fuel emissions decreased from 24% in 2004 to 17% in 2013 (very high confidence)>.
Approximately 43% of the continent’s total fossil fuel emissions from 2004 to 2013 were offset by natural carbon sinks on North American land and the adjacent coastal ocean (medium confidence).
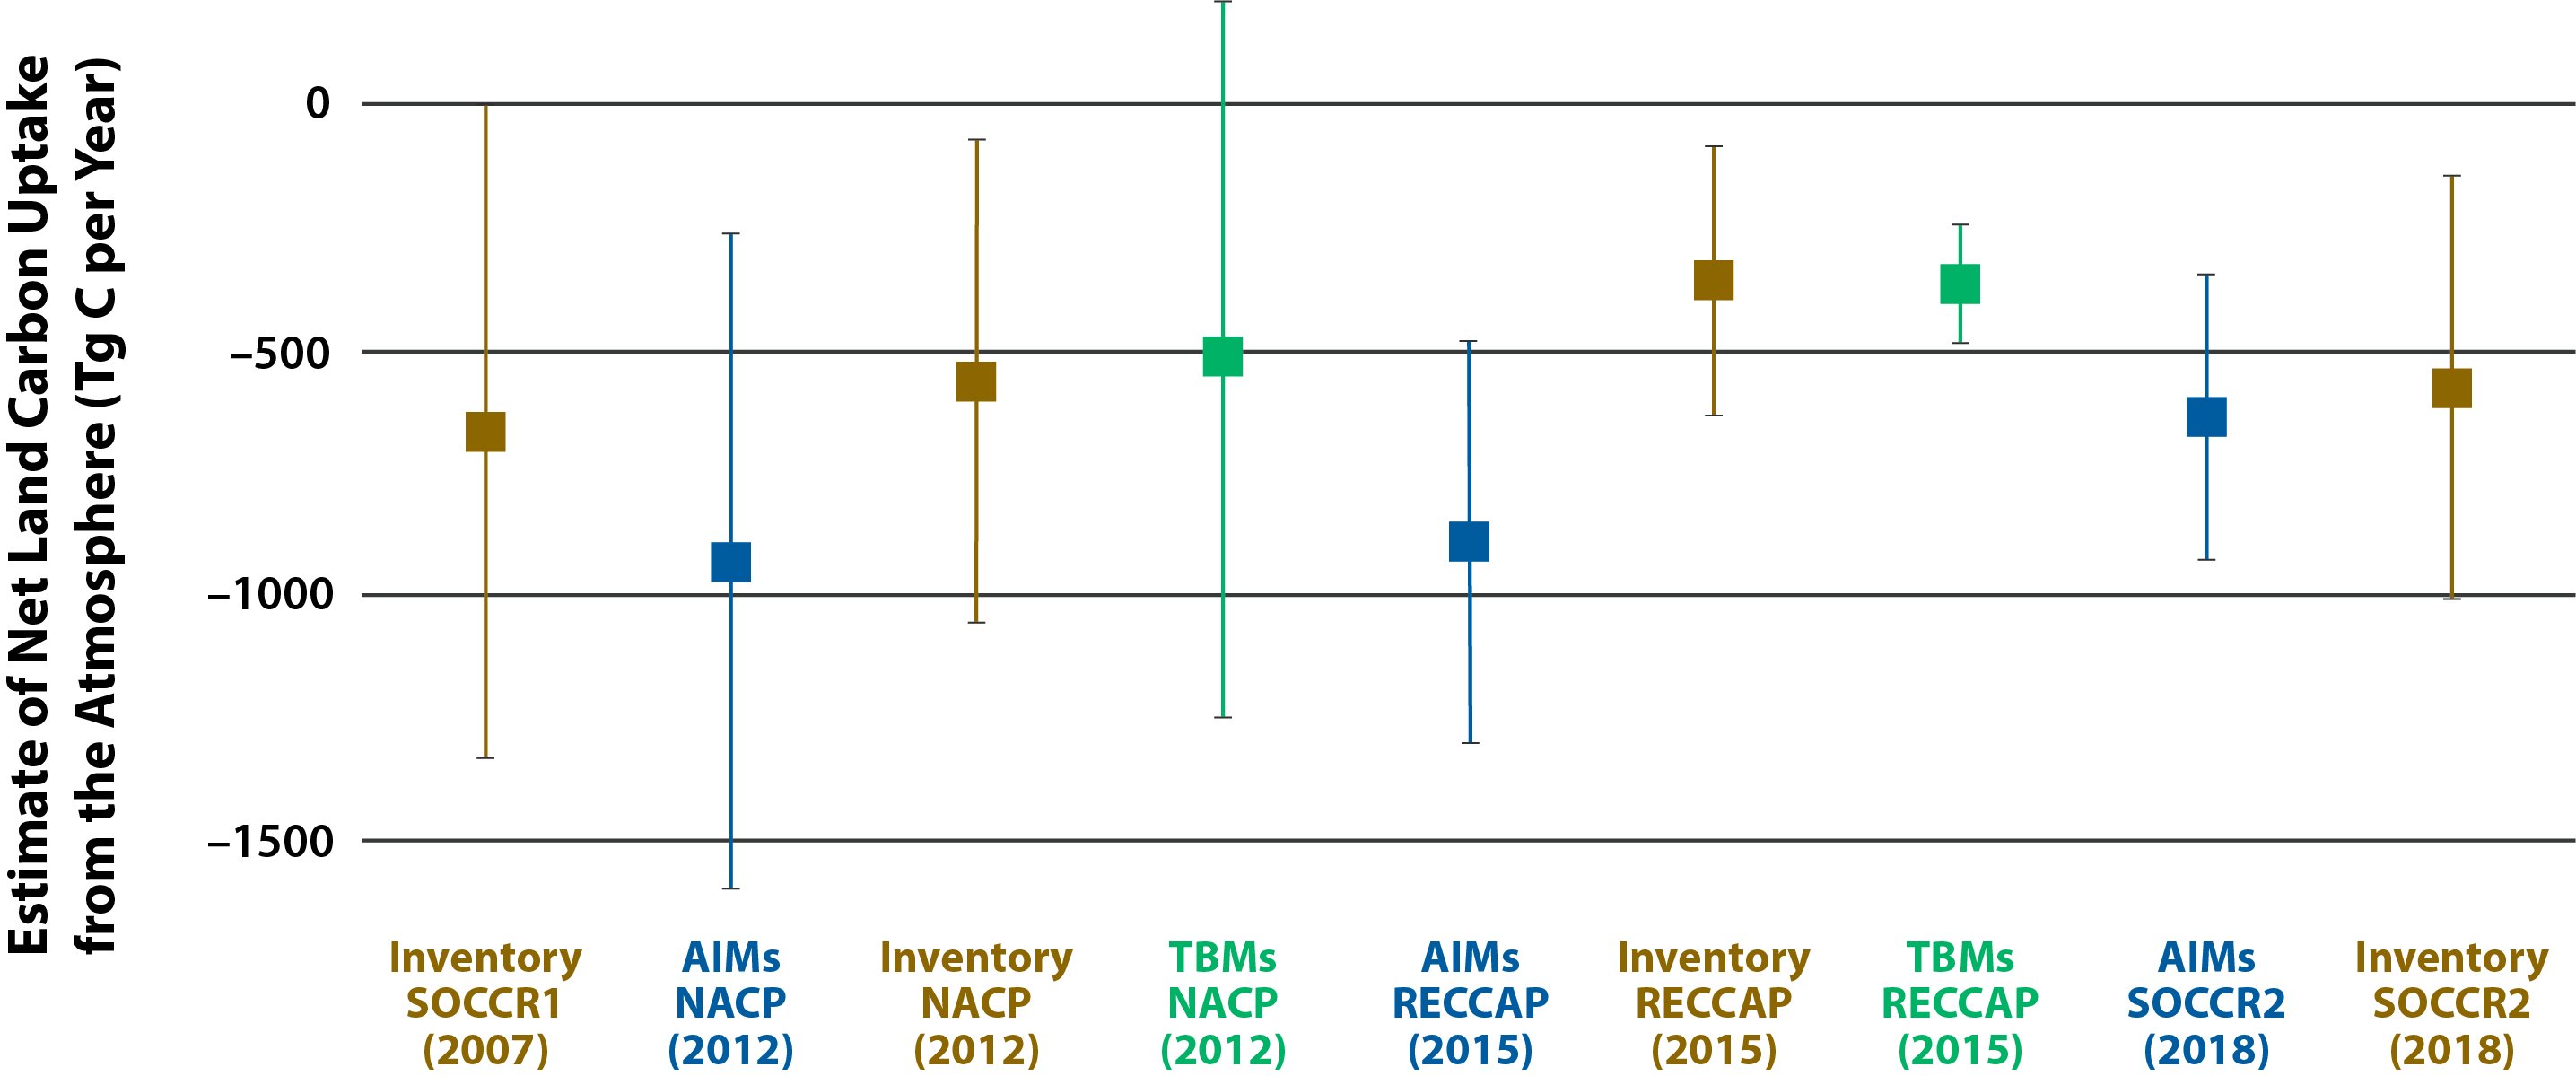
Using bottom-up, inventory-based calculations, the Second State of the Carbon Cycle Report (SOCCR2) estimates that the average annual strength of the land-based carbon sink in North America was 606 Tg C per year (±75%) during the 2004 to 2013 time period, compared with the estimated 505 Tg C per year (±50%) in ca. 2003, as reported in the First State of the Carbon Cycle Report (CCSP 2007). There is apparent consistency in the two estimates, given their ranges of uncertainty, with SOCCR2 calculations including additional information on the continental carbon budget. However, large uncertainties remain in some components (very high confidence).
The magnitude of the continental carbon sink over the last decade is estimated at 699 Tg C per year (±12%) using a top-down approach and 606 Tg C per year (±75%) using a bottom-up approach, indicating an apparent agreement between the two estimates considering their uncertainty ranges.*
Very High | Likely | As Likely As Not | Unlikely | Very Unlikely |
---|---|---|---|---|
≥ 9 in 10 | ≥ 2 in 3 | ≈ 1 in 2 | ≤ 1 in 3 | ≤ 1 in 10 |
Note: Confidence levels are provided as appropriate for quantitative, but not qualitative, Key Findings and statements. See Guide to this Report for more on uncertainty of numerical estimates.
<b>Hayes</b>, D. J., R. <b>Vargas</b>, S. R. Alin, R. T. Conant, L. R. Hutyra, A. R. Jacobson, W. A. Kurz, S. Liu, A. D. McGuire, B. Poulter, and C. W. Woodall, 2018: Chapter 2: The North American carbon budget. In Second State of the Carbon Cycle Report (SOCCR2): A Sustained Assessment Report [Cavallaro, N., G. Shrestha, R. Birdsey, M. A. Mayes, R. G. Najjar, S. C. Reed, P. Romero-Lankao, and Z. Zhu (eds.)]. U.S. Global Change Research Program, Washington, DC, USA, pp. 71-108, https://doi.org/10.7930/SOCCR2.2018.Ch2.
Since the Industrial Revolution, human activity has released into the atmosphere unprecedented amounts of carbon-containing greenhouse gases (GHGs), such as carbon dioxide (CO2) and methane (CH4), that have influenced the global carbon cycle. For the past three centuries, North America has been recognized as a net source of CO2 emissions to the atmosphere (Houghton 1999, 2003; Houghton and Hackler 2000; Hurtt et al., 2002). Now there is greater interest in including in this picture emissions of CH4 because it has 28 times the global warming potential of CO2 over a 100-year time horizon (Myhre et al., 2013; NAS 2018).
The major continental sources of CO2 and CH4 are 1) fossil fuel emissions, 2) wildfire and other disturbances, and 3) land-use change. Globally, continental carbon sources are partially offset by sinks from natural and managed ecosystems via plant photosynthesis that converts CO2 into biomass. The terrestrial carbon sink in North America is known to offset a substantial proportion of the continent’s cumulative carbon sources. Although uncertain, quantitative estimates of this offset over the last two decades range from as low as 16% to as high as 52% (King et al., 2015). Highlighted in this chapter are persistent challenges in unravelling CH4 dynamics across North America that arise from the need to fully quantify multiple sources and sinks, both natural (Warner et al., 2017) and anthropogenic (Hendrick et al., 2016; Turner et al., 2016a; NAS 2018). Adding to the challenge is disagreement on whether the reported magnitudes of CH4 sources and sinks in the United States are underestimated (Bruhwiler et al., 2017; Miller et al., 2013; Turner et al., 2016a).
At the global scale, about 50% of annual anthropogenic carbon emissions are sequestered in marine and terrestrial ecosystems (Le Quéré et al., 2016). Temporal patterns indicate that fossil carbon emissions have increased from 3.3 petagrams of carbon (Pg C) per year to almost 10 Pg C over the past 50 years (Le Quéré et al., 2015). However, considerable uncertainty remains in the spatial patterns of emissions at finer scales over which carbon management decisions are made. Most importantly, the sensitivity of terrestrial sources and sinks to variability and trends in the biophysical factors driving the carbon cycle is not understood well enough to provide good confidence in projections of the future performance of the North American carbon balance (Friedlingstein et al., 2006; McGuire et al., 2016; Tian et al., 2016).
Historically, the existence (if not the magnitude) of the land sink has been confirmed by inventory-based approaches involving the extrapolation of ground-based measurements to regional, national, and continental scales (Caspersen et al., 2000; Goodale et al., 2002; Pan et al., 2011). Regional- to continental-scale estimates of the magnitude and variability of the terrestrial carbon sink differ substantially among assessments, depending on the measurement or scaling approach used and the budget components considered (Hayes and Turner 2012; King et al., 2015). Estimations of land-based carbon budgets over large domains, typically involving a combination of measurements and modeling, generally can be categorized as either “top-down” (atmosphere-based) approaches or “bottom-up” (biosphere-based) approaches (e.g., field measurements and ecosystem process models).
Top-down approaches provide a reliable constraint on overall land-atmosphere carbon exchange based on direct measurement of spatial and temporal patterns in CO2 concentrations. Regional-scale estimates of net ecosystem exchange (NEE; i.e., the net exchange of CO2 between land and atmosphere) are derived from these observations using different techniques ranging from simple boundary-layer budget approaches (Wofsy et al., 1988) to upscaling eddy covariance data (Jung et al., 2009; Xiao et al., 2014) to more complex inverse modeling of atmospheric transport (Gurney et al., 2002). Atmosphere-based estimates are broadly inclusive and treat all surface-atmosphere CO2 exchange as one integrated flux. However, such estimates have limited attribution information on 1) stock changes within individual components, 2) internal processes, 3) lateral transfers, or 4) the exact location of carbon sinks and sources, which is derived from biosphere-based approaches.
Plot-based measurements serve as the basis for bottom-up approaches—either directly, as input to inventory-based methods (e.g., Birdsey and Heath 1995; Stinson et al., 2011), or indirectly through their use in calibrating ecosystem process models (e.g., McGuire et al., 2001). Although researchers can apply bottom-up approaches at broad scales to estimate flux components individually, evidence suggests there are important carbon pools and fluxes that are undersampled, have large or unknown uncertainties, and are not inventoried or modeled (Hayes et al., 2012; Warner et al., 2017). Despite these limitations, bottom-up methods (e.g., inventories) typically are cited in broader-scale carbon cycle assessments (e.g., Goodale et al., 2002; Pacala et al., 2007; Pan et al., 2011) that favor these approaches for their use of large amounts of measurements, ability to track the total change in ecosystem carbon pools, and comparability among estimates.
Terrestrial carbon budget estimates at global, national, and continental scales have proliferated in recent years. Prominent examples are the Forest Inventory and Analysis (FIA) Program of the U.S. Forest Service (fia.fs.fed.us) within the U.S. Department of Agriculture (USDA), the National Aeronautics and Space Administration’s (NASA) Carbon Monitoring System (carbon.nasa.gov), and the National Oceanic and Atmospheric Administration’s (NOAA) CarbonTracker (esrl.noaa.gov/gmd/ccgg/carbontracker; see also Appendix C: Selected Carbon Cycle Research Observations and Measurement Programs). The U.S. Forest Service is adopting a new approach to carbon accounting that moves FIA data through time by attributing changes in the complete set of pools to disturbance and land use (Woodall et al., 2015). The goal of this new approach is to provide improved estimates of the magnitude and uncertainty of carbon fluxes, along with more detailed information on the drivers and fate of carbon change. In the last decade, the understanding of the North American carbon budget has moved beyond terrestrial emissions and sinks to incorporate anthropogenic, aquatic, and coastal margin CO2 and CH4 dynamics. Since the First State of the Carbon Cycle Report (SOCCR1; CCSP 2007), multiple research efforts have aimed to synthesize and reconcile estimates across the key components of the continental-scale carbon cycle. A series of studies borne from the REgional Carbon Cycle Assessment and Processes (RECCAP) initiative has provided diagnosis and attribution of carbon cycle dynamics for global regions, including North America (King et al., 2015). Designed to advance research from SOCCR1 toward the Second State of the Carbon Cycle Report (SOCCR2), several “interim synthesis” studies organized by the North American Carbon Program (NACP; nacarbon.org) compared observational, inventory-based, and modeled estimates of carbon stocks and fluxes across sites (Schwalm et al., 2010), within subregions (Schuh et al., 2013), and over the continent (Huntzinger et al., 2012). Currently, the Global Carbon Project (globalcarbonproject.org) develops global- and regional-scale estimates of CO2 (Le Quéré et al., 2018) and CH4 (Saunois et al., 2016) budgets. Collectively, these efforts comparing and synthesizing information across various sources of data and methods have improved the understanding of the North American carbon cycle.
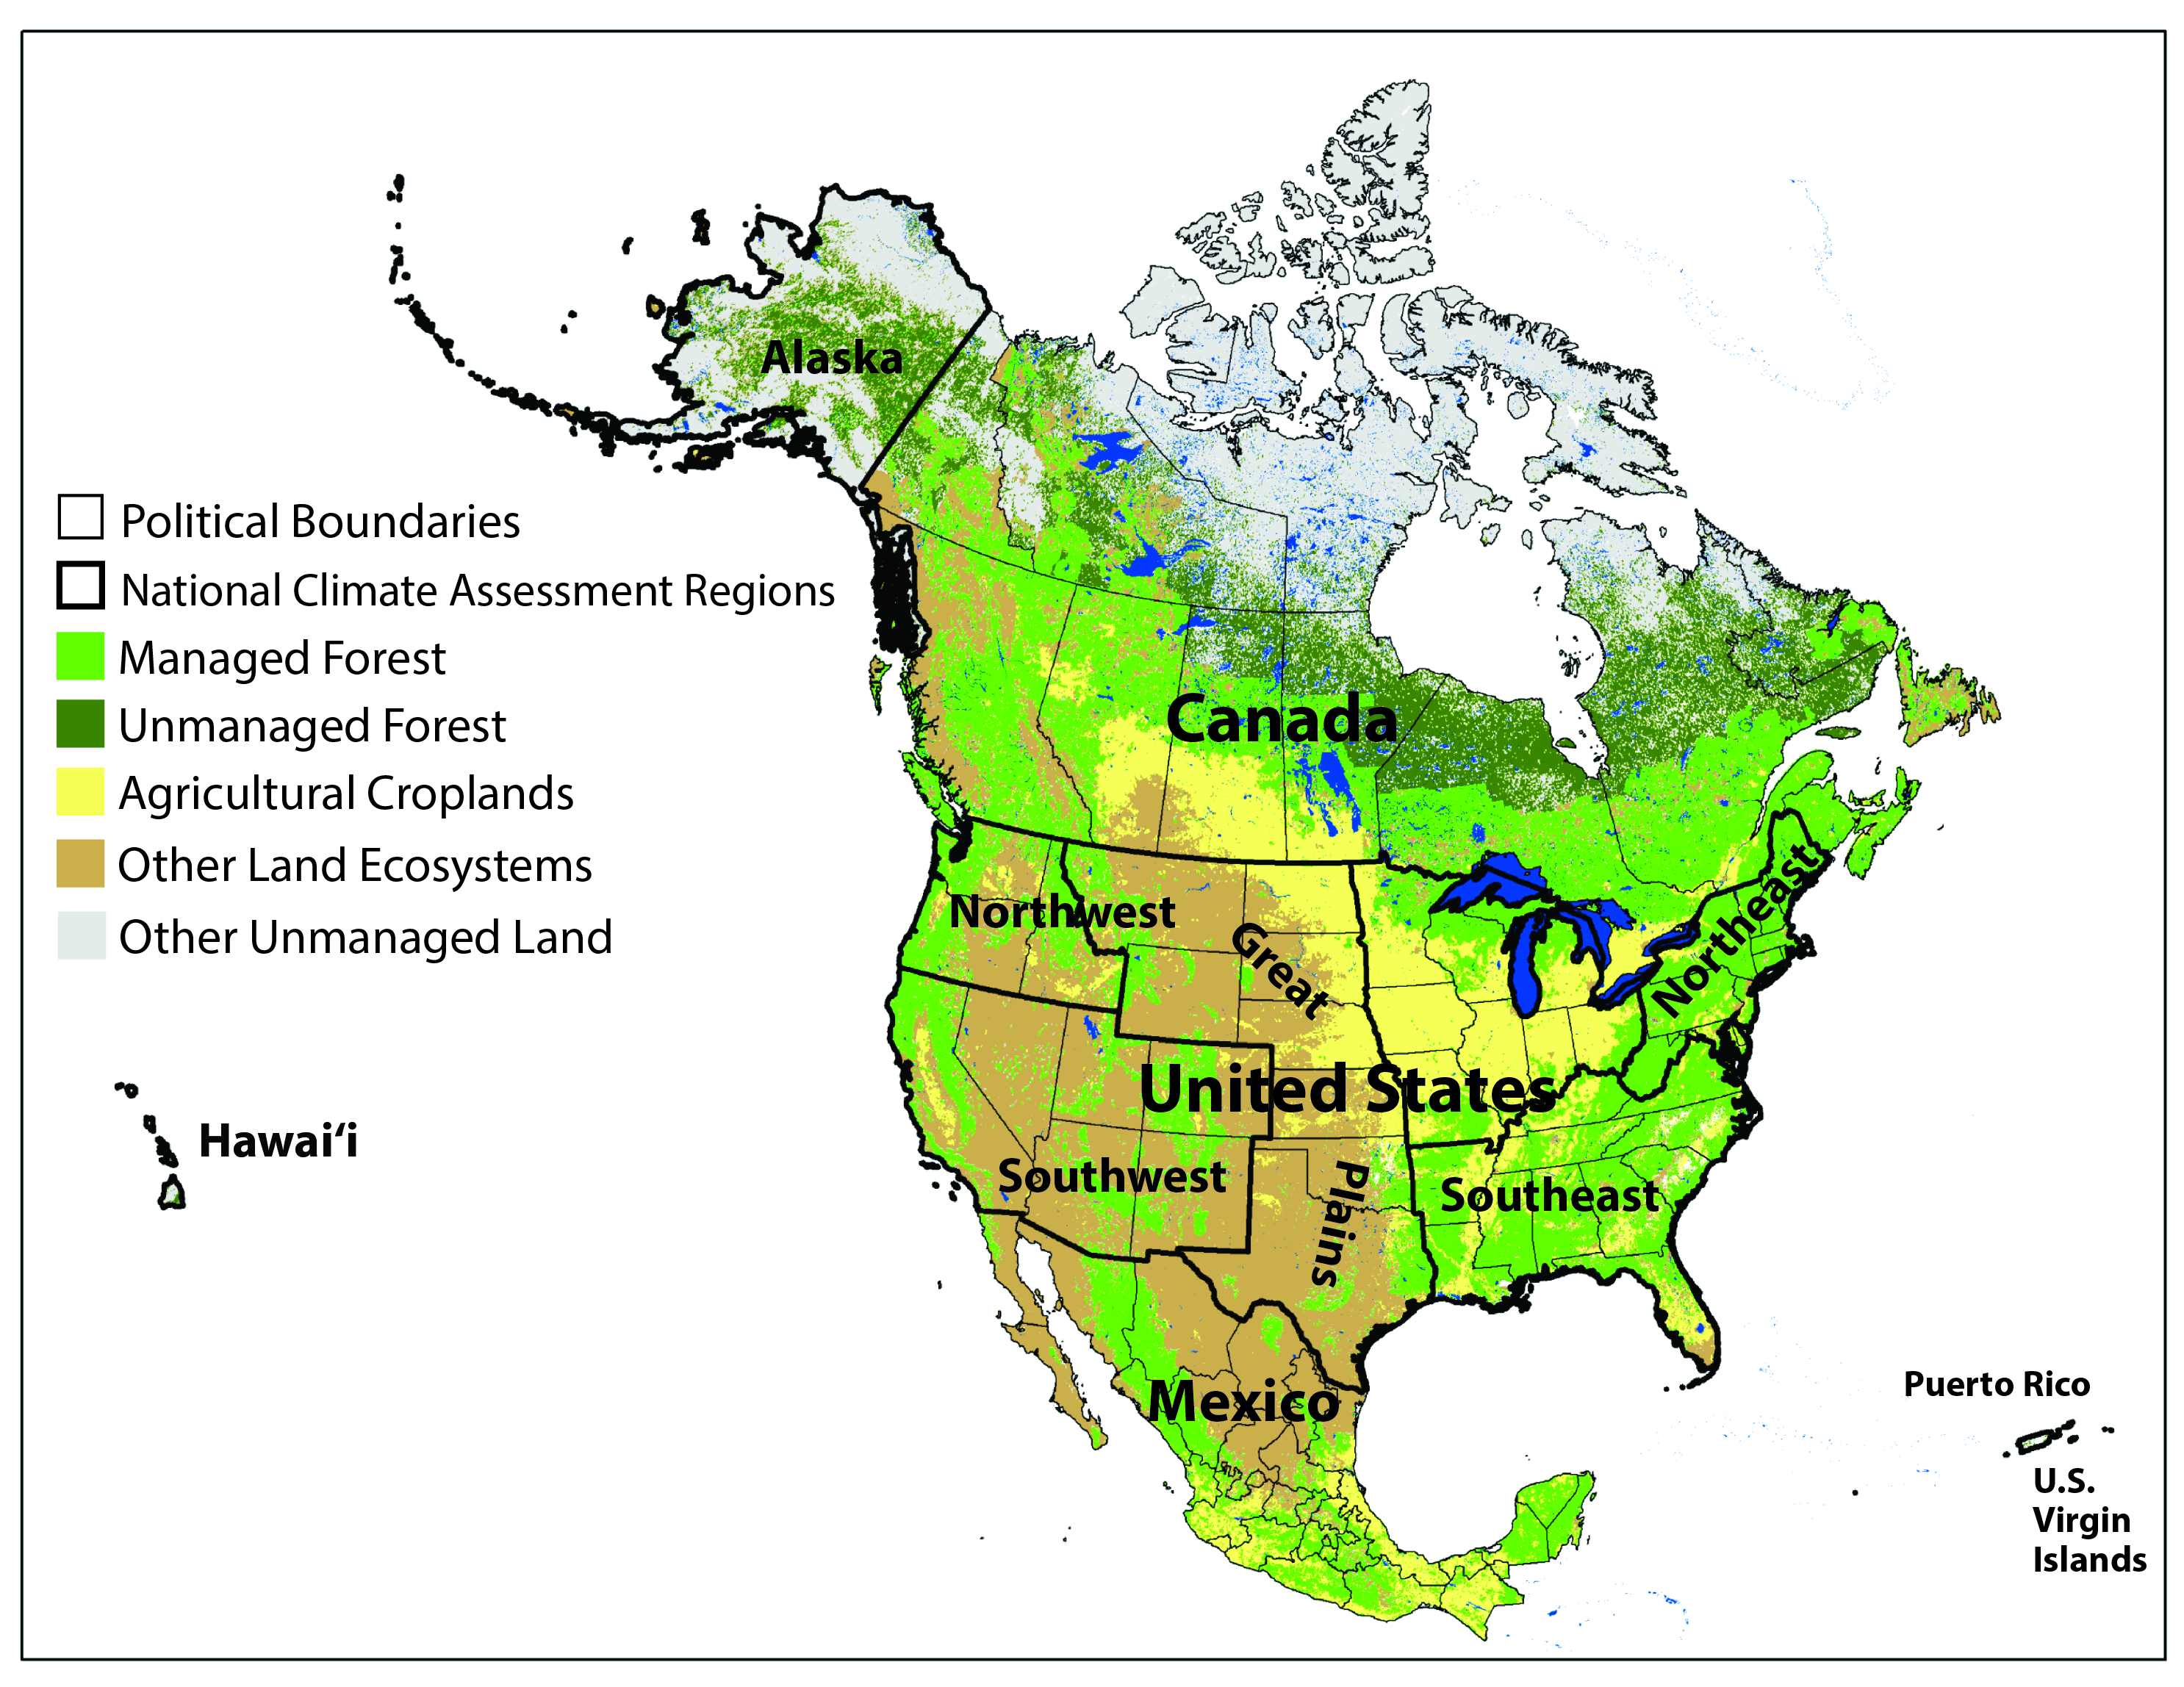
This chapter synthesizes the latest scientific information on the North American carbon budget, incorporating terrestrial, anthropogenic, aquatic, and coastal margin CO2 and CH4 dynamics. The estimates used to develop the continental-scale budget presented here are summarized from previous results based on different methodological approaches encompassing three countries (i.e., Canada, the United States, and Mexico), the U.S. National Climate Assessment regions, and the major carbon sectors (see Figure 2.1).
Specifically, this chapter follows the estimates of North American carbon stocks and fluxes synthesized and reported in Chapter 3 of SOCCR1 (Pacala et al., 2007). That analysis defined the reported estimates as “ca. 2003” to represent the approximate time period of SOCCR1. Here, these estimates are updated for the 2004 to 2013 time frame, or the decade since SOCCR1. However, SOCCR2 does not always rigidly follow these exact dates when combining and reconciling various reported estimates of the different components that make up the carbon budget. As explained where appropriate within this chapter, some datasets have a temporal resolution allowing precise time periods to be summarized, but others do not. As such, this chapter attempts to synthesize the various budget components using reported estimates and datasets generally representative of the 2004 to 2013 time period. Also summarized in this chapter are the historical and current context of continental carbon fluxes and stocks; recent findings of indicators, trends, and feedbacks; and a discussion about social drivers and implications for carbon management decisions.
A review of updated information and new studies since SOCCR1 (CCSP 2007) has established the current understanding of the North American carbon budget presented here. Previous studies have addressed the North American carbon budget for periods that preceded SOCCR1 (e.g., Goodale et al., 2002). Historically, North America is considered a net source of carbon, having contributed to the rise of global GHGs in Earth’s atmosphere over the past century (Le Quéré et al., 2016). This continental carbon source is driven entirely by anthropogenic emissions, primarily via the combustion of fossil fuels to meet energy demands from the industrial and transportation sectors of the United States, Canada, and Mexico. Since the 1970s, total fossil fuel emissions from these countries have increased approximately 1% per year according to the historical data reported in SOCCR1 (Pacala et al., 2007). In 2003, the three countries combined to emit approximately 1,900 teragrams of carbon (Tg C) per year, or about 27% of the global total according to fossil fuel inventory data at the time (Field et al., 2007). Of these three, the United States contributed 85% of that total. Although total U.S. emissions increased at a rate of about 1% per year for the 30 years leading up to 2003, the country’s per capita emissions remained relatively constant, with its carbon intensity (i.e., emissions as a function of gross domestic product) decreasing by 2% over this time period. More recent analyses suggest a 2.8% decline in total North American emissions from 2003 to 2010, with 3.4% and 7.2% decreases in the United States and Canada, respectively, countered by a 13.6% increase in Mexico (King et al., 2012). From 1990 to 2009, North American fossil fuel emissions averaged an estimated 1,700 Tg C per year (Boden et al., 2015), or 25% of the global total during this two-decade period (King et al., 2015).
North American land and its adjacent ocean almost certainly represent a net sink for atmospheric CO2 excluding anthropogenic emissions (King et al., 2015; Peters et al., 2007). In the ca. 2003 time frame, which includes SOCCR1, North America’s terrestrial carbon sink was estimated to be about 505 Tg C per year (±50%), representing about 15% to 40% of continental fossil fuel emissions at that time (Pacala et al., 2007). More recent analyses suggest that the terrestrial carbon sink continues to offset a substantial proportion of the carbon from fossil fuel emissions, though estimates of this proportion range from as low as 16% to as high as 52% over the last two decades (King et al., 2015). The potential North American CO2 sinks vary from 327 to 931 Tg C per year, compensating for about 35% of the continent’s fossil fuel CO2 emissions (King et al., 2012). Natural and managed ecosystems in the United States and Canada consistently have been considered a sink (ranging from 200 to 700 Tg C per year and 44 to 238 Tg C per year, respectively; King et al., 2012). Inventory-based estimates of Mexico’s carbon budget ca. 1990s suggest that the land was a source of approximately 24 to 48 Tg C per year due to emissions resulting from deforestation (Pacala et al., 2007; deJong et al., 2010). However, modeling studies—including both atmospheric inversions and terrestrial process-based approaches—have estimated Mexican ecosystems to be net sinks of about 9 to 31 Tg C per year attributed to the carbon uptake by vegetation exceeding other losses (King et al., 2012; Murray-Tortarolo et al., 2016). Overall, the North American land sector has the potential to take up an estimated 634 Tg C per year from the atmosphere, with an associated uncertainty of ±26% (King et al., 2012).
These estimates, based on combining carbon budget accounting across various sectors, attribute the sink primarily to forest growth, storage in wood products, and carbon sequestration in agricultural soils. For a more comprehensive estimate of the “apparent” sink (i.e., the total net absorption from the atmosphere), SOCCR1 expanded the inventory estimates to include the export of carbon outside the continental borders (Pacala et al., 2007). Accounting for these lateral transfers suggested a net export of carbon off the continent in the form of wood and agricultural products, as well as through river-to-ocean transport. Because these horizontal transfers are not vertical fluxes back to the atmosphere, adding them increased the estimated total North American atmospheric sink to 666 Tg C of the continent’s annual emissions.
Confidence in inventory-based estimates of the North American carbon budget varies by sector according to the coverage of observations and measurements associated with that sector. Relative to the estimates of other components of the continental carbon cycle, the magnitudes of annual fossil fuel emissions from energy and transportation inventories in Canada, the United States, and Mexico, as reported in SOCCR1, were well known and considered with 95% confidence to be within ±10% of the estimates (CCSP 2007). The estimates for the natural carbon sink components ca. 2003 were more uncertain, considered with 95% confidence to be within ±50% of the reported estimates (Pacala et al., 2007). Studies attempting to quantify the continental-scale carbon sink have been based on 1) synthesis approaches that combine national inventory data for managed forests and agricultural lands in the United States and Canada; 2) estimates of land cover and land-use change in Mexico; and 3) bottom-up, empirical estimates of the contribution of noninventoried components.
Carbon inventories of the national forest and agricultural sectors employ one of a few different, primarily empirical, approaches, each with various levels of uncertainty associated with the estimates. The “stock-change” approach used for U.S. forests is based on the difference between complete inventories at two points in time (Heath et al., 2011; Smith et al., 2010), thus capturing the total change in ecosystem carbon (see Ch. 9: Forests). Alternatively, Canada’s national forest carbon inventory is based on the “gain-loss” method, which starts with a complete inventory that then is updated by modeling forward the components of change, such as growth, mortality, decomposition, and disturbance (Kurz et al., 2009; Stinson et al., 2011). Inventories of agricultural soils in the United States and Canada use empirical (West et al., 2010) and numerical (Environment Canada 2011) models to assess the impacts of management practices on soil organic carbon (SOC) stocks, with an uncertainty of approximately ±30% for the estimate (Hayes et al., 2012). In the United States and Canada, forest and agricultural inventory programs organize and report information on productivity, stock changes, and harvested products, but Mexico’s forestland historically has not been systematically inventoried. Instead, the country’s land estimates largely have been drawn from “bookkeeping” accounting studies (de Jong et al., 2010; Masera et al., 1997) of carbon stocks resulting from land-use change and national reports (INECC/SEMARNAT 2015). These estimates are considered to have higher uncertainty overall (±100%) because of a lack of systematic methodology and repeated inventories throughout time (Vargas et al., 2017), although a national forest inventory is now in place in Mexico and has provided new estimates in this report (see Ch. 9: Forests).
Some important contributions to continental-scale carbon stocks and fluxes have high uncertainties (or neglect an estimate altogether) for specific components and geographical regions because of the lack of standardized formal inventories or a comprehensive set of measurements across North America. Some of these factors, such as woody encroachment, arid lands, wetlands, and inland waters, have been considered to act as sinks. However, estimates of carbon stock changes in these components have relied on limited measurements or modeled data and thus are considered highly uncertain (essentially 100% of the estimated magnitude; Pacala et al., 2007). In particular, the mechanism whereby woody plants encroach into grasslands and other nonforested lands represents a potentially large flux of carbon, but also was the most uncertain component in the North American carbon budget from SOCCR1 (CCSP 2007). Measured and modeled CO2 fluxes of nonforested, noninventoried regions, such as the tundra biome (McGuire et al., 2012) and water-limited ecosystems (Ahlstrom et al., 2015; Poulter et al., 2014), suggest that these fluxes are important budget components, but ascertaining whether they act as net sinks or sources over the longer term is difficult because of their larger interannual variability.
Some potentially significant carbon budget components were not included in SOCCR1 or other synthesis efforts (e.g., King et al., 2015) due to a lack of inventories or other information sufficient for continental-scale estimation. Arguably, the most important “missing components” are 1) a large but vulnerable reservoir of carbon in northern permafrost soils (Schuur et al., 2015); 2) a potentially weakening sink in unmanaged boreal forests of interior Alaska and northern Canada (Hayes et al., 2011); and 3) the uncertain role of tidal wetlands, estuaries, and the coastal ocean in the continental budget (Bauer et al., 2013; McLeod et al., 2011). Many carbon budget synthesis studies generally have based their estimates on inventories of total carbon stock change (Pacala et al., 2007) or specifically on surface-atmosphere fluxes of CO2 (King et al., 2015). Also, historically missing from carbon budget studies is a comprehensive assessment of CH4 fluxes. Although CH4 is an important carbon-containing GHG, CH4 budget synthesis efforts have been limited to a few global-scale, atmospheric-based estimates (Dlugokencky et al., 2011) or to specific ecosystems such as wetlands (Bloom et al., 2017). Only recently have there been reports of continental-scale estimates of CH4 or other GHG fluxes, particularly from bottom-up estimates of budget components (Sheng et al., 2017; Tian et al., 2015).
Alternative scaling methods may account for some of these unknown components from the inventories, though they have their own information gaps and sources of uncertainty. Previous studies comparing atmospheric approaches based on inversion modeling over North America have suggested a much stronger land-based CO2 sink than bottom-up estimates at both regional (Hayes et al., 2011; Turner et al., 2011) and continental scales (Hayes et al., 2012; King et al., 2012; Pacala et al., 2001). For example, the NACP interim synthesis activity reported a continental terrestrial carbon sink of approximately 325 ± 77% Tg C per year, an estimate much lower than the mean atmospherically-based estimate of 931 ± 72% Tg C per year (Hayes et al., 2012). Biases in boundary conditions and transport in atmospheric inverse modeling (AIM) frameworks could have led to overestimates of the strength of the carbon sink over the mid- to high-latitude regions of North America (Göckede et al., 2010; Stephens et al., 2007). The bottom-up modeling approach, meanwhile, has exhibited an extremely large range of flux estimates as a consequence of variation in structural formulation and process representation across the ensemble of terrestrial biosphere models (TBMs), along with differences in the climate and land-use datasets used as model drivers (Huntzinger et al., 2012; Schwalm et al., 2010). Comparisons have suggested that a large contribution of the noninventoried “additional fluxes” would need to be added to the inventory-based sink estimates in SOCCR1 (Pacala et al., 2007) and the NACP synthesis (Hayes et al., 2012) to approach the magnitude suggested by the means of the AIM and TBM model ensembles (King et al., 2012). Reconciling the estimates across these various scaling approaches, King et al. (2012) concluded that the “best estimate” of the magnitude of the continental land CO2 sink early in this century was 635 ± 26% Tg C per year, offsetting about 35% of fossil fuel emissions over that time period.
Current estimates of carbon stocks available from the sector-based chapters across SOCCR2 are compiled in Table 2.1. These estimates total about 627 Pg C stored in North American terrestrial ecosystems, particularly soils or sediments, which contain about 93% of the total stock. Notably, the magnitude of many soil pools across ecosystems has not been measured or estimated (see Table 2.1), leading to an unknown uncertainty in the size of this pool (see Ch. 12: Soils). Estimates of vegetation carbon stocks generally are more comprehensive and precise than soil stocks because vegetation biomass—particularly in forests—can be estimated with inventory measurements and remote-sensing methods (Masek et al., 2015). Relative to the organic carbon stored in long-term soil pools, vegetation stocks are of much smaller magnitude and are more transient as a function of their higher turnover rates. The largest SOC pool, thought to be stored in northern high-latitude soils (Tarnocai et al., 2007, 2009), is vulnerable to decomposition and release to the atmosphere as permafrost thaws due to climate warming (Schuur et al., 2015). In general, however, a reliable estimate of total stocks at the continental scale currently is not possible, given the lack of comprehensive and systematic inventories across all the major components of the carbon cycle. Instead, the SOCCR2 synthesis effort focuses on the stock changes, fluxes, and transfers of carbon among the major terrestrial and coastal pools and the atmosphere.
Carbon Pools | Canada | United States | Mexico | North America |
---|---|---|---|---|
Forest Biomassb | 18,591 | 19,675 | 1,995 | 40,261 |
Forest Soilsc | 31,395 | 31,454 | 4,900 | 67,749 |
Agricultural Soilsd | 5,500 | 13,000 | 2,115 | 20,615 |
Grassland Biomasse | NDf | 1,362 | ND | 1,362 |
Grassland Soilsg | ND | 6,049 | 4,100 | 10,149 |
Tundra Biomassh | 1,010 | 350 | NAf | 1,360 |
Permafrost Soilsi | ND | ND | NAf | 459,000 |
Terrestrial Wetland Biomassj | 946 | 412 | 16 | 1,374 |
Terrestrial Wetland Soilsk | 46,354 | 20,188 | 764 | 67,306 |
Inland Waters Sediment | ND | ND | ND | ND |
Tidal Wetland and Estuary Soilsl | ND | ND | ND | 1,886 |
Coastal Ocean Sediment | ND | ND | ND | ND |
Total Biomass | 20,547 | 21,799 | 2,011 | 44,357 |
Total Soils | 83,249 | 70,691 | 11,879 | 626,705 |
Notes
a Data, in teragrams of carbon (Tg C), are from the sector-based chapters of this report.
b Includes above- and belowground biomass plus deadwood (Table 9.2).
c Includes litter plus soil (Table 9.2).
d Canadian estimate (Table 12.4); U.S estimate from Rapid Carbon Assessment (RaCA) project (Table 12.1); Mexican grazing lands estimate (Table 12.3).
e Estimate for conterminous United States only (Table 10.2).
f ND = no data; NA = not applicable.
g Conterminous U.S. estimate (Table 10.2); Mexican estimate for “Other Lands” (Table 12.2).
h Tundra vegetation biomass for Canada and Alaska (Table 11.2).
i North America contains about one-third of the total estimated 1,460 to 1,600 petagrams of carbon (Pg C) stock of circumpolar permafrost soils (to a 3-m depth; see Ch. 11: Arctic and Boreal Carbon).
j Calculated as 2% of the total carbon stock of nonforested wetlands with peatland and mineral soils (Table 13.1).
k Calculated as 98% of the total carbon stock of nonforested wetlands with peatland and mineral soils (Table 13.1).
l The total estimated carbon stocks from tidal wetlands, estuaries, and seagrasses (see Ch. 15: Tidal Wetlands and Estuaries)
All of the land, water, and coastal ocean flux estimates compiled in the budget presented here are considered to be the best available approximations of each sector’s NEE, as shown in Table 2.2, where a negative value represents a removal (i.e., sink) from the atmosphere. There is very high confidence that the North American continent—including its energy systems, land base, and coastal ocean—was a net source of carbon to the atmosphere from 2004 to 2013, having contributed on average approximately 1,008 Tg C per year (see Table 2.2). Natural sinks within North American land ecosystems, waters, and coastal ocean areas accounted for about 766 Tg C per year in net uptake from 2004 to 2013, offsetting about 43% of the total fossil fuel emissions over that time period. The largest sink in this continental-scale budget is the estimated 260 Tg C per year associated with inland waters. This estimate represents the net effect of inland waters on surface-atmosphere CO2 exchange, accounting for lateral fluxes, gas emissions, and sedimentation (see Ch. 14: Inland Waters), but it is considered a highly uncertain value (i.e., >100% of the estimate). The United States has the largest estimated land-based sink (360 Tg C per year) among the three countries, with the majority of net uptake occurring in its forest sector (201 Tg C per year). The U.S. forest sector estimate is among the most well constrained of the land ecosystem fluxes, with the true value likely to be within 25% of the estimate. Estimated uptake by the North American coastal ocean, at 160 Tg C per year, represents the other significant sink in the budget, having a medium certainty (i.e., within 50% of the estimate; see Ch. 16: Coastal Ocean and Continental Shelves). All the estimated fluxes from land and coastal ocean ecosystems, compiled across the key sectors of the continental carbon budget, are based largely on inventory approaches or other bottom-up methods described in other chapters of this report.
Carbon Source (+) or Sink (–) | Canada | United States | Mexico | North America |
---|---|---|---|---|
Fossil Source (+) | ||||
Fossil Fuel Emissions (Ch. 3) | 148 | 1,496 | 130 | 1,774 |
Nonfossil Sink (–) or Source (+) | ||||
Forests (Ch. 9) | 16 | –201 | –32 | –217 | Agricultural Soilsa | –1 | –14 | NDb | –15 |
Grasslands (Ch. 10)c | –3 | –13 | –9 | –25 |
Arctic and Boreal Carbon (Ch. 11) | –9 | –5 | NAb | –14 |
Terrestrial Wetlands (Ch. 13)d | –18 | –34 | –7 | –58 |
Inland Waters (Ch. 14) | ND | –85 | ND | –260 |
Tidal Wetlands and Estuaries (Ch. 15) | ND | –8 | ND | –17 |
Coastal Ocean (Ch. 16) | ND | ND | ND | –160 |
Total | –15 | –360 | –48 | –766 |
Net Carbon Source | 134 | 1136 | 82 | 1,008 |
Estimates of carbon emissions (sources) or uptake (sinks) are given in teragrams of carbon (Tg C) per year. These estimates are generally consistent with those in Figure 2.3, although some components are defined differently and estimates include inferred values. Because the estimates have different spatial domains, the North American total does not always equal the sum of the three individual country estimates. Mathematical rounding accounts for the difference between the estimated North American net carbon source in this table (1,008 Tg C per year) and the carbon added to the atmospheric pool over North America in Figure 2.3 (1,009 Tg C per year).
Notes
a Average annual stock change in soil organic carbon in croplands, 2000–2009; based on inventory estimates by King et al. (2015).
b ND = no data; NA = not applicable.
c “Inventory Analysis” estimates (Table 10.1).
d The “Net Carbon Balance” of nonforested wetlands with peatland and mineral soils (Table 13.1).
According to recent data (Boden et al., 2015), the United States emitted approximately 1,400 Tg C from fossil fuel burning, cement production, and gas flaring during 2013—accounting for 15% of the global total that year. The United States still contributes 85% of the combined fossil fuel emissions from the three North American countries, but in 2013 the continental proportion of the global total dropped to 17% from the 27% reported for 2003 in SOCCR1 (CCSP 2007). The proportional emissions among the three nations to the continental total have remained relatively constant over the last 30 years (about 8%, 86%, and 6% for Canada, the United States, and Mexico, respectively), but the annual total magnitudes have varied in the last 10 years because of changing national and global socioeconomic factors (King et al., 2012). The annual rate of total fossil fuel emissions from North America indicates a notable change in trend during the decade since SOCCR1. Emissions from 1994 to 2003 showed a significant (p<0.01) increasing trend of 24 Tg C per year in contrast to a significant decreasing trend of 23 Tg C per year between 2004 and 2013 (see Figure 2.2 and Ch. 8: Observations of Atmospheric Carbon Dioxide and Methane). In 2007, the highest annual continental total fossil fuel emissions were recorded at about 1,800 Tg C. That level has not been exceeded since, with emissions estimates averaging about 1,700 Tg C per year from 2008 to 2013.
Among the various potential sources of emissions data (see Appendix E: Fossil Fuel Emissions Estimates for North America), the Carbon Dioxide Information Analysis Center (CDIAC) dataset was chosen for its consistency and length of record (Boden et al., 2017). However, assigning an uncertainty to the CDIAC time series is a challenge. Andres et al. (2014) discuss various ways to characterize the uncertainty of this data product and suggest that a time-average uncertainty for the United States could be about 4% (or 2 standard deviations around the mean estimate). U.S. fossil fuel estimates reported in SOCCR1 used ±5% for the uncertainty of estimates for developed countries, concordant with intercomparisons using the International Energy Agency dataset (IEA 2005). This chapter represents the uncertainty as the fractional range of estimates from five different inventories, averaged over time (see Appendix E). By this measure, estimates of fossil fuel emissions have varied in uncertainty over time and among countries. The current ±5.5% uncertainty applies to the total estimated North American fossil fuel emissions of 1,774 Tg C per year from 2004 to 2013 as reported here (see Table 2.2). The uncertainty around the mean estimate by country is highest for Canada (±30%) and lower for Mexico (±15%) and the United States (±6%). Precision of the fossil fuel emissions estimates is sensitive to the spatial and temporal scales of the inventories, and uncertainty at the scale of individual cities is poorly constrained, ranging from 50% to 100% variation around the mean (NAS 2010; Rayner et al., 2010; see also Ch. 4: Understanding Urban Carbon Fluxes). Notably, current uncertainties associated with urban emissions typically exceed emissions reduction goals, making verification of these goals very challenging (Gurney et al., 2015; Hutyra et al., 2014).
Calculating North American NEE involves assembling information from the major sectors (i.e., ecosystem compartments) for each country (see Table 2.2). The North American forest sector estimate (–217 Tg C per year) is based on current inventory estimates from this report (see Ch. 9: Forests), including forestland NEE, the net of forest area gain and loss, the sink in urban trees, and emissions from biomass removal and use in each country (see Table 9.3). The estimate for agricultural soils (–15 Tg C per year) is based on average annual stock change data for the 2000s, as compiled for the United States and Canada by King et al. (2015). Grassland estimates for the three countries (i.e., –3, –13, and –9 Tg C per year for Canada, the United States, and Mexico, respectively) represent average annual stock change in “other lands” between 2000 and 2006, as reported by Hayes et al. (2012; see also Table 10.1). The estimated NEE for the Arctic-boreal region of North America (–14 Tg C per year) is based on a synthesis of eddy covariance flux data during the 2000s from research sites in Alaska and Canada (King et al., 2015; McGuire et al., 2012). Of this small sink, the portion attributed to the United States (–5 Tg C per year) is based on model simulations for upland ecosystems in Alaska (Genet et al., 2016) and, without a specific estimate for NEE, the remaining portion (–9 Tg C per year) is attributed to Arctic tundra and unmanaged boreal forest in Canada. The NEE estimate for terrestrial wetlands included in this budget (–58 Tg C per year) is based on information from Ch. 13: Terrestrial Wetlands. However, only the contribution from nonforested wetlands (including both peatland and mineral soils) is included in the calculations (see Table 13.1) because NEE from forested wetlands is considered to be accounted for already in the estimate for the forest sector. The estimated contribution to continental NEE from inland waters (–260 Tg C per year) is based on estimates from Ch. 14: Inland Waters and considered here to be the amount of carbon of terrestrial origin that is stored as sediment (155 Tg C per year) plus the amount exported to estuaries (105 Tg C per year; see Table 14.1), as discussed in more detail below. The NEE estimate given for the combined tidal wetland and estuary ecosystems (–17 Tg C per year) is the balance of uptake by tidal wetlands (–27 Tg C per year) and outgassing by estuaries (10 Tg C per year), as estimated from information in Ch. 15: Tidal Wetlands and Estuaries and as discussed in more detail below. Finally, data from Ch. 16: Coastal Ocean and Continental Shelves are used to account for the uptake of atmospheric carbon by waters of the coastal ocean (–160 Tg C per year; see Table 16.5) in the continental NEE budget estimates.
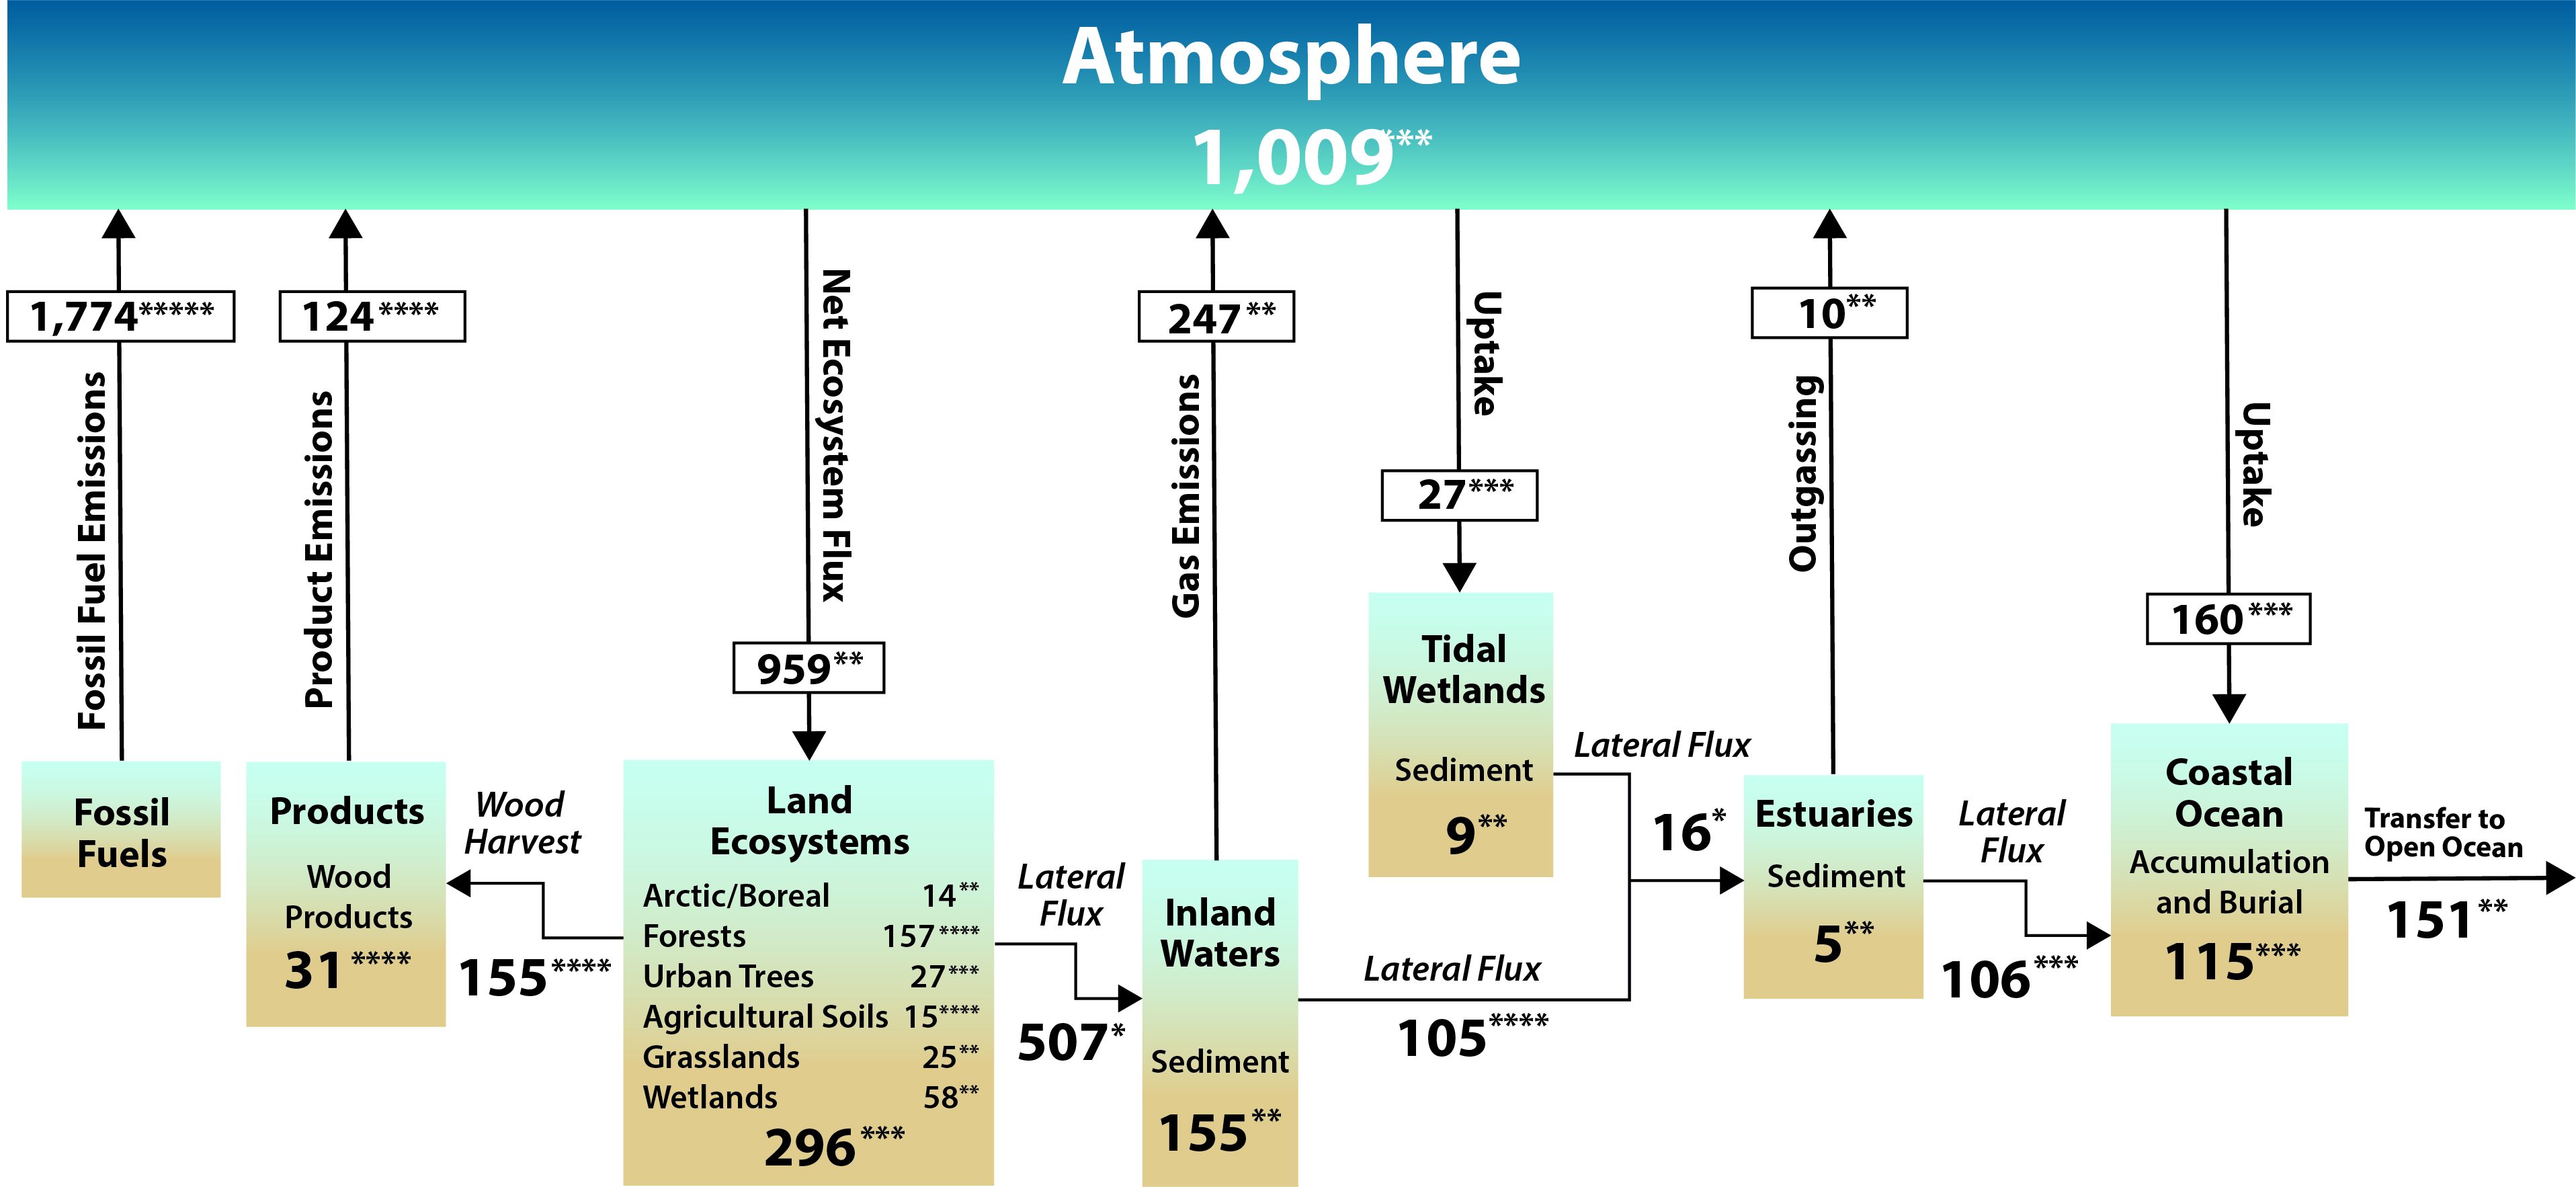
Figure 2.3 shows carbon flows among the major components of the North American carbon cycle for the decade since the ca. 2003 estimates reported in SOCCR1. This figure aims to reconcile atmospheric flux and lateral transfer estimates with estimates of stock changes among the major sectors described throughout this report. Unlike estimates of sector-atmosphere exchange (i.e., NEE) in Table 2.2, the boxes in Figure 2.3 represent the best estimates of stock change in each component, and the arrows represent the flows of carbon between components. As explained in Section 2.1 the 2004 to 2013 time period chosen for this analysis generally represents the decade since the estimates reported in Chapter 3 of SOCCR1, which are given as ca. 2003. These exact dates are not used rigidly, however, when combining and reconciling various datasets in the budget synthesis reported here. Although some datasets—such as the fossil fuel emissions estimates (e.g., Boden et al., 2015)—have a temporal resolution allowing summary of precise time periods, other datasets, such as the periodically sampled forest inventory (see Ch. 9: Forests), do not. As such, this chapter attempts to synthesize the various budget components using reported estimates and datasets generally representative of the 2004 to 2013 time period. While this coarser-than-annual level of precision does add an additional (but unknown) amount of uncertainty to the overall budget, this synthesis approach represents a best estimate of carbon stock changes and flows for an average year during the decade since the SOCCR1 synthesis.
Collectively, the land ecosystems of North America increased their carbon stocks at an estimated rate of about 296 Tg C per year over the ca. 2004 to 2013 time period, as shown in Figure 2.3. The majority (i.e., 53%) of this stock increase occurred in the managed forests of North America. The estimate for stock change in forests at the continental scale is the sum of the three countries, where stock change in forestland plus the net of forest area loss or gain was used to calculate U.S. and Canadian estimates and where forest NEE was used as an approximation of stock change in Mexico (see Table 9.3). The stock change estimate for urban trees is distinguished from that of the forest sector, and the transfers and fluxes associated with the wood products pool are separated as well. Remaining land carbon gains occurred in smaller sinks associated with wetlands, urban trees in settled areas, grasslands, and agricultural soils, along with Arctic ecosystems and unmanaged boreal forests in Alaska and Canada. The stock change in each of these land ecosystems is approximated as their NEE estimates (see Table 2.2). In addition to the net gain in land ecosystems, a substantial amount of carbon was transferred laterally out of land ecosystems into aquatic ecosystems (507 Tg C per year; see Table 14.1) and pools of harvested products (155 Tg C per year; see Table 9.3). The large amount of carbon estimated as lateral fluxes from land ecosystems originates in atmospheric CO2 taken up by vegetation before being cycled through the soil pool and ultimately transported to aquatic systems. Similarly, the carbon in wood products also was taken up originally in forest trees before being removed in harvest. As such, the lateral transfer fluxes of carbon into both wood harvest and aquatic ecosystems are added to net stock change estimates to calculate an overall apparent net absorption of atmospheric CO2 by North American land ecosystems (959 Tg C per year).
Net ecosystem flux into North American land ecosystems from the atmosphere is an estimated 959 Tg C per year (see Figure 2.3). Of that amount, about 371 Tg C per year (or approximately 40%) is returned to the atmosphere through a combination of emissions from both inland waters (247 Tg C per year, which include emissions from rivers, streams, lakes, and reservoirs; see Table 14.1) and from woody biomass removal and use (124 Tg C per year; see Table 9.3). The rest of the lateral carbon transfers are stored as sediments in inland waters (155 Tg C per year; see Table 14.1), stored as wood in the products pool (31 Tg C per year; see Table 9.3), or exported to estuarine and coastal ocean systems (105 Tg C per year; see Table 14.1). Tidal wetlands are estimated to act as an additional small net sink of atmospheric CO2 (27 Tg C per year) that either is stored in sediment (9 Tg C per year) or transferred laterally to estuaries (16 Tg C per year) that represent a small net outgassing of CO2 (10 Tg C per year; see Ch. 15: Tidal Wetlands and Estuaries). Coastal ocean areas are estimated to be a substantial net sink of carbon from the atmosphere (160 Tg C per year; see Table 16.5) over the time period of analysis. Additional carbon is buried in estuary sediments (5 Tg C per year; see Ch. 15) and in the coastal ocean (115 Tg C per year; see Table 16.5). The remainder in the overall budget calculation represents a net export of carbon out of the continental system to the open ocean (151 Tg C per year; see Table 16.5).
Totaling all the vertical fluxes in Figure 2.3 amounts to an overall estimate of 1,009 Tg C per year added to the atmosphere from North America when considering all sources and sinks over the 2004 to 2013 time period. (Note that Table 2.2 provides a slightly different estimate of 1,008 Tg C per year due to rounding differences). In reconciling estimates of carbon stock change, fluxes, and lateral transfers across components in the overall budget, it is important to note that the total carbon from sedimentation, emissions, and export from inland waters (507 Tg C per year) represents carbon that has been taken up by terrestrial ecosystems and transferred laterally to inland waters. As such, this substantial amount of carbon is accounted for in the net ecosystem uptake estimate (959 Tg C per year) within the continental-scale, mass-balance budget (see Figure 2.3). Forest carbon budgets track the loss of carbon but may not distinguish between direct losses to the atmosphere and losses to streams and lakes, from which there are CO2 emissions to the atmosphere. Thus, there is potential for an unknown amount of double-counting of CO2 emissions assumed to be heterotrophic respiration in forest ecosystem models and CO2 emissions observed from inland water bodies and coastal margins. On the other hand, some of the CO2 assumed lost from terrestrial ecosystems may in fact be accumulating in lake and ocean sediments.
The coastal margin sources and sinks within North America’s carbon budget are not well understood, although land margin ecosystems provide a critical link in the lateral transport of carbon from land to ocean (Battin et al., 2009). This knowledge gap is largely due to limited information about the magnitude, spatial distribution, and temporal variability of carbon sources and sinks in coastal waters. Information from North America’s estuaries indicates that they act as carbon sources and include 12% of global estuary emissions (Chen et al., 2013). The coastal ocean and continental shelf regions are estimated net sinks for carbon (Bourgeois et al., 2016; Laruelle et al., 2015), but upwelling regions can be “hotspots” of emissions during upwelling events (Reimer et al., 2013), resulting in current debate about the processes governing carbon dynamics in the coastal ocean (Cai 2011).
The potential benefits of the North American CO2 sink (i.e., mitigating against the buildup of GHGs in the atmosphere) may be negated wholly by emissions of non-CO2 GHGs such as CH4 and nitrous oxide (N2O; Tian et al., 2015, 2016). North America is a net source of CH4 to the atmosphere, and isotopic approaches to partition global integrated measurements of δ13C-CH4 confirm a large source from agriculture, wetlands, and fossil fuels (Dlugokencky et al., 2009; Kirschke et al., 2013). The Global Carbon Project recently estimated global and regional CH4 sources and sinks for the 2003 to 2012 time period using both bottom-up and top-down approaches (Saunois et al., 2016). For North America, inventory-based estimates of anthropogenic CH4 sources (e.g., fossil fuels, agriculture, and biofuels) ranged from 38 to 49 Tg CH4 per year, while modeling estimates of CH4 emissions from wetlands ranged from 23 to 80 Tg CH4 per year (see Figure 2.4). Compared to these bottom-up estimates, the top-down CH4 emissions estimates based on AIM approaches generally were lower for natural sources (17 to 52 Tg CH4 per year) but similar for anthropogenic sources (25 to 61 Tg CH4 per year). Methane sinks include the oxidation of CH4 either from reactions with atmospheric hydroxyl radicals or from methanotrophy in upland soils, estimated for North America to be from 5 to 16 Tg CH4 per year (Kirschke et al., 2013). Confidence in estimates of CH4 emissions typically is low at all spatial scales (Brandt et al., 2014; Kirschke et al., 2013; Miller et al., 2013). Wetland emissions uncertainty is dominated by inaccuracies in location, extent, and seasonal dynamics of the CH4-producing area (Desai et al., 2015), and anthropogenic emissions uncertainty is related to oil and gas production and distribution (Brandt et al., 2014; Frankenberg et al., 2016; McKain et al., 2015). Uncertainties from energy-related activities derive from knowing neither the actual extent and duration of gas flaring, nor the magnitude of leakage from pipelines, distribution systems, and other point sources. A recent example is the Aliso Canyon, California, gas leak that released about 97 gigagrams of CH4 to the atmosphere (Conley et al., 2016). Although this gas leak was measured and monitored, it was undetected for a time. The number of other leaks that may have gone undetected or unmeasured, and for how long, is uncertain.
Most published information on carbon cycling across North America is focused on the United States and Canada; thus, there is greater uncertainty about carbon dynamics for Mexico (Vargas et al., 2012). Data from SOCCR1 (CCSP 2007) suggested a large uncertainty in lands with woody encroachment and wetlands, so resolving whether these places acted as persistent carbon sources or sinks across North America was not possible at the time. SOCCR2 assessments suggest that the main uncertainties are in grasslands, wetlands, inland waters, and the Arctic. Importantly, because woody encroachment is considered implicitly in this report to be within grasslands and forests, it contributes to the uncertainty of these two sectors. Fossil fuel emissions continue to be the largest source of carbon to the atmosphere, and current estimates are consistent with those from SOCCR1. Attempts to quantify the coastal ocean component of the continental carbon budget has contributed a substantial amount of uncertainty in these assessments. Although SOCCR1 considered the coastal ocean a net source of carbon, new and better information from advances in measurement and modeling approaches now suggests it represents a net carbon uptake (see Ch. 16: Coastal Ocean and Continental Shelves). The Arctic and boreal regions continue to be areas of uncertainty with large carbon stocks in permafrost and freshwater wetlands and with unknown land-atmosphere fluxes of CO2 and CH4 (McGuire et al., 2012; Petrescu et al., 2010; Schuur et al., 2015). Expanding research capabilities across different regions of North America will contribute to reducing uncertainty in key areas such as grasslands, wetlands, boreal and Arctic ecosystems, and tropical to subtropical regions.
For the ca. 2003 time frame, SOCCR1 estimated that about 30% of the combined fossil fuel emissions from the three North American countries were offset by CO2 uptake in their ecosystems (Pacala et al., 2007). Based entirely on inventory estimates, carbon sinks in that analysis were attributed mostly to the forest sector, including tree growth, vegetation regeneration after agricultural land abandonment, fire suppression, and storage in wood products (Pacala et al., 2007). Estimates for fossil fuel emissions from 2000 to 2014 average approximately 1.8 ± 0.5 Pg C per year, with about 40% being offset by the land carbon sink (see Ch. 8: Observations of Atmospheric Carbon Dioxide and Methane). Several studies support forests remaining as the key sector with a persistent sink globally (Pan et al., 2011) and across the United States (Woodall et al., 2015) and Canada (Kurz et al., 2013; Stinson et al., 2011). The SOCCR2 assessment presented here suggests that forests across North America offset fossil fuel emissions by about 12%, with U.S. forests accounting for most of that sink (i.e., 11%; see Table 2.2). When these estimates are divided by fossil fuel emissions per country, the country-specific offset by forests suggests a slightly higher potential for Mexico (i.e., offsetting approximately 25% of in-country emissions), followed by the United States (about 13%). However, Canada’s forests act as an additional source (about 11%) on top of the country’s fossil fuel emissions. There is additional uncertainty surrounding boreal forests and tundra ecosystems in the northern high latitudes of North America (see Ch. 11: Arctic and Boreal Carbon), particularly since these remote areas of unmanaged land in Canada and Alaska are not included in either of their country’s formal carbon inventories and reporting programs (Kurz et al., 2009). In studies based on time series, optical satellite data have shown both “greening” in Arctic tundra and “browning” in boreal forests (e.g., Beck and Goetz 2011), suggesting regional variability in vegetation photosynthetic dynamics that could lead to carbon gains and losses, respectively (e.g., Epstein et al., 2012). Large carbon stocks stored in the frozen soils of North American landscapes underlain by permafrost are vulnerable to thaw under a warming climate, leading to carbon decomposition and subsequent release to the atmosphere as CO2 or CH4 (Hayes et al., 2014; Schuur et al., 2015). The increasing frequency and severity of disturbances in these regions, particularly wildfire, have the potential to impact vegetation and soil carbon stocks and fluxes in complicated feedback mechanisms (e.g., Abbott et al., 2016).
An analysis by King et al. (2015) demonstrates an 11% increase in the total magnitude of average annual continental emissions during 2000 to 2010 compared with 1990 to 2000. Since inventory data first became available in the 1960s, there has been a mostly uninterrupted increasing trend in overall fossil fuel emissions (Pacala et al., 2007). However, over the last decade, the combined fossil fuel emissions from Canada, the United States, and Mexico have been flat or declining. Combined annual emissions ranged from 1.7 to 1.8 Pg C between 2008 and 2013 and have not exceeded the approximately 1.9 Pg C peaks during 2005 and 2007 (see Figure 2.2). The lower emissions total resulted from the 2007 to 2009 global economic recession and subsequent decline in energy consumption by the industrial and transportation sectors (see Ch. 3: Energy Systems). From 2000 to 2009, annual per capita emissions were an estimated 20 tons (t) CO2 in the United States, 18 t CO2 in Canada, and 4 t CO2 in Mexico. These estimates compare with a substantial decrease in per capita emissions by 2015 for the United States and Canada (about 17 t CO2 and 16 t CO2, respectively) and a stabilization in emissions for Mexico (about 4 t CO2 per person; Le Quéré et al., 2016).
The trends in CH4 emissions have been variable in recent decades, showing a renewed growth rate in global atmospheric concentrations since 2007 following a period of stabilization (Nisbet et al., 2016). However, the most recent budget by Saunois et al. (2016) compares CH4 emissions from two decades: 2000 to 2009 and 2003 to 2012. This study found no significant increase in total natural and anthropogenic emissions for boreal North America (20 Tg CH4 per year) and central North America (11 Tg CH4 per year), and even a slight decrease for the conterminous United States (from 43 to 41 Tg CH4 per year). Although shortwave infrared measurements of CH4 from the Greenhouse Gases Observing Satellite (GOSAT) indicate a 30% increase from 2002 to 2014 in central United States, the U.S. Environmental Protection Agency’s (EPA) GHG inventory shows no such increase in anthropogenic emissions, despite a 20% increase in oil and gas production (Turner et al., 2016a). Changes in CH4 emissions from high-latitude regions thus far appear to be fairly insensitive to warming (Sweeney et al., 2016), suggesting that changes in agriculture and livestock management are the key drivers in the recent increase in global CH4 emissions (Schaefer et al., 2016). Using a one-box isotopic model, Schaefer et al. (2016) suggest that, outside the Arctic, activities related to food production are most likely responsible for the increasing CH4 concentration in the atmosphere since 2007. Some research also considered a decrease in the hydroxyl sink for CH4 as a driver of the renewed growth rate (Rigby et al., 2008); however, more recent multitracer assessments do not support this theory (Nisbet et al., 2016).
Monitoring networks suggest that the coastal margins of North America currently act as a net CO2 sink, where the net uptake of CO2 from the atmosphere is driven by high-latitude regions; however, the net flux from coastal margins is not well constrained (see Figure 2.4 and Ch. 16: Coastal Ocean and Continental Shelves). Ocean acidification trends are difficult to identify in coastal waters because highly variable carbonate chemistry is influenced by seawater temperature and transport, primary production, respiration, and inputs from land, in addition to the uptake of anthropogenic CO2 from the atmosphere. In coastal ocean areas, major concerns for marine organisms, particularly calcifiers, are the increasing partial pressure of CO2 (pCO2) in seawater and reductions in pH that reflect greater acidity associated with increasing dissolved CO2 concentrations in equilibrium with rising atmospheric CO2—processes that could trigger ecosystem-scale effects. Ocean acidification also affects commercial shellfish stocks (mainly in the northwestern United States) and other environmental services (e.g., coastal protection by reefs) that ultimately may affect the carbon storage capacity of coastal ocean areas (see Ch. 17: Biogeochemical Effects of Rising Atmospheric Carbon Dioxide).
SOCCR2 assessments provide high confidence that human activities (e.g., urban emissions, land management, and land-use change) will continue to be important drivers of carbon cycle changes across North America into the future. Current land use and land-use change result in net CO2 emissions for Canada and Mexico, but future land use and land-use management potentially could result in net carbon sequestration (e.g., 661 to 1,090 Tg of CO2 equivalent1 by 2030; see Ch. 19: Future of the North American Carbon Cycle). However, there are large uncertainties in predicting future land-use trajectories. In addition, fossil fuel emissions from the energy sector may continue to be a large source of carbon, but future projections are uncertain because of changes in technologies (see Ch. 1: Overview of the Global Carbon Cycle and Ch. 3: Energy Systems) and efforts to reduce fossil fuel emissions. By 2040, estimates project that North American fossil fuel emissions will range from 1.6 to 1.9 Pg C per year, representing either a 9% decrease or a 6% increase in absolute emissions compared to 2015 levels (see Ch. 19).
Efforts to understand the North American carbon cycle—including its stock and flux changes and socioecological implications—cross sociopolitical and economic boundaries. This report shows that regional efforts have measured, modeled, and scaled carbon sources and sinks across North America and quantified the uncertainties associated with those estimates. Arguably, the most carbon cycle information is available for the United States, followed by Canada and Mexico. This information availability translates into higher confidence for estimates of carbon dynamics across the conterminous United States and Canada but lower confidence for Mexican estimates.
In general, SOCCR1 and subsequent publications (see sections above) suggest that terrestrial ecosystems in Mexico act as net sources of carbon to the atmosphere (due to land use and agricultural practices), while those in the United States and Canada tend to be net sinks of carbon from the atmosphere. In contrast, the United States is the highest emitter of fossil fuel emissions, followed by Canada and Mexico. These dynamics are related to differences in socioecological drivers that regulate carbon dynamics among the three countries, influencing the continental-scale carbon cycle.
The United States is characterized by a stable forestland, whose area gains and losses have roughly balanced over the last century (see Ch. 9: Forests), enhancing the terrestrial carbon sink. In contrast, the large U.S. economy and population have high energy demands that contribute to the largest carbon emissions in North America. U.S. fossil fuel emissions were 1.5 Pg C per year (±6%) from 2004 to 2013 (see Table 2.2), or approximately 4,700 kilograms (kg) C per person. Canada is characterized by an extensive natural resource base, where forests represent the largest ecosystem carbon pool. These forests have high disturbance rates and low productivity, resulting in an overall nearly neutral carbon balance. Although Canada’s per capita emissions rate of 4,100 kg C is similar to the U.S. rate, its lower population resulted in substantially smaller fossil fuel emissions (148 Tg C per year ± 2%) from 2004 to 2013. In contrast, Mexico is characterized by higher-productivity forests (particularly its tropical forests), but also by more frequent natural disturbances (e.g., droughts, hurricanes, and fires) and high pressure on the use of natural resources that drives land-use change. Mexico contributed 130 Tg C per year (±15%) in fossil fuel emissions from 2004 to 2013, and its per capita emissions rate (1,000 kg C) is much lower than that of the United States and Canada because of its relatively large population with lower energy consumption.
Fully understanding differences in carbon dynamics across North America requires identifying the size of its carbon pools and the influence of climate feedbacks (e.g., changes in temperature or precipitation patterns) on the capacity of the pools to sequester or release carbon. In addition, differences in population migration patterns (e.g., changes between rural and urban populations), along with economic energy demands, determine anthropogenic drivers and feedback mechanisms of carbon exchange across the three countries of North America.
Terrestrial ecosystems in the eastern United States—located roughly within the Northeast, Midwest, Southeast, and Caribbean National Climate Assessment regions—together have acted as a substantial carbon sink in recent decades (Xiao et al., 2014; Zhu and Reed 2014), largely because of carbon accumulation in forests recovering from past disturbances (Williams et al., 2012). Most of the carbon sink in the eastern United States is in the Northeast and Southeast regions; the carbon sink in the Midwest region is relatively small in comparison. This regional difference is influenced mainly by the dominance of forests in the Northeast and Southeast regions and of agricultural lands in the Midwest. Projected carbon uptake in the Northeast and Southeast regions between 2006 and 2050 is expected to decrease from the current level, primarily because of forest aging in these regions (Liu et al., 2014). A better understanding of forest carbon dynamics is needed to quantify the impacts of 1) forest management, including the locations and intensity of widespread partial cutting in the Northeast region (Zhou et al., 2013); 2) disturbances such as windstorms (Dahal et al., 2014); 3) climate and atmospheric changes including CO2 fertilization (Norby and Zak 2011); and 4) wildland fires (Turetsky et al., 2014). Forest land uses including harvesting (i.e., clear-cutting and partial cutting, with forests remaining as forests) and conversion to other land uses are important driving forces of carbon cycling, not only for direct immediate carbon removal from these activities, but also for subsequent activity-dependent paths of changes in carbon storage. Although wildland fires have contributed only a small source effect on the total U.S. net carbon balance in recent decades (Chen et al., 2017), the area burned by wildland fires and the associated GHG emissions are projected to increase in the future (Hawbaker and Zhu 2014). Carbon stored in the Atlantic coastal wetlands is particularly vulnerable to wildland fires because of land-use activities (Flores et al., 2011).
Terrestrial ecosystems in the Great Plains region acted as a carbon sink from 2001 to 2005 (Zhu et al., 2011). Their current rate of uptake is expected to remain steady or decrease slightly until 2050 as a result of climate change and projected increases in land use. Methane emissions from wetlands and N2O emissions from agricultural lands are high for the region and expected to increase. The amount of area burned in the Great Plains and the region’s GHG emissions are highly variable, both spatially and temporally. Although estimates for the amount of area burned are not expected to increase substantially over time, fire-resultant GHG emissions are expected to increase slightly for a range of climate projections. Land-use and land-cover changes are major drivers of shifts in the region’s carbon storage. Consequently, future carbon storage in the Great Plains region will be driven largely by the demand for agricultural commodities, including biofuels, which might result in substantial expansion of agricultural land at the expense of grasslands, shrublands, and forests. Converting these areas to agricultural lands, among other land-use changes, may lead to considerable loss of carbon stocks from Great Plains ecosystems. Moreover, studies have not fully examined the important regional effects of climate variability and change, such as droughts, floods, and fluctuations in temperature and moisture availability.
The western United States, consisting roughly of the Northwest and Southwest climate regions, acted as a net terrestrial carbon sink from 2001 to 2005 (Zhu and Reed 2012). The carbon density in these regions demonstrated high spatial variability in relation to variation along a climate gradient from the Marine West Coast to Warm Desert ecoregions. Furthermore, drought is recognizably important in the interannual variability of carbon dynamics in water-limited ecosystems across the southwestern United States (Schwalm et al., 2012; Biederment et al., 2016). Compared to the region’s contemporary rate of uptake, future carbon sinks in the western United States are projected to decline, mainly in ecosystems of the Northwest region in response to future climate warming and associated drought effects (Liu et al., 2012). Influenced by both climate and land-use changes, wildland fires have been major ecosystem disturbances in the Northwest and Southwest regions (Hawbaker and Zhu 2012), resulting in considerable interannual and regional variability in GHG emissions, mostly in the semiarid and arid Western Cordillera and Cold Desert ecoregions. From 2001 to 2005, average annual GHG emissions from the fires equaled 11.6% of the estimated average rate of carbon uptake by terrestrial ecosystems in the western United States. Under future climates scenarios, areas burned by wildland fires and the associated GHG emissions are projected to increase substantially from the levels of 2001 to 2005. Other ecosystem disturbances, such as climate- and insect-caused forest mortalities, are important drivers of carbon cycling in these regions, but incorporating these processes into regional carbon cycle assessments remains a major challenge (Adams et al., 2013; Anderegg et al., 2013; Hartmann et al., 2015).
Although forestlands of southeastern Alaska are included in national GHG reports, other regions of Alaska are not because field data for them is insufficient to support a formal inventory program and many areas are classified as “unmanaged” according to the Intergovernmental Panel on Climate Change. However, Alaska’s high-latitude ecosystems are potentially more vulnerable to future climate change than regions in the temperate zone because increasing temperatures may expose the substantial stores of carbon in the region to loss from increasing wildfire and permafrost thaw. To better understand these potential effects, researchers conducted a more comprehensive assessment of carbon stocks and fluxes of CO2 and CH4 across all ecosystems in Alaska by combining field observations and modeling (McGuire et al., 2016). The assessment found that temperate forests in southeastern Alaska store approximately 1,600 Tg C across the major pools, with about twice as much in live and dead tree biomass (1,000 Tg C) than in the SOC pool (540 Tg C). In contrast, the vast majority of carbon stocks in Alaska’s northern boreal forest and Arctic tundra ecosystems occur in SOC (31 to 72 Pg C), much of which is stored in frozen ground (see Ch. 11: Arctic and Boreal Carbon). Despite the average annual source of 5.1 Tg C from the boreal region due to wildfire, Alaskan upland ecosystems overall were estimated to be, on average, a net sink of 5 Tg C per year over recent decades (1950 to 2009). During the same period, this sink was offset partially by the state’s wetland ecosystems that acted as a net source of 1.3 Tg C per year, including 0.93 Tg C per year in biogenic CH4 emissions since 2000. Finally, the total net flux from inland waters across Alaska is estimated at approximately 41.2 ± 20 Tg C per year, where total net flux equals coastal export plus CO2 emissions from rivers and lakes minus burial in lake sediments. However, projections from the Alaska assessment indicate that increased uptake in upland and wetland ecosystems over this century will more than compensate for sources resulting from wildfire, permafrost thaw, and wetland emissions. Carbon sinks in Alaska’s upland and wetland ecosystems are projected to increase substantially (18.2 to 34.4 Tg C per year) from 2010 to 2099, primarily because of a 12% to 30% increase in net primary production associated with responses to rising atmospheric CO2, increased nitrogen cycling, and longer growing seasons.
Changes from local to global carbon dynamics in natural and anthropogenic systems have imminent consequences for humans because carbon is embedded in almost all social activities (see Ch. 6: Social Science Perspectives on Carbon). The resultant social reliance on carbon by North American societies causes dependence on ecological, economical, and technological networks and systems that have carbon embedded in them (e.g., forestry, energy generation, transportation, fisheries, and agriculture). Thus, management decisions have to consider social drivers if the goal is to transition to low-carbon systems and make a substantial impact on the carbon cycle.
Social lifestyles and cultural backgrounds have been constrained historically by available resources, energy sources, and costs that have influenced the North American carbon cycle. For example, the proportional share of total continental fossil fuel emissions differs among the three North American countries (i.e., Canada, 11.9%; Mexico, 6.5%; and the United States, 81.6%); together these countries contribute 20% of global energy-related emissions (see Ch. 3: Energy Systems). Urban development has resulted in spatially concentrated sources of energy demand and consequently high anthropogenic carbon emissions (see Ch. 4: Understanding Urban Carbon Fluxes). Although the area of agricultural land for North America has remained constant in the last decade, regional carbon dynamics can be influenced by trends in food production and agricultural management (see Ch. 5: Agriculture). Differences between cultural backgrounds and current policies are evident in tribal lands. Ideologies, local practices, government land tenure, and agricultural and water policies create challenges for defining carbon management practices (see Ch. 7: Tribal Lands). Despite socioeconomic differences across North America, increasing demand for easily available energy has implications for the continental carbon cycle.
Regional carbon management decisions to mitigate CO2 emissions could benefit from sector-specific accounting, focusing efforts on reducing atmospheric GHG concentrations and identifying options for carbon sinks. Compiled from the chapters in this report, Table 18.1 summarizes a set of management activities and their relative contributions to potential reductions in GHG emissions across the various sectors of the North American carbon budget. For example, North American forests have significant potential as a carbon sink, so mitigation options for this sector could use a systems approach to assess large uncertainties in future land use and predict subsequent impacts on forests (see Ch. 17: Biogeochemical Effects of Rising Atmospheric Carbon Dioxide). These assessments will require quantifying changes in emissions associated with 1) forest ecosystems (e.g., changes in rates of land-use change), 2) harvested wood products and their substitution by high-emission products (e.g., steel and concrete), and 3) fossil fuels through the use of wood products (Kurz et al., 2016; Lemprière et al., 2013). The potential for changes to the carbon balance in the forest sector also will depend on societal drivers related to increases in urbanization and reduction of forested lands via land-use change. These processes could result in a loss of forest industrial capacity across North America that ultimately will limit the potential carbon sink of the forest sector. Therefore, socioecological factors could influence changes in emissions from different sectors, potentially requiring alternative practices to maintain the productivity of sector products (e.g., long-lived forest products) and ecosystems (i.e., carbon sequestration potential in long-term pools such as SOC).
Since SOCCR1, North American observational networks related to the carbon cycle (e.g., CO2 and CH4 stocks and fluxes from aquatic and terrestrial ecosystems) have increased (see Appendix C: Selected Carbon Cycle Research Observations and Measurement Programs). Thus, carbon management decisions could benefit from a high degree of interoperability among government, research, and civil sectors within the countries and across North America. Interoperability in this context is defined as an organized collective effort needed to foster development and implementation of carbon management decisions and actions. Furthermore, interoperability has the ultimate goal to maximize sharing and use of information by removing conceptual, technological, organizational, and cultural barriers (Vargas et al., 2017). For example, interoperability could be increased by defining inventory protocols (i.e., a conceptual barrier), using standardized instrumentation (i.e., a technological barrier), defining the specific roles of participants (e.g., researchers and governmental agencies), and being sensitive to cultural expectations (e.g., perception of data ownership). Although sector- and country-specific barriers exist, moving toward a high degree of interoperability will facilitate anticipation, recognition, and adaptation of management decisions to make a positive impact on the continental carbon cycle.
SOCCR1 (CCSP 2007) concluded that North America was a net source of carbon to the atmosphere ca. 2003, with the magnitude of fossil fuel emissions outpacing the rate of carbon uptake by land sinks. The synthesis of carbon flux estimates in SOCCR2 suggests that North America has remained a carbon source in the decade since SOCCR1, continuing to contribute to the global rise in atmospheric CO2 and CH4 concentrations from 2004 to 2013. Synthesizing across the major continental-scale budget components, SOCCR2 assessments suggest that approximately 57% of the total fossil fuel emissions from Canada, the United States, and Mexico remains in the atmosphere after the offsetting portion is taken up by a net sink across North American land ecosystems, inland waters, and adjacent coastal ocean areas. This overall estimate of the “airborne fraction” of fossil fuel emissions is less than the estimated 70% reported in SOCCR1, a decrease that is a function of both a reduction in the total emissions estimate coupled with an increase in the net continental sink estimate for 2004 to 2013. The values in SOCCR2 also reflect additional information and improved understanding of components and sectors influencing the continental carbon budget, but large uncertainties in some components must be addressed to achieve a better understanding of the trends.
This report estimates that the total fossil fuel carbon source in North America from 2004 to 2013 was 1.8 Pg C per year, representing an approximately 5% reduction in annual emissions compared to the ca. 2003 estimate of 1.9 Pg C per year. The lower current emissions estimate is likely a result of changing technology, policy, and market factors (see Ch. 3: Energy Systems). Despite the modest reduction in emissions, the fossil fuel source still represents the largest single component in the continental-scale carbon budget. The relative contributions from each of the three countries have remained constant since SOCCR1, with the United States continuing to contribute the vast majority (85%) of total continental emissions. The total fossil fuel emissions from energy and transportation systems across North America likely will remain the dominant source category and continue to outpace the ability of the continental land ecosystems, inland waters, and adjacent coastal ocean areas to take up this carbon in the future.
North America’s natural and managed land ecosystems, inland waters, and adjacent coastal ocean areas likely will remain a net carbon sink, thereby partially constraining the airborne fraction of fossil fuel emissions and further mitigating climate impacts from rising atmospheric CO2. Bottom-up, inventory-based analyses have confirmed the existence of the continental carbon sink, but the uncertainty associated with these approaches provides less confidence in estimates of the sink’s magnitude than in the better-constrained estimates of fossil fuel emissions. The “best estimate” of the continental sink from 2004 to 2013 in SOCCR2 is 766 Tg C per year, compared to 505 Tg C per year estimated in SOCCR1. The difference in these two bottom-up estimates can be explained by the additional components considered in SOCCR2 that were not accounted for in SOCCR1. These components include Arctic and boreal ecosystems; estuaries; and updated information and accounting for grasslands, inland water fluxes, terrestrial and tidal wetlands, and the coastal ocean. Still, both the SOCCR1 and SOCCR2 estimates fall within the uncertainty bounds of the other and thus are not considered a trend nor significantly different from each other.
Given the large uncertainty in the bottom-up analysis, comparing it with top-down estimates is important to collectively provide an additional constraint on the overall continental sink estimate. Previous comparisons typically have shown mean estimates of the continental CO2 sink from top-down atmospheric models to be much greater than those from bottom-up inventory and biosphere models, although within the large range of uncertainty in these estimates (King et al., 2012; Pacala et al., 2001). In a progression of studies over time, mean land sink estimates based on atmospheric models have decreased from 1,700 ± 500 Tg C per year (Fan et al., 1998) to 890 ± 409 Tg C per year (King et al., 2015). Meanwhile, best estimates for the sum of sink components from inventory-based methods will increase as additional components are included in the calculation. For example, including estimates of highly uncertain components (e.g., woody encroachment, wetlands, and the net flux in inland waters) increased the sink estimate to 564 Tg C per year from the 325 Tg C per year that only considered reported inventory estimates for forests and agriculture (Hayes et al., 2012). In conclusion, the larger bottom-up sink estimates approach the lower end of the uncertainty in the atmospheric model estimates as these additional components are added, though they also greatly increase the uncertainty of the estimates (King et al., 2012).
SOCCR2 shows further convergence between the top-down, continental-scale carbon sink estimate from atmospheric modeling and the synthesis of estimates from bottom-up approaches across the major components of North America (see Figure 2.5). This convergence partly results from a series of operational, conceptual, and technological improvements. The analysis of a growing network of atmospheric measurements of CO2 and CH4 using inverse modeling techniques has increased significantly since SOCCR1. Several flux modeling systems produce regular continental-scale estimates on an operational basis, and regional inverse modeling studies are now focused on specific land areas and individual megacities (see Ch. 8: Observations of Atmospheric Carbon Dioxide and Methane). Furthermore, recent atmospheric inverse model analyses estimate the continental land sink to be 699 ± 82 Tg C per year, which includes all continental carbon fluxes from land and water but not the coastal ocean sink (see Ch. 8). These estimates are only slightly higher than the bottom-up estimate of 606 Tg C per year that is calculated by removing the coastal ocean sink from the continental total (see Table 2.2). Considering the uncertainty ranges of the two approaches, there is an apparent agreement in the magnitude of the continental carbon sink over the last decade between the top-down and bottom-up estimates in this report. The inverse model analysis of atmospheric CO2 data suggests that there is substantial variability in land-atmosphere carbon fluxes over North America from year to year, though a comparable analysis reported from bottom-up estimates is not possible here because of averaged stock change estimates over the longer time periods between inventories. Additionally, the atmospheric estimates show at least moderate evidence of an increasing rate of carbon uptake in the continental land sink from 2000 to 2014, but any such trend is difficult to ascertain from the bottom-up estimates between SOCCR1 and SOCCR2 because of differences in the components that are included and how they are calculated.
Given the general convergence with the current atmosphere-based estimates, the bottom-up estimates synthesized in this report are unlikely to be missing any major source or sink components in the budget (see Table 2.2). Similar to the continental sink estimates reported in SOCCR1, the forest sector is among the largest sinks (217 Tg C per year), along with smaller but persistent sinks in agricultural soils (15 Tg C per year) and terrestrial wetlands (58 Tg C per year) in SOCCR2. To reiterate, additional small-sink components for Arctic and boreal ecosystems (14 Tg C per year) and tidal wetlands and estuaries (17 Tg C per year) in this report were not considered in SOCCR1. The most significant components now included in SOCCR2 are the net uptakes by inland waters (260 Tg C per year) and by coastal ocean areas (160 Tg C per year). However, a large sink component associated with woody encroachment (120 Tg C per year) was included in SOCCR1 but is not explicitly separated in SOCCR2 because this potential sink mechanism is considered to be included within the forest and grassland estimates. The flux estimates from inland waters, the coastal ocean, and woody encroachment remain highly uncertain and should be prioritized for further study, given their potentially large contribution to the continental carbon budget.
Confidence in estimates of the overall, continentalscale carbon budget is expected to increase in the near future with more observations, improved data, and better understanding of the processes. More accurate, consistent, and highly resolved estimates among the various budget components likely will be helpful in informing management-scale decisions (see Ch. 18: Carbon Cycle Science in Support of Decision Making). Though atmospheric measurements provide an integrated constraint on the overall budget and can detect variability and trends over short time frames, they currently offer limited attribution capability with respect to the various individual components. Bottom-up measurements and inventory estimates are needed to make projections for specific sectors and at the finer spatial scales at which the sectors are managed. These inventories, however, are often expensive and difficult to undertake. Moreover, they do not always obtain all the required measurements with consistent precision and, in many cases, cannot resolve key trends in sources and sinks or attribute their causes. Results from terrestrial biosphere model simulations offer the potential for process-based attribution of regional-scale carbon cycle dynamics (Turner et al., 2016b), but variability in response across the ensemble of model results leads to uncertainty in the predictions (Huntzinger et al., 2012, 2017). The move toward more regional-scale and sector-targeted atmospheric analyses should offer substantial help with these efforts, but advancements in bottom-up biosphere modeling frameworks will be necessary to improve confidence in future projections of the North American carbon budget (see Ch. 19: Future of the North American Carbon Cycle). These estimates also will continue to benefit from the increasing availability of remote-sensing data provided by multiple platforms (Goetz and Dubayah 2014; Masek et al., 2015; Williams et al., 2014). Although there is value in retaining independence among the various top-down and bottom-up approaches for estimating and comparing carbon fluxes, the most significant progress likely will be made by increasing the formal integration of these approaches in future assessment and prediction frameworks that are more comprehensive and consistent.
Abbott, B. W., J. B. J. Jones, E. A. G. Schuur, F. S. I. Chapin, W. B. Bowden, M. S. Bret-Harte, H. E. Epstein, M. D. Flannigan, T. K. Harms, T. N. Hollingsworth, M. C. Mack, A. D. McGuire, S. Natali, M., A. V. Rocha, S. E. Tank, M. Turetsky, R., J. E. Vonk, K. P. Wickland, G. R. Aiken, H. D. Alexander, R. M. W. Amon, B. W. Bensoter, Y. Bergeron, K. Bishop, O. Blarquez, B. Bond-Lamberty, A. L. Breen, I. Buffam, Y. Cai, C. Carcaillet, S. K. Carey, J. M. Chen, H. Y. H. Chen, T. R. Christensen, L. W. Cooper, J. H. C. Cornelissen, W. J. de Groot, T. H. DeLuca, E. Dorrepaal, N. Fetcher, J. C. Finlay, B. C. Forbes, N. H. F. French, S. Gauthier, M. P. Girardin, S. J. Goetz, J. G. Goldammer, L. Gouch, P. Grogan, L. Guo, P. E. Higuera, L. Hinzman, F. S. Hu, G. Hugelius, E. E. Jafarov, R. Jandt, J. F. Johnstone, J. Karlsson, E. S. Kasischke, G. Kattner, R. Kelly, F. Keuper, G. W. Kling, P. Kortelainen, J. Kouki, P. Kuhry, H. Laudon, I. Laurion, R. W. Macdonald, P. J. Mann, P. J. Martikainen, J. W. McClelland, U. Molau, S. F. Oberbauer, D. Olefeldt, D. Paré, M.-A. Parisien, S. Payette, C. Peng, O. S. Pokrovksy, E. B. Rastetter, P. A. Raymond, M. K. Raynolds, G. Rein, J. F. Reynolds, M. Robard, B. M. Rogers, C. Schädel, K. Schaefer, I. K. Schmidt, A. Shvidenko, J. Sky, R. G. M. Spencer, G. Starr, R. G. Striegl, R. Teisserenc, L. J. Tranvik, T. Virtanen, J. M. Welker, and S. Zimov, 2016: Biomass offsets little or none of permafrost carbon release from soils, streams, and wildfire: An expert assessment. Environmental Research Letters, 11(3), 034014, doi: 10.1088/1748-9326/11/3/034014.
Adams, H. D., A. P. Williams, C. Xu, S. A. Rauscher, X. Jiang, and N. G. McDowell, 2013: Empirical and process-based approaches to climate-induced forest mortality models. Frontiers in Plant Science, 4, 438, doi: 10.3389/fpls.2013.00438.
Ahlstrom, A., M. R. Raupach, G. Schurgers, B. Smith, A. Arneth, M. Jung, M. Reichstein, J. G. Canadell, P. Friedlingstein, A. K. Jain, E. Kato, B. Poulter, S. Sitch, B. D. Stocker, N. Viovy, Y. P. Wang, A. Wiltshire, S. Zaehle, and N. Zeng, 2015: Carbon cycle. The dominant role of semi-arid ecosystems in the trend and variability of the land CO2 sink. Science, 348(6237), 895-899, doi: 10.1126/science.aaa1668.
Anderegg, W. R. L., J. M. Kane, and L. D. L. Anderegg, 2013: Consequences of widespread tree mortality triggered by drought and temperature stress. Nature Climate Change, 3(1), 30-36, doi: 10.1038/nclimate1635.
Andres, R. J., T. A. Boden, and D. Higdon, 2014: A new evaluation of the uncertainty associated with CDIAC estimates of fossil fuel carbon dioxide emission. Tellus B: Chemical and Physical Meteorology, 66(1), 23616, doi: 10.3402/tellusb.v66.23616.
Battin, T. J., S. Luyssaert, L. A. Kaplan, A. K. Aufdenkampe, A. Richter, and L. J. Tranvik, 2009: The boundless carbon cycle. Nature Geoscience, 2(9), 598-600, doi: 10.1038/ngeo618.
Bauer, J. E., W.-J. Cai, P. A. Raymond, T. S. Bianchi, C. S. Hopkinson, and P. A. G. Regnier, 2013: The changing carbon cycle of the coastal ocean. Nature, 504(7478), 61-70, doi: 10.1038/nature12857.
Beck, P. S. A., and S. J. Goetz, 2011: Satellite observations of high northern latitude vegetation productivity changes between 1982 and 2008: Ecological variability and regional differences. Environmental Research Letters, 6(4), 049501.
Biederman, J. A., R. L. Scott, M. L. Goulden, R. Vargas, M. E. Litvak, T. E. Kolb, E. A. Yepez, W. C. Oechel, P. D. Blanken, T. W. Bell, and J. Garatuza‐Payan, 2016: Terrestrial carbon balance in a drier world: The effects of water availability in southwestern North America. Global Change Biology, 22(5), 1867-1879, doi: 10.1111/gcb.13222.
Birdsey, R. A., and L. S. Heath, 1995: Carbon changes in U.S. forests. In: Productivity of America’s Forests and Climate Change. General Technical Report RM-GTR-271. [L. A. Joyce (ed.)]. U.S. Department of Agriculture, Forest Service, Rocky Mountain Forest Experiment Station, pp. 56-70.
Bloom, A. A., K. W. Bowman, M. Lee, A. J. Turner, R. Schroeder, J. R. Worden, R. Weidner, K. C. McDonald, and D. J. Jacob, 2017: A global wetland methane emissions and uncertainty dataset for atmospheric chemical transport models (WetCHARTs version 1.0). Geoscientific Model Development, 10(6), 2141-2156, doi: 10.5194/gmd-10-2141-2017.
Boden, T. A., G. Marland, and R. J. Andres, 2017: Global, Regional, and National Fossil Fuel CO2 Emissions Technical Report, Carbon Dioxide Information Analysis Center, U. S. Department of Energy, Oak Ridge National Laboratory, Oak Ridge, TN, USA. doi: 10.3334/CDIAC/00001–V2017.
Boden, T. A., G. Marland, and R. J. Andres, 2015: Global, Regional, and National Fossil-Fuel CO2 Emissions. Carbon Dioxide Information Analysis Center, U. S. Department of Energy, Oak Ridge National Laboratory, Oak Ridge, TN, USA [URL]
Bourgeois, T., J. C. Orr, L. Resplandy, J. Terhaar, C. Ethé, M. Gehlen, and L. Bopp, 2016: Coastal-ocean uptake of anthropogenic carbon. Biogeosciences, 13(14), 4167-4185, doi: 10.5194/bg-13-4167-2016.
Brandt, A. R., G. A. Heath, E. A. Kort, F. O’Sullivan, G. Petron, S. M. Jordaan, P. Tans, J. Wilcox, A. M. Gopstein, D. Arent, S. Wofsy, N. J. Brown, R. Bradley, G. D. Stucky, D. Eardley, and R. Harriss, 2014: Methane leaks from North American natural gas systems. Science, 343(6172), 733-735, doi: 10.1126/science.1247045.
Bruhwiler, L. M., S. Basu, P. Bergamaschi, P. Bousquet, E. Dlugokencky, S. Houweling, , M. Ishizawa, H. S. Kim, R. Locatelli, S. Maksyutov, S. Montzka, S. Pandey, P. K. Patra, G. Petron, M. Saunois, C. Sweeney, S. Schwietzke, P. Tans, and E. C. Weatherhead, 2017: U.S. CH4 emissions from oil and gas production: Have recent large increases been detected? Journal of Geophysical Research: Atmospheres, 122(7), 4070-4083, doi: 10.1002/2016JD026157.
Cai, W. J., 2011: Estuarine and coastal ocean carbon paradox: CO2 sinks or sites of terrestrial carbon incineration? Annual Review of Marine Science, 3, 123-145, doi: 10.1146/annurev-marine-120709-142723.
Caspersen, J. P., S. W. Pacala, J. C. Jenkins, G. C. Hurtt, P. R. Moorcroft, and R. A. Birdsey, 2000: Contributions of land-use history to carbon accumulation in US forests. Science, 290(5494), 1148-1151.
CCSP, 2007: First State of the Carbon Cycle Report (SOCCR): The North American Carbon Budget and Implications for the Gobal Carbon Cycle. A Report by the U.S. Climate Change Science Program and the Subcommittee on Global Change Research. [A. W. King, L. Dilling, G. P. Zimmerman, D. M. Fairman, R. A. Houghton, G. Marland, A. Z. Rose, and T. J. Wilbanks (eds.)]. National Oceanic and Atmospheric Administration, National Climatic Data Center, Asheville, NC, USA, 242 pp.
Chen, C–T. A., T. H. Huang, Y. C. Chen, Y. Bai, X. He, and Y. Kang, 2013: Air-sea exchanges of CO2 in the world’s coastal seas. Biogeosciences, 10(10), 6509-6544, doi: 10.5194/bg-10-6509-2013.
Chen, G., D. J. Hayes, and A. David McGuire, 2017: Contributions of wildland fire to terrestrial ecosystem carbon dynamics in North America from 1990 to 2012. Global Biogeochemical Cycles, 31(5), 878-900, doi: 10.1002/2016GB005548.
Conley, S., G. Franco, I. Faloona, D. R. Blake, J. Peischl, and T. B. Ryerson, 2016: Methane emissions from the 2015 Aliso Canyon blowout in Los Angeles, CA. Science, 351(6279), 1317-1320, doi: 10.1126/science.aaf2348.
Dahal, D., S. Liu, and J. Oeding, 2014: The carbon cycle and hurricanes in the United States between 1900 and 2011. Scientific Reports, 4, 5197, doi: 10.1038/srep05197.
de Jong, B., C. Anaya, O. Masera, M. Olguín, F. Paz, J. Etchevers, R. D. Martínez, G. Guerrero, and C. Balbontín, 2010: Greenhouse gas emissions between 1993 and 2002 from land-use change and forestry in Mexico. Forest Ecology and Management, 260(10),
1689-1701, doi: 10.1016/j.foreco.2010.08.011.
Desai, A. R., K. Xu, H. Tian, P. Weishampel, J. Thom, D. Baumann, A. E. Andrews, B. D. Cook, J. Y. King, and R. Kolka, 2015: Landscape-level terrestrial methane flux observed from a very tall tower. Agricultural and Forest Meteorology, 201, 61-75, doi: 10.1016/j.agrformet.2014.10.017.
Dlugokencky, E. J., E. G. Nisbet, R. Fisher, and D. Lowry, 2011: Global atmospheric methane: Budget, changes and dangers. Philosophical Transactions of the Royal Society A: Mathematical, Physical and Engineering Sciences, 369(1943), 2058-2072, doi: 10.1098/rsta.2010.0341.
Dlugokencky, E. J., L. Bruhwiler, J. W. C. White, L. K. Emmons, P. C. Novelli, S. A. Montzka, K. A. Masarie, P. M. Lang, A. M. Crotwell, J. B. Miller, and L. V. Gatti, 2009: Observational constraints on recent increases in the atmospheric CH4 burden. Geophysical Research Letters, 36(18), doi: 10.1029/2009GL039780.
Environment Canada, 2011: National Inventory Report 1990-2009: Greenhouse Gas Sources and Sinks in Canada. The government of Canada’s Submission to the UN Framework Convention on Climate Change. Environment Canada. [URL]
Epstein, H. E., M. K. Raynolds, D. A. Walker, U. S. Bhatt, C. J. Tucker, and J. E. Pinzon, 2012: Dynamics of aboveground phytomass of the circumpolar Arctic tundra during the past three decades. Environmental Research Letters, 7(1), 015506, doi: 10.1088/1748-9326/7/1/015506.
Fan, S., M. Gloor, J. Mahlman, S. Pacala, J. Sarmiento, T. Takahashi, and P. Tans, 1998: A large terrestrial carbon sink in North America implied by atmospheric and oceanic carbon dioxide data and models. Science, 282(5388), 442, doi: 10.1126/science.282.5388.442.
Field, C. B., J. Sarmiento, and B. Hales, 2007: The carbon cycle of North America in a global context. In: First State of the Carbon Cycle Report (SOCCR): The North American Carbon Budget and Implications for the Global Carbon Cycle. A Report by the U.S. Climate Change Science Program and the Subcommittee on Global Change Research. [A. King, W. L. Dilling, G. P. Zimmerman, D. M. Fairman, R. A. Houghton, G. Marland, A. Z. Rose, and T. J. Wilbanks (eds.)]. National Oceanic and Atmospheric Administration, National Climatic Data Center, Asheville, NC, USA, pp. 21-28.
Flores, C., D. L. Bounds, and D. E. Ruby, 2011: Does prescribed fire benefit wetland vegetation? Wetlands, 31(1), 35-44, doi: 10.1007/s13157-010-0131-x.
Frankenberg, C., A. K. Thorpe, D. R. Thompson, G. Hulley, E. A. Kort, N. Vance, J. Borchardt, T. Krings, K. Gerilowski, C. Sweeney, S. Conley, B. D. Bue, A. D. Aubrey, S. Hook, and R. O. Green, 2016: Airborne methane remote measurements reveal heavy-tail flux distribution in Four Corners region. Proceedings of the National Academy of Sciences USA, 113(35), 9734-9739, doi: 10.1073/pnas.1605617113.
Friedlingstein, P., P. Cox, R. Betts, L. Bopp, W. von Bloh, V. Brovkin, P. Cadule, S. Doney, M. Eby, I. Fung, G. Bala, J. John, C. Jones, F. Joos, T. Kato, M. Kawamiya, W. Knorr, K. Lindsay, H. D. Matthews, T. Raddatz, P. Rayner, C. Reick, E. Roeckner, K. G. Schnitzler, R. Schnur, K. Strassmann, A. J. Weaver, C. Yoshikawa, and N. Zeng, 2006: Climate–carbon cycle feedback analysis: Results from the C4MIP model intercomparison. Journal of Climate, 19(14), 3337-3353, doi: 10.1175/jcli3800.1.
Genet, H., Y. He, A. D. McGuire, Q. Zhuang, Y. Zhang, F. Biles, D. V. D’Amore, X. Zhou, and K. D. Johnson, 2016: Terrestrial carbon modeling: Baseline and projections in upland ecosystems. In: Baseline and Projected Future Carbon Storage and Greenhouse-Gas Fluxes in Ecosystems of Alaska. [Z. Zhu and A. D. McGuire (eds.)]. U.S. Geological Survey Professional Paper 1826, pp. 105-132.
Göckede, M., D. P. Turner, A. M. Michalak, D. Vickers, and B. E. Law, 2010: Sensitivity of a subregional scale atmospheric inverse CO2 modeling framework to boundary conditions. Journal of Geophysical Research: Atmospheres, 115(D24), doi: 10.1029/2010jd014443.
Goetz, S., and R. Dubayah, 2014: Advances in remote sensing technology and implications for measuring and monitoring forest carbon stocks and change. Carbon Management, 2(3), 231-244, doi: 10.4155/cmt.11.18.
Goodale, C. L., M. J. Apps, R. A. Birdsey, C. B. Field, L. S. Heath, R. A. Houghton, J. C. Jenkins, G. H. Kohlmaier, W. Kurz, S. Liu, G.-J. Nabuurs, S. Nilsson, and A. Z. Shvidenko, 2002: Forest carbon sinks in the Northern Hemisphere. Ecological Applications, 12(3), 891-899, doi: 10.2307/3060997.
Gurney, K. R., P. Romero-Lankao, K. C. Seto, L. R. Hutyra, R. Duren, C. Kennedy, N. B. Grimm, J. R. Ehleringer, P. Marcotullio, S. Hughes, S. Pincetl, M. V. Chester, D. M. Runfola, J. J. Feddema, and J. Sperling, 2015: Climate change: Track urban emissions on a human scale. Nature, 525(7568), 179-181, doi: 10.1038/525179a.
Gurney, K. R., R. M. Law, A. S. Denning, P. J. Rayner, D. Baker, P. Bousquet, L. Bruhwiler, Y. H. Chen, P. Ciais, S. Fan, I. Y. Fung, M. Gloor, M. Heimann, K. Higuchi, J. John, T. Maki, S. Maksyutov, K. Masarie, P. Peylin, M. Prather, B. C. Pak, J. Randerson, J. Sarmiento, S. Taguchi, T. Takahashi, and C. W. Yuen, 2002: Towards robust regional estimates of CO2 sources and sinks using atmospheric transport models. Nature, 415(6872), 626-630, doi: 10.1038/415626a.
Hartmann, H., H. D. Adams, W. R. Anderegg, S. Jansen, and M. J. Zeppel, 2015: Research frontiers in drought-induced tree mortality: Crossing scales and disciplines. New Phytologist, 205(3), 965-969, doi: 10.1111/nph.13246.
Hawbaker, T., and Z. Zhu, 2012: Projected future wildland fires and emissions for the Western United States. In: Baseline and Projected Future Carbon Storage and Greenhouse Gas Fluxes in Ecosystems of the Western United States. [Z. Zhu and B. Reed (eds.)]. U.S. Geological Survey Professional Paper 1797, 192 pp.
Hawbaker, T., and Z. Zhu, 2014: Wildland fire occurrence and emissions in the Eastern United States from 2001 through 2050. In: Baseline and Projected Future Carbon Storage and Greenhouse Gas Fluxes in Ecosystems of the Eastern United States. [Z. Zhu and B. Reed (eds.)]. U.S. Geological Survey Professional Paper 1804, 204 pp.
Hayes, D., and D. Turner, 2012: The need for “apples-to-apples” comparisons of carbon dioxide source and sink estimates. Eos, Transactions American Geophysical Union, 93(41), 404-405, doi: 10.1029/2012EO410007.
Hayes, D. J., A. D. McGuire, D. W. Kicklighter, K. R. Gurney, T. J. Burnside, and J. M. Melillo, 2011: Is the northern high-latitude land-based CO2 sink weakening? Global Biogeochemical Cycles, 25(3), doi: 10.1029/2010gb003813.
Hayes, D. J., D. W. Kicklighter, A. D. McGuire, M. Chen, Q. Zhuang, F. Yuan, J. M. Melillo, and S. D. Wullschleger, 2014: The impacts of recent permafrost thaw on land–atmosphere greenhouse gas exchange. Environmental Research Letters, 9(4), 045005, doi: 10.1088/1748-9326/9/4/045005.
Hayes, D. J., D. P. Turner, G. Stinson, A. D. McGuire, Y. Wei, T. O. West, L. S. Heath, B. Jong, B. G. McConkey, R. A. Birdsey, W. A. Kurz, A. R. Jacobson, D. N. Huntzinger, Y. Pan, W. M. Post, and R. B. Cook, 2012: Reconciling estimates of the contemporary North American carbon balance among terrestrial biosphere models, atmospheric inversions, and a new approach for estimating net ecosystem exchange from inventory-based data. Global Change Biology, 18(4), 1282-1299, doi: 10.1111/j.1365-2486.2011.02627.x.
Heath, L. S., J. E. Smith, K. E. Skog, D. J. Nowak, and C. W. Woodall, 2011: Managed forest carbon estimates for the US greenhouse gas inventory, 1990-2008. Journal of Forestry, 109(3), 167-173.
Hendrick, M. F., R. Ackley, B. Sanaie-Movahed, X. Tang, and N. G. Phillips, 2016: Fugitive methane emissions from leak-prone natural gas distribution infrastructure in urban environments. Environmental Pollution, 213, 710-716, doi: 10.1016/j.envpol.2016.01.094.
Houghton, R. A., 1999: The annual net flux of carbon to the atmosphere from changes in land use 1850–1990. Tellus B: Chemical and Physical Meteorology, 51(2), 298-313, doi: 10.3402/tellusb.v51i2.16288.
Houghton, R. A., 2003: Revised estimates of the annual net flux of carbon to the atmosphere from changes in land use and land management 1850-2000. Tellus B: Chemical and Physical Meteorology, 55(2), 378-390, doi: 10.1034/j.1600-0889.2003.01450.x.
Houghton, R. A., and J. L. Hackler, 2000: Changes in terrestrial carbon storage in the United States. 1: The roles of agriculture and forestry. Global Ecology and Biogeography, 9(2), 125-144, doi: 10.1046/j.1365-2699.2000.00166.x.
Huntzinger, D. N., A. M. Michalak, C. Schwalm, P. Ciais, A. W. King, Y. Fang, K. Schaefer, Y. Wei, R. B. Cook, J. B. Fisher, D. Hayes, M. Huang, A. Ito, A. K. Jain, H. Lei, C. Lu, F. Maignan, J. Mao, N. Parazoo, S. Peng, B. Poulter, D. Ricciuto, X. Shi, H. Tian, W. Wang, N. Zeng, and F. Zhao, 2017: Uncertainty in the response of terrestrial carbon sink to environmental drivers undermines carbon-climate feedback predictions. Science Reports, 7(1), 4765, doi: 10.1038/s41598-017-03818-2.
Huntzinger, D. N., W. M. Post, Y. Wei, A. M. Michalak, T. O. West, A. R. Jacobson, I. T. Baker, J. M. Chen, K. J. Davis, D. J. Hayes, F. M. Hoffman, A. K. Jain, S. Liu, A. D. McGuire, R. P. Neilson, C. Potter, B. Poulter, D. Price, B. M. Raczka, H. Q. Tian, P. Thornton, E. Tomelleri, N. Viovy, J. Xiao, W. Yuan, N. Zeng, M. Zhao, and R. Cook, 2012: North American Carbon Program (NACP) regional interim synthesis: Terrestrial biospheric model intercomparison. Ecological Modelling, 232, 144-157, doi: 10.1016/j.ecolmodel.2012.02.004.
Hurtt, G. C., S. W. Pacala, P. R. Moorcroft, J. Caspersen, E. Shevliakova, R. A. Houghton, and B. Moore, 3rd, 2002: Projecting the future of the U.S. carbon sink. Proceedings of the National Academy of Sciences USA, 99(3), 1389-1394, doi: 10.1073/pnas.012249999.
Hutyra, L. R., R. Duren, K. R. Gurney, N. Grimm, E. A. Kort, E. Larson, and G. Shrestha, 2014: Urbanization and the carbon cycle: Current capabilities and research outlook from the natural sciences perspective. Earth’s Future, 2(10), 473-495, doi: 10.1002/2014ef000255.
IEA, 2005: CO2 Emissions from Fuel Combustion, 1971–2003. Organisation for Economic Cooperation and Development and International Energy Agency. OECD Publishing, Paris, 506 pp. doi: 10.1787/co2_fuel-2005-en-fr.
INECC/SEMARNAT, 2015: First Biennial Update Report to the United Nations Framework Convention on Climate Change. Instituto Nacional de Ecologίa y Cambio Climático and Secretarίa de Medio Ambiente y Recursos Naturales, Mexico City.
Jung, M., M. Reichstein, and A. Bondeau, 2009: Towards global empirical upscaling of fluxnet eddy covariance observations: Validation of a model tree ensemble approach using a biosphere model. Biogeosciences, 6(10), 2001-2013, doi: 10.5194/bg-6-2001-2009.
King, A. W., D. J. Hayes, D. N. Huntzinger, T. O. West, and W. M. Post, 2012: North American carbon dioxide sources and sinks: Magnitude, attribution, and uncertainty. Frontiers in Ecology and the Environment, 10(10), 512-519, doi: 10.1890/120066.
King, A. W., R. J. Andres, K. J. Davis, M. Hafer, D. J. Hayes, D. N. Huntzinger, B. de Jong, W. A. Kurz, A. D. McGuire, R. Vargas, Y. Wei, T. O. West, and C. W. Woodall, 2015: North America’s net terrestrial CO2 exchange with the atmosphere 1990–2009. Biogeosciences, 12(2), 399-414, doi: 10.5194/bg-12-399-2015.
Kirschke, S., P. Bousquet, P. Ciais, M. Saunois, J. G. Canadell, E. J. Dlugokencky, P. Bergamaschi, D. Bergmann, D. R. Blake, L. Bruhwiler, P. Cameron-Smith, S. Castaldi, F. Chevallier, L. Feng, A. Fraser, M. Heimann, E. L. Hodson, S. Houweling, B. Josse, P. J. Fraser, P. B. Krummel, J.-F. Lamarque, R. L. Langenfelds, C. Le Quéré, V. Naik, S. O’Doherty, P. I. Palmer, I. Pison, D. Plummer, B. Poulter, R. G. Prinn, M. Rigby, B. Ringeval, M. Santini, M. Schmidt, D. T. Shindell, I. J. Simpson, R. Spahni, L. P. Steele, S. A. Strode, K. Sudo, S. Szopa, G. R. van der Werf, A. Voulgarakis, M. van Weele, R. F. Weiss, J. E. Williams, and G. Zeng, 2013: Three decades of global methane sources and sinks. Nature Geoscience, 6(10), 813-823, doi: 10.1038/ngeo1955.
Kurz, W. A., C. Smyth, and T. Lemprière, 2016: Climate change mitigation through forest sector activities: Principles, potential and priorities. Unasylva, 246(67), 61-67.
Kurz, W. A., C. H. Shaw, C. Boisvenue, G. Stinson, J. Metsaranta, D. Leckie, A. Dyk, C. Smyth, and E. T. Neilson, 2013: Carbon in Canada’s boreal forest — A synthesis. Environmental Reviews, 21(4), 260-292, doi: 10.1139/er-2013-0041.
Kurz, W. A., C. C. Dymond, T. M. White, G. Stinson, C. H. Shaw, G. J. Rampley, C. Smyth, B. N. Simpson, E. T. Neilson, J. A. Trofymow, J. Metsaranta, and M. J. Apps, 2009: CBM-CFS3: A model of carbon-dynamics in forestry and land-use change implementing IPCC standards. Ecological Modelling, 220(4), 480-504, doi: 10.1016/j.ecolmodel.2008.10.018.
Laruelle, G. G., R. Lauerwald, J. Rotschi, P. A. Raymond, J. Hartmann, and P. Regnier, 2015: Seasonal response of air–water CO2 exchange along the land–ocean aquatic continuum of the northeast North American coast. Biogeosciences, 12(5), 1447-1458, doi: 10.5194/bg-12-1447-2015.
Le Quéré, C., R. Moriarty, R. M. Andrew, G. P. Peters, P. Ciais, P. Friedlingstein, S. D. Jones, S. Sitch, P. Tans, A. Arneth, T. A. Boden, L. Bopp, Y. Bozec, J. G. Canadell, L. P. Chini, F. Chevallier, C. E. Cosca, I. Harris, M. Hoppema, R. A. Houghton, J. I. House, A. K. Jain, T. Johannessen, E. Kato, R. F. Keeling, V. Kitidis, K. Klein Goldewijk, C. Koven, C. S. Landa, P. Landschützer, A. Lenton, I. D. Lima, G. Marland, J. T. Mathis, N. Metzl, Y. Nojiri, A. Olsen, T. Ono, S. Peng, W. Peters, B. Pfeil, B. Poulter, M. R. Raupach, P. Regnier, C. Rödenbeck, S. Saito, J. E. Salisbury, U. Schuster, J. Schwinger, R. Séférian, J. Segschneider, T. Steinhoff, B. D. Stocker, A. J. Sutton, T. Takahashi, B. Tilbrook, G. R. van der Werf, N. Viovy, Y. P. Wang, R. Wanninkhof, A. Wiltshire, and N. Zeng, 2015: Global carbon budget 2014. Earth System Science Data, 7(1), 47-85, doi: 10.5194/essd-7-47-2015.
Le Quéré, C., R. M. Andrew, J. G. Canadell, S. Sitch, J. I. Korsbakken, G. P. Peters, A. C. Manning, T. A. Boden, P. P. Tans, R. A. Houghton, R. F. Keeling, S. Alin, O. D. Andrews, P. Anthoni, L. Barbero, L. Bopp, F. Chevallier, L. P. Chini, P. Ciais, K. Currie, C. Delire, S. C. Doney, P. Friedlingstein, T. Gkritzalis, I. Harris, J. Hauck, V. Haverd, M. Hoppema, K. Klein Goldewijk, A. K. Jain, E. Kato, A. Körtzinger, P. Landschützer, N. Lefèvre, A. Lenton, S. Lienert, D. Lombardozzi, J. R. Melton, N. Metzl, F. Millero, P. M. S. Monteiro, D. R. Munro, J. E. M. S. Nabel, S.-i. Nakaoka, amp, apos, K. Brien, A. Olsen, A. M. Omar, T. Ono, D. Pierrot, B. Poulter, C. Rödenbeck, J. Salisbury, U. Schuster, J. Schwinger, R. Séférian, I. Skjelvan, B. D. Stocker, A. J. Sutton, T. Takahashi, H. Tian, B. Tilbrook, I. T. van der Laan-Luijkx, G. R. van der Werf, N. Viovy, A. P. Walker, A. J. Wiltshire, and S. Zaehle, 2016: Global carbon budget 2016. Earth System Science Data, 8(2), 605-649, doi: 10.5194/essd-8-605-2016.
Le Quéré, C., R. M. Andrew, P. Friedlingstein, S. Sitch, J. Pongratz, A. C. Manning, J. I. Korsbakken, G. P. Peters, J. G. Canadell, R. B. Jackson, T. A. Boden, P. P. Tans, O. D. Andrews, V. K. Arora, D. C. E. Bakker, L. Barbero, M. Becker, R. A. Betts, L. Bopp, F. Chevallier, L. P. Chini, P. Ciais, C. E. Cosca, J. Cross, K. Currie, T. Gasser, I. Harris, J. Hauck, V. Haverd, R. A. Houghton, C. W. Hunt, G. Hurtt, T. Ilyina, A. K. Jain, E. Kato, M. Kautz, R. F. Keeling, K. Klein Goldewijk, A. Körtzinger, P. Landschützer, N. Lefèvre, A. Lenton, S. Lienert, I. Lima, D. Lombardozzi, N. Metzl, F. Millero, P. M. S. Monteiro, D. R. Munro, J. E. M. S. Nabel, S. I. Nakaoka, Y. Nojiri, X. A. Padin, A. Peregon, B. Pfeil, D. Pierrot, B. Poulter, G. Rehder, J. Reimer, C. Rödenbeck, J. Schwinger, R. Séférian, I. Skjelvan, B. D. Stocker, H. Tian, B. Tilbrook, F. N. Tubiello, I. T. van der Laan-Luijkx, G. R. van der Werf, S. van Heuven, N. Viovy, N. Vuichard, A. P. Walker, A. J. Watson, A. J. Wiltshire, S. Zaehle, and D. Zhu, 2018: Global Carbon Budget 2017. Earth System Science Data, 10(1), 405-448, doi: 10.5194/essd-10-405-2018.
Lemprière, T. C., W. A. Kurz, E. H. Hogg, C. Schmoll, G. J. Rampley, D. Yemshanov, D. W. McKenney, R. Gilsenan, A. Beatch, D. Blain, J. S. Bhatti, and E. Krcmar, 2013: Canadian boreal forests and climate change mitigation. Environmental Reviews, 21(4), 293-321, doi: 10.1139/er-2013-0039.
Liu, S., Y. Wu, C. Young, D. Dahal, J. L. Werner, J. Liu, Z. Li, Z. Tan, G. L. Schmidt, J. Oeding, T. L. Sohl, T. J. Hawbaker, and B. M. Sleeter, 2012: Projected future carbon storage and greenhouse-gas fluxes of terrestrial ecosystems in the Western United States. In: Baseline and Projected Future Carbon Storage and Greenhouse-Gas Fluxes in Ecosystems of the Western United States. [Z. Zhu and B. C. Reed (eds.)]. U.S. Geological Survey Professional Paper 1797, pp. 109-124. [URL]
Liu, S., J. Liu, Y. Wu, C. J. Young, J. M. Werner, D. Dahal, J. Oeding, and G. L. Schmidt, 2014: Baseline and projected future carbon storage, carbon sequestration, and greenhouse-gas fluxes in terrestrial ecosystems of the Eastern United States. In: Baseline and Projected Future Carbon Storage and Greenhouse Gas Fluxes in Ecosystems of the Eastern United States. [Z. Zhu and B. C. Reed (eds.)]. U.S. Geological Survey Professional Paper 1804, pp. 115-156. [URL]
Masek, J. G., D. J. Hayes, M. Joseph Hughes, S. P. Healey, and D. P. Turner, 2015: The role of remote sensing in process-scaling studies of managed forest ecosystems. Forest Ecology and Management, 355, 109-123, doi: 10.1016/j.foreco.2015.05.032.
Masera, O. R., M. J. Ordonez, and R. Dirzo, 1997: Carbon emissions from Mexican forests: Current situation and long-term scenarios. Climatic Change, 35(3), 265-295, doi: 10.1023/a:1005309908420.
McGuire, A. D., T. R. Christensen, D. Hayes, A. Heroult, E. Euskirchen, J. S. Kimball, C. Koven, P. Lafleur, P. A. Miller, W. Oechel, P. Peylin, M. Williams, and Y. Yi, 2012: An assessment of the carbon balance of Arctic tundra: Comparisons among observations, process models, and atmospheric inversions. Biogeosciences, 9(8), 3185-3204, doi: 10.5194/bg-9-3185-2012.
McGuire, A. D., S. Sitch, J. S. Clein, R. Dargaville, G. Esser, J. Foley, M. Heimann, F. Joos, J. Kaplan, D. W. Kicklighter, R. A. Meier, J. M. Melillo, B. Moore, I. C. Prentice, N. Ramankutty, T. Reichenau, A. Schloss, H. Tian, L. J. Williams, and U. Wittenberg, 2001: Carbon balance of the terrestrial biosphere in the Twentieth Century: Analyses of CO2, climate and land use effects with four process-based ecosystem models. Global Biogeochemical Cycles, 15(1), 183-206, doi: 10.1029/2000gb001298.
McGuire, A. D., C. Koven, D. M. Lawrence, J. S. Clein, J. Xia, C. Beer, E. Burke, G. Chen, X. Chen, C. Delire, E. Jafarov, A. H. MacDougall, S. Marchenko, D. Nicolsky, S. Peng, A. Rinke, K. Saito, W. Zhang, R. Alkama, T. J. Bohn, P. Ciais, B. Decharme, A. Ekici, I. Gouttevin, T. Hajima, D. J. Hayes, D. Ji, G. Krinner, D. P. Lettenmaier, Y. Luo, P. A. Miller, J. C. Moore, V. Romanovsky, C. Schädel, K. Schaefer, E. A. G. Schuur, B. Smith, T. Sueyoshi, and Q. Zhuang, 2016: Variability in the sensitivity among model simulations of permafrost and carbon dynamics in the permafrost region between 1960 and 2009. Global Biogeochemical Cycles, 30(7), 1015-1037, doi: 10.1002/2016gb005405.
McKain, K., A. Down, S. M. Raciti, J. Budney, L. R. Hutyra, C. Floerchinger, S. C. Herndon, T. Nehrkorn, M. S. Zahniser, R. B. Jackson, N. Phillips, and S. C. Wofsy, 2015: Methane emissions from natural gas infrastructure and use in the urban region of Boston, Massachusetts. Proceedings of the National Academy of Sciences USA, 112(7), 1941-1946, doi: 10.1073/pnas.1416261112.
McLeod, E., G. L. Chmura, S. Bouillon, R. Salm, M. Björk, C. M. Duarte, C. E. Lovelock, W. H. Schlesinger, and B. R. Silliman, 2011: A blueprint for blue carbon: Toward an improved understanding of the role of vegetated coastal habitats in sequestering CO2. Frontiers in Ecology and the Environment, 9(10), 552-560, doi: 10.1890/110004.
Miller, S. M., S. C. Wofsy, A. M. Michalak, E. A. Kort, A. E. Andrews, S. C. Biraud, E. J. Dlugokencky, J. Eluszkiewicz, M. L. Fischer, G. Janssens-Maenhout, B. R. Miller, J. B. Miller, S. A. Montzka, T. Nehrkorn, and C. Sweeney, 2013: Anthropogenic emissions of methane in the United States. Proceedings of the National Academy of Sciences USA, 110(50), 20018-20022, doi: 10.1073/pnas.1314392110.
Murray-Tortarolo, G., P. Friedlingstein, S. Sitch, V. J. Jaramillo, F. Murguía-Flores, A. Anav, Y. Liu, A. Arneth, A. Arvanitis, A. Harper, A. Jain, E. Kato, C. Koven, B. Poulter, B. D. Stocker, A. Wiltshire, S. Zaehle, and N. Zeng, 2016: The carbon cycle in Mexico: Past, present and future of C stocks and fluxes. Biogeosciences, 13(1), 223-238, doi: 10.5194/bg-13-223-2016.
Myhre, G., D. Shindell, F.-M. Bréon, W. Collins, J. Fuglestvedt, J. Huang, D. Koch, J.-F. Lamarque, D. Lee, B. Mendoza, T. Nakajima, A. Robock, G. Stephens, T. Takemura, and H. Zhang, 2013: Anthropogenic and natural radiative forcing. In: Climate Change 2013: The Physical Science Basis. Contribution of Working Group I to the Fifth Assessment Report of the Intergovernmental Panel on Climate Change. [T. F. Stocker, D. Qin, G.-K. Plattner, M. Tignor, S.K. Allen, J. Boschung, A. Nauels, Y. Xia, V. Bex, and P. M. Midgley (eds.)]. Cambridge University Press, Cambridge, UK, and New York, NY, USA, pp. 661-740.
NAS, 2018: Improving Characterization of Anthropogenic Methane Emissions in the United States. Washington, DC: The National Academies Press, Washington, DC, doi: 10.17226/24987.
NAS, 2010: Verifying Greenhouse Gas Emissions: Methods to Support International Climate Agreements. The National Academies Press, Washington, DsC. 124 pp.
Nisbet, E. G., E. J. Dlugokencky, M. R. Manning, D. Lowry, R. E. Fisher, J. L. France, S. E. Michel, J. B. Miller, J. W. C. White, B. Vaughn, P. Bousquet, J. A. Pyle, N. J. Warwick, M. Cain, R. Brownlow, G. Zazzeri, M. Lanoisellé, A. C. Manning, E. Gloor, D. E. J. Worthy, E. G. Brunke, C. Labuschagne, E. W. Wolff, and A. L. Ganesan, 2016: Rising atmospheric methane: 2007–2014 Growth and isotopic shift. Global Biogeochemical Cycles, 30(9), 1356-1370, doi: 10.1002/2016gb005406.
Norby, R. J., and D. R. Zak, 2011: Ecological lessons from Free-Air CO2 Enrichment (FACE) experiments. Annual Review of Ecology, Evolution, and Systematics, 42(1), 181-203, doi: 10.1146/annurev-ecolsys-102209-144647.
Pacala, S., R. A. Birdsey, S. D. Bridgham, R. T. Conant, K. Davis, B. Hales, R. A. Houghton, J. C. Jenkins, M. Johnston, G. Marland, and K. Paustian, 2007. The North American carbon budget past and present. In: First State of the Carbon Cycle Report (SOCCR): The North American carbon budget and implications for the global carbon cycle. A report by the U.S. Climate Change Science Program and the Subcommittee on Global Change Research. [A. W. King, L. Dilling, G.P. Zimmerman, D.M. Fairman, R.A. Houghton, G. Marland, A.Z. Rose, and T. J. Wilbanks (eds.)]. National Oceanic and Atmospheric Administration, National Climatic Data Center, Asheville, NC, USA, 29-36 pp.
Pacala, S. W., G. C. Hurtt, D. Baker, P. Peylin, R. A. Houghton, R. A. Birdsey, L. Heath, E. T. Sundquist, R. F. Stallard, P. Ciais, P. Moorcroft, J. P. Caspersen, E. Shevliakova, B. Moore, G. Kohlmaier, E. Holland, M. Gloor, M. E. Harmon, S. M. Fan, J. L. Sarmiento, C. L. Goodale, D. Schimel, and C. B. Field, 2001: Consistent land- and atmosphere-based U.S. Carbon sink estimates. Science, 292(5525), 2316-2320, doi: 10.1126/science.1057320.
Pan, Y., R. A. Birdsey, J. Fang, R. Houghton, P. E. Kauppi, W. A. Kurz, O. L. Phillips, A. Shvidenko, S. L. Lewis, J. G. Canadell, P. Ciais, R. B. Jackson, S. W. Pacala, A. D. McGuire, S. Piao, A. Rautiainen, S. Sitch, and D. Hayes, 2011: A large and persistent carbon sink in the world’s forests. Science, 333(6045), 988-993, doi: 10.1126/science.1201609.
Peters, W., A. R. Jacobson, C. Sweeney, A. E. Andrews, T. J. Conway, K. Masarie, J. B. Miller, L. M. Bruhwiler, G. Petron, A. I. Hirsch, D. E. Worthy, G. R. van der Werf, J. T. Randerson, P. O. Wennberg, M. C. Krol, and P. P. Tans, 2007: An atmospheric perspective on North American carbon dioxide exchange: CarbonTracker. Proceedings of the National Academy of Sciences USA, 104(48), 18925-18930, doi: 10.1073/pnas.0708986104.
Petrescu, A. M. R., L. P. H. van Beek, J. van Huissteden, C. Prigent, T. Sachs, C. A. R. Corradi, F. J. W. Parmentier, and A. J. Dolman, 2010: Modeling regional to global CH4 emissions of boreal and Arctic wetlands. Global Biogeochemical Cycles, 24(4), doi: 10.1029/2009gb003610.
Poulter, B., D. Frank, P. Ciais, R. B. Myneni, N. Andela, J. Bi, G. Broquet, J. G. Canadell, F. Chevallier, Y. Y. Liu, S. W. Running, S. Sitch, and G. R. van der Werf, 2014: Contribution of semi-arid ecosystems to interannual variability of the global carbon cycle. Nature, 509(7502), 600-603, doi: 10.1038/nature13376.
Rayner, P. J., M. R. Raupach, M. Paget, P. Peylin, and E. Koffi, 2010: A new global gridded data set of CO2 emissions from fossil fuel combustion: Methodology and evaluation. Journal of Geophysical Research: Atmospheres, 115(D19), doi: 10.1029/2009JD013439.
Reimer, J. J., R. Vargas, S. V. Smith, R. Lara-Lara, G. Gaxiola-Castro, J. Martín Hernández-Ayón, A. Castro, M. Escoto-Rodriguez, and J. Martínez-Osuna, 2013: Air-sea CO2 fluxes in the near-shore and intertidal zones influenced by the California current. Journal of Geophysical Research: Oceans, 118(10), 4795-4810, doi: 10.1002/jgrc.20319.
Rigby, M., R. G. Prinn, P. J. Fraser, P. G. Simmonds, R. L. Langenfelds, J. Huang, D. M. Cunnold, L. P. Steele, P. B. Krummel, R. F. Weiss, S. O’Doherty, P. K. Salameh, H. J. Wang, C. M. Harth, J. Mühle, and L. W. Porter, 2008: Renewed growth of atmospheric methane. Geophysical Research Letters, 35(22), doi: 10.1029/2008gl036037.
Saunois, M., P. Bousquet, B. Poulter, A. Peregon, P. Ciais, J. G. Canadell, E. J. Dlugokencky, G. Etiope, D. Bastviken, S. Houweling, G. Janssens-Maenhout, F. N. Tubiello, S. Castaldi, R. B. Jackson, M. Alexe, V. K. Arora, D. J. Beerling, P. Bergamaschi, D. R. Blake, G. Brailsford, V. Brovkin, L. Bruhwiler, C. Crevoisier, P. Crill, K. Covey, C. Curry, C. Frankenberg, N. Gedney, L. Höglund-Isaksson, M. Ishizawa, A. Ito, F. Joos, H.-S. Kim, T. Kleinen, P. Krummel, J.-F. Lamarque, R. Langenfelds, R. Locatelli, T. Machida, S. Maksyutov, K. C. McDonald, J. Marshall, J. R. Melton, I. Morino, V. Naik, S. Doherty, F.-J. W. Parmentier, P. K. Patra, C. Peng, S. Peng, G. P. Peters, I. Pison, C. Prigent, R. Prinn, M. Ramonet, W. J. Riley, M. Saito, M. Santini, R. Schroeder, I. J. Simpson, R. Spahni, P. Steele, A. Takizawa, B. F. Thornton, H. Tian, Y. Tohjima, N. Viovy, A. Voulgarakis, M. van Weele, G. R. van der Werf, R. Weiss, C. Wiedinmyer, D. J. Wilton, A. Wiltshire, D. Worthy, D. Wunch, X. Xu, Y. Yoshida, B. Zhang, Z. Zhang, and Q. Zhu, 2016: The global methane budget 2000–2012. Earth System Science Data, 8(2), 697-751, doi: 10.5194/essd-8-697-2016.
Schaefer, H., S. E. Mikaloff Fletcher, C. Veidt, K. R. Lassey, G. W. Brailsford, T. M. Bromley, E. J. Dlugokencky, S. E. Michel, J. B. Miller, I. Levin, D. C. Lowe, R. J. Martin, B. H. Vaughn, and J. W. White, 2016: A 21st-century shift from fossil-fuel to biogenic methane emissions indicated by 13CH4. Science, 352(6281), 80-84, doi: 10.1126/science.aad2705.
Schuh, A. E., T. Lauvaux, T. O. West, A. S. Denning, K. J. Davis, N. Miles, S. Richardson, M. Uliasz, E. Lokupitiya, D. Cooley, and A. Andrews, 2013: Evaluating atmospheric CO2 inversions at multiple scales over a highly inventoried agricultural landscape. Global Change Biology, 19(5), 1424-1439.
Schuur, E. A. G., A. D. McGuire, C. Schädel, G. Grosse, J. W. Harden, D. J. Hayes, G. Hugelius, C. D. Koven, P. Kuhry, D. M. Lawrence, S. M. Natali, D. Olefeldt, V. E. Romanovsky, K. Schaefer, M. R. Turetsky, C. C. Treat, and J. E. Vonk, 2015: Climate change and the permafrost carbon feedback. Nature, 520(7546), 171-179, doi: 10.1038/nature14338.
Schwalm, C.R., C.A. Williams, K. Schaefer, D. Baldocchi, T.A. Black, A.H. Goldstein, B.E. Law, W.C. Oechel, and R.L. Scott, 2012: Reduction in carbon uptake during turn of the century drought in western North America. Nature Geoscience, 5(8), 551.
Schwalm, C. R., C. A. Williams, K. Schaefer, R. Anderson, M. A. Arain, I. Baker, A. Barr, T. A. Black, G. Chen, J. M. Chen, P. Ciais, K. J. Davis, A. Desai, M. Dietze, D. Dragoni, M. L. Fischer, L. B. Flanagan, R. Grant, L. Gu, D. Hollinger, R. C. Izaurralde, C. Kucharik, P. Lafleur, B. E. Law, L. Li, Z. Li, S. Liu, E. Lokupitiya, Y. Luo, S. Ma, H. Margolis, R. Matamala, H. McCaughey, R. K. Monson, W. C. Oechel, C. Peng, B. Poulter, D. T. Price, D. M. Riciutto, W. Riley, A. K. Sahoo, M. Sprintsin, J. Sun, H. Tian, C. Tonitto, H. Verbeeck, and S. B. Verma, 2010: A model-data intercomparison of CO2 exchange across North America: Results from the North American carbon program site synthesis. Journal of Geophysical Research, 115, G00H05, p. 22, doi: 10.1029/2009jg001229.
Sheng, J.-X., D. J. Jacob, J. D. Maasakkers, M. P. Sulprizio, D. Zavala-Araiza, and S. P. Hamburg, 2017: A high-resolution (0.1° × 0.1°) inventory of methane emissions from Canadian and Mexican oil and gas systems. Atmospheric Environment, 158, 211-215, doi: 10.1016/j.atmosenv.2017.02.036.
Smith, J. E., L. S. Heath, and M. C. Nichols, 2010: U.S. Forest Carbon Calculation Tool: Forestland Carbon Stocks and Net Annual Stock Change. Revised for use with FIADB4.0. USDA Forest Service Northern Research Station. NRS GTR-13.
Stephens, B. B., K. R. Gurney, P. P. Tans, C. Sweeney, W. Peters, L. Bruhwiler, P. Ciais, M. Ramonet, P. Bousquet, T. Nakazawa, S. Aoki, T. Machida, G. Inoue, N. Vinnichenko, J. Lloyd, A. Jordan, M. Heimann, O. Shibistova, R. L. Langenfelds, L. P. Steele, R. J. Francey, and A. S. Denning, 2007: Weak northern and strong tropical land carbon uptake from vertical profiles of atmospheric CO2. Science, 316(5832), 1732-1735, doi: 10.1126/science.1137004.
Stinson, G., W. A. Kurz, C. E. Smyth, E. T. Neilson, C. C. Dymond, J. M. Metsaranta, C. Boisvenue, G. J. Rampley, Q. Li, T. M. White, and D. Blain, 2011: An inventory-based analysis of Canada’s managed forest carbon dynamics, 1990 to 2008. Global Change Biology, 17(6), 2227-2244, doi: 10.1111/j.1365-2486.2010.02369.x.
Sweeney, C., E. Dlugokencky, C. E. Miller, S. Wofsy, A. Karion, S. Dinardo, R. Y. W. Chang, J. B. Miller, L. Bruhwiler, A. M. Crotwell, T. Newberger, K. McKain, R. S. Stone, S. E. Wolter, P. E. Lang, and P. Tans, 2016: No significant increase in long-term CH4 emissions on North Slope of Alaska despite significant increase in air temperature. Geophysical Research Letters, 43(12), 6604-6611, doi: 10.1002/2016GL069292.
Tarnocai, C., C.-L. Ping, and J. Kimble, 2007: Carbon cycles in the permafrost region of North America. In: First State of the Carbon Cycle Report (SOCCR): The North American carbon budget and implications for the global carbon cycle. A report by the U.S. Climate Change Science Program and the Subcommittee on Global Change Research. [A. W. King, L. Dilling, G.P. Zimmerman, D.M. Fairman, R.A. Houghton, G. Marland, A. Z. Rose, and T. J. Wilbanks (eds.)]. National Oceanic and Atmospheric Administration, National Climatic Data Center, Asheville, NC, USA, pp. 127-138.
Tarnocai, C., J. G. Canadell, E. A. G. Schuur, P. Kuhry, G. Mazhitova, and S. Zimov, 2009: Soil organic carbon pools in the northern circumpolar permafrost region. Global Biogeochemical Cycles, 23(2), doi: 10.1029/2008GB003327.
Tian, H., G. Chen, C. Lu, X. Xu, D. J. Hayes, W. Ren, S. Pan, D. N. Huntzinger, and S. C. Wofsy, 2015: North American terrestrial CO2 uptake largely offset by CH4 and N2O emissions: Toward a full accounting of the greenhouse gas budget. Climatic Change, 129(3-4), 413-426, doi: 10.1007/s10584-014-1072-9.
Tian, H., C. Lu, P. Ciais, A. M. Michalak, J. G. Canadell, E. Saikawa, D. N. Huntzinger, K. R. Gurney, S. Sitch, B. Zhang, J. Yang, P. Bousquet, L. Bruhwiler, G. Chen, E. Dlugokencky, P. Friedlingstein, J. Melillo, S. Pan, B. Poulter, R. Prinn, M. Saunois, C. R. Schwalm, and S. C. Wofsy, 2016: The terrestrial biosphere as a net source of greenhouse gases to the atmosphere. Nature, 531(7593), 225-228, doi: 10.1038/nature16946.
Turetsky, M. R., B. Benscoter, S. Page, G. Rein, G. R. van der Werf, and A. Watts, 2014: Global vulnerability of peatlands to fire and carbon loss. Nature Geoscience, 8(1), 11-14, doi: 10.1038/ngeo2325.
Turner, A. J., D. J. Jacob, J. Benmergui, S. C. Wofsy, J. D. Maasakkers, A. Butz, O. Hasekamp, and S. C. Biraud, 2016a: A large increase in U.S. Methane emissions over the past decade inferred from satellite data and surface observations. Geophysical Research Letters, 43(5), 2218-2224, doi: 10.1002/2016GL067987.
Turner, D. P., W. D. Ritts, R. E. Kennedy, A. N. Gray, and Z. Q. Yang, 2016b: Regional carbon cycle responses to 25 years of variation in climate and disturbance in the U.S. Pacific Northwest. Regional Environmental Change, 16(8), 2345-2355, doi: 10.1007/s10113-016-0956-9.
Turner, D. P., M. Göckede, B. E. Law, W. D. Ritts, W. B. Cohen, Z. Yang, T. Hudiburg, R. Kennedy, and M. Duane, 2011: Multiple constraint analysis of regional land-surface carbon flux. Tellus B: Chemical and Physical Meteorology, 63(2), 207-221, doi: 10.1111/j.1600-0889.2011.00525.x.
Vargas, R., H. W. Loescher, T. Arredondo, E. Huber-Sannwald, R. Lara-Lara, and E. A. Yépez, 2012: Opportunities for advancing carbon cycle science in Mexico: Toward a continental scale understanding. Environmental Science & Policy, 21, 84-93, doi: 10.1016/j.envsci.2012.04.003.
Vargas, R., D. Alcaraz-Segura, R. Birdsey, N. A. Brunsell, C. O. Cruz-Gaistardo, B. de Jong, J. Etchevers, M. Guevara, D. J. Hayes, K. Johnson, H. W. Loescher, F. Paz, Y. Ryu, Z. Sanchez-Mejia, and K. P. Toledo-Gutierrez, 2017: Enhancing interoperability to facilitate implementation of REDD+: Case study of Mexico. Carbon Management, 8(1), 57-65, doi: 10.1080/17583004.2017.1285177.
Warner, D. L., S. Villarreal, K. McWilliams, S. Inamdar, and R. Vargas, 2017: Carbon dioxide and methane fluxes from tree stems, coarse woody debris, and soils in an upland temperate forest. Ecosystems, 20(6), 1205-1216, doi: 10.1007/s10021-016-0106-8.
Wei, Y., D. J. Hayes, M. M. Thornton, W. M. Post, R. B. Cook, P. E. Thornton, A. Jacobson, D. N. Huntzinger, T. O. West, L. S. Heath, B. McConkey, G. Stinson, W. Kurz, B. de Jong, I. Baker, J. Chen, F. Chevallier, F. Hoffman, A. Jain, R. Lokupitiya, D. A. McGuire, A. Michalak, G. G. Moisen, R. P. Neilson, P. Peylin, C. Potter, B. Poulter, D. Price, J. Randerson, C. Rodenbeck, H. Tian, E. Tomelleri, G. van der Werf, N. Viovy, J. Xiao, N. Zeng, and M. Zhao, 2013: NACP Regional: National Greenhouse Gas Inventories and Aggregated Gridded Model Data. Oak Ridge National Laboratory Distributed Active Archive Center. [URL]
West, T. O., C. C. Brandt, L. M. Baskaran, C. M. Hellwinckel, R. Mueller, C. J. Bernacchi, V. Bandaru, B. Yang, B. S. Wilson, G. Marland, R. G. Nelson, D. G. D. L. T. Ugarte, and W. M. Post, 2010: Cropland carbon fluxes in the United States: Increasing geospatial resolution of inventory-based carbon accounting. Ecological Applications, 20(4), 1074-1086, doi: 10.1890/08-2352.1.
Williams, C. A., G. J. Collatz, J. Masek, and S. N. Goward, 2012: Carbon consequences of forest disturbance and recovery across the conterminous United States. Global Biogeochemical Cycles, 26(1), doi: 10.1029/2010gb003947.
Williams, C. A., G. J. Collatz, J. Masek, C. Q. Huang, and S. N. Goward, 2014: Impacts of disturbance history on forest carbon stocks and fluxes: Merging satellite disturbance mapping with forest inventory data in a carbon cycle model framework. Remote Sensing of Environment, 151, 57-71, doi: 10.1016/j.rse.2013.10.034.
Wofsy, S. C., R. C. Harriss, and W. A. Kaplan, 1988: Carbon dioxide in the atmosphere over the Amazon Basin. Journal of Geophysical Research, 93(D2), 1377, doi: 10.1029/JD093iD02p01377.
Woodall, C. W., G. M. Domke, J. E. Smith, and J. W. Coulston, 2016: Forest land category sections of the land use, land use change, and forestry chapter, and annex. In: Inventory of U.S. Greenhouse Gas Emissions and Sinks: 1990-2014. EPA 430-R-16-002, U.S. Environmental Protection Agency.
Woodall, C. W., J. W. Coulston, G. M. Domke, B. F. Walters, D. N. Wear, J. E. Smith, H. E. Andersen, B. J. Clough, W. B. Cohen, D. M. Griffith, and Hagen, S. C., 2015: The US Forest Carbon Accounting Framework: Stocks and Stock Change 1990-2016, 49 pp.
Xiao, J., S. V. Ollinger, S. Frolking, G. C. Hurtt, D. Y. Hollinger, K. J. Davis, Y. Pan, X. Zhang, F. Deng, J. Chen, D. D. Baldocchi, B. E. Law, M. A. Arain, A. R. Desai, A. D. Richardson, G. Sun, B. Amiro, H. Margolis, L. Gu, R. L. Scott, P. D. Blanken, and A. E. Suyker, 2014: Data-driven diagnostics of terrestrial carbon dynamics over North America. Agricultural and Forest Meteorology, 197, 142-157, doi: 10.1016/j.agrformet.2014.06.013.
Zhou, D., S. Liu, J. Oeding, and S. Zhao, 2013: Forest cutting and impacts on carbon in the Eastern United States. Scientific Reports, 3, 3547, doi: 10.1038/srep03547.
Zhu, Z., and B. Reed, 2012: Baseline and Projected Future Carbon Storage and Greenhouse-Gas Fluxes in Ecosystems of the Western United States. U.S. Geological Survey Professional Paper 1797, 192 pp.
Zhu, Z., and B. C. Reed, 2014: Baseline and Projected Future Carbon Storage and Greenhouse-Gas Fluxes in Ecosystems of the Eastern United States. U.S. Geological Survey Professional Paper 1804, 204 pp.
Zhu, Z., M. Bouchard, and D. Butman, 2011: Baseline and Projected Future Carbon Storage and Greenhouse-Gas Fluxes in the Great Plains Region of the United States. U.S. Geological Survey Professional Paper 1787, 28 pp.
Carbon dioxide equivalent (CO2e): Amount of CO2 that would produce the same effect on the radiative balance of Earth’s climate system as another greenhouse gas, such as methane (CH4) or nitrous oxide (N2O), on a 100-year timescale. For comparison to units of carbon, each kg CO2e is equivalent to 0.273 kg C (0.273 = 1/3.67). See Preface for details.↩