NCA4 Emissions Estimates
  • ABOUT
    Preface Executive Summary Report Credits
  • CHAPTERS

    Front Matter

    • Highlights
    • Preface
    • Executive Summary

    Synthesis 

    1. Overview
    2. The North American Carbon Budget

    Human Dimensions of the Carbon Cycle 

    1. Energy Systems
    2. Understanding Urban Carbon Fluxes
    3. Agriculture
    4. Social Science Perspectives on Carbon
    5. Tribal Lands

    State of Air, Land and Water 

    1. Observations of Atmospheric CO2 and Methane
    2. Forests
    3. Grasslands
    4. Arctic and Boreal Carbon
    5. Soils
    6. Terrestial Wetlands
    7. Inland Waters
    8. Tidal Wetlands and Estuaries
    9. Coastal Oceans and Continental Shelves

    Consequences and Ways Forward 

    1. Biogeochemical Effects of Rising Atmospheric CO2
    2. Carbon Cycle Science in Support of Decision Making
    3. Future of the North American Carbon Cycle

    Appendices

    1. Report Development Process
    2. Information Quality in the Assessment
    3. Selected Carbon Cycle Research Observations and Measurement Programs
    4. Carbon Measurement Approaches and Account Frameworks
    5. Fossil Fuel Emissions Estimates for North America
    6. Acronyms, Abbreviations and Units
    7. Glossary
  • DOWNLOADS
    View All Report Downloads Full Chapter PDF Chapter Figures (.zip) Chapter Bibliography (RIS)
Emissions Estimates
×

SECOND STATE OF THE CARBON CYCLE REPORT

FOSSIL FUEL EMISSIONS ESTIMATES FOR NORTH AMERICA

  • SECTIONS
  • Introduction
  • Emissions Estimates Considered
  • Time Series of North American Emissions, 2004 to 2013
  • References

APPENDIX
Fossil Fuel Emissions Estimates for North America

Introduction

Authors:
Andrew R. Jacobson, University of Colorado, Boulder, and NOAA Earth System Research Laboratory
John B. Miller, NOAA Earth System Research Laboratory
Kevin Robert Gurney, Northern Arizona University

<b>Jacobson</b>, A. R., J. B. <b>Miller</b>, and K. R. <b>Gurney</b>, 2018: Appendix E. Fossil fuel emissions estimates for North America. In Second State of the Carbon Cycle Report (SOCCR2): A Sustained Assessment Report [Cavallaro, N., G. Shrestha, R. Birdsey, M. A. Mayes, R. G. Najjar, S. C. Reed, P. Romero-Lankao, and Z. Zhu (eds.)]. U.S. Global Change Research Program, Washington, DC, USA, pp. 839-843, doi: https://doi.org/10.7930/SOCCR2.2018.AppE.

Anthropogenic carbon dioxide (CO2) emissions from fossil fuel sources, while dominated by direct combustion for heating and energy production, can be defined to include a diverse set of industrial and agricultural processes. These include CO2 production from cement manufacturing, gas and oil flaring, fugitive emissions, nonfuel oxidation of hydrocarbons, solid waste combustion, soil emissions, and geothermal power production. There are two general classes of global inventories: 1) those defined geographically at the nation-state scale and 2) those that generate estimates at the regular grid-cell scale (e.g., 10 km, 1 degree). The latter often are derived from the former via downscaling techniques but also may use “bottom-up” data such as emissions estimates and coordinates for power plants or airports. The available (nation-state or gridded) inventories, detailed in this appendix, cover these sectors in differing ways that cannot be reconciled directly to a common basis. In addition to their varying sectoral coverage, methodological differences among the inventories can lead to additional sources of difference (Macknick 2014). Some of the inventories are based on fuel sales, and others on activities such as number of road miles driven. The First State of the Carbon Cycle Report (SOCCR1) “Part II Overview” chapter (Marland et al., 2007) provides a relevant discussion of different products and methodologies.

The varying sectoral definitions, resolutions, and methodological differences make direct comparisons challenging. For example, it is sometimes unclear whether country totals from different products include fuel usage for international marine and air transport (bunker fuels). However, the difficulties reconciling the definitions used by different products can be informative of practical uncertainty when used within atmospheric inversions or budget studies.

Emissions Estimates Considered

  1. U.S. Department of Energy Carbon Dioxide Information Analysis Center (CDIAC) Version 2017 (Boden et al., 2017) for 1751 to 2014. Emissions included in this database are those due to fossil fuel consumption (e.g., oil, coal, and natural gas), gas flaring, and cement production. Emissions are listed by country and fuel type; bunker fuels are available separately but not included in the country totals.

  2. U.S. Energy Information Administration (EIA 2017) for 1980 to 2015. CO2 emissions from the consumption of energy, including emissions resulting from the consumption of petroleum, natural gas, and coal, as well as from natural gas flaring. Emissions are computed from consumption statistics for each fuel type by applying emissions factors. Data include nonfuel use of petroleum such as asphalt for street paving and exclude emissions from geothermal power generation, cement production and other industrial processes, or municipal solid waste combustion.

  3. Fossil Fuel Data Assimilation System (FFDAS) Version 2 (Rayner et al., 2010; Asefi-Najafabady et al., 2014) for 1997 to 2012. Emissions other than power production (which use a pointwise bottom-up dataset) are estimated using data assimilation to constrain a modified Kaya identity model. The two observed fields are space-based nightlights and population density. Country totals are then created by aggregating gridded emissions using Lloyd et al. (2016, 2017) gridded country boundaries based on the Database of Global Administrative Areas, called GADM. Version 2 of FFDAS produces estimates for electricity-production, industrial, residential, commercial, and transportation (other than domestic aviation and domestic waterborne) sectors and includes a posterior uncertainty as produced by the assimilation system and prior uncertainty estimates. These map closely to the Intergovernmental Panel on Climate Change (IPCC) 1A fuel consumption category (excepting 1A3a, civil aviation, and 1A3d, navigation).

  4. Emissions Database for Global Atmospheric Research (EDGAR) Version 4.3.2 ( Janssens-Maenhout et al., 2017a) for 1970 to 2012. Total used of all emissions listed in “CO2_excl_short-cycle_org_C” from version 4.3.2, which includes IPCC categories (see Table E.1, for a partial list).

  5. Emissions Database for Global Atmospheric Research Fast Track (EDGAR FT) EDGAR Version 4.3.2 FT2016 ( Janssens-Maenhout et al., 2017b; Olivier et al., 2017) for 1970 to 2016. Sectoral coverage is described as “Transport, Other Industrial Combustion, Buildings, Noncombustion, Power Industry.” For unknown reasons, EDGAR FT and the standard EDGAR emissions do not agree during their common years (i.e., 2012 and before).

Table E.1. Intergovernmental Panel on Climate Change (IPCC) Source/Sink Codes and Categories

Code Category
1A1a Public electricity and heat production
1A1bc Other energy industries
1A2 Manufacturing industries and construction
1A3a Domestic aviation
1A3b Road transportation
1A3c Rail transportation
1A3d Inland navigation
1A3e Other transportation
1A4 Residential and other sectors
1B1 Fugitive emissions from solid fuels
1B2 Fugitive emissions from oil and natural gas
2A1 Cement production
2A2 Lime production
2A3 Limestone and dolomite use
2A4 Soda ash production and use
2A7 Production of other minerals
2B Production of chemicals
2C Production of metals
2G Nonenergy use of lubricants/waxes (carbon dioxide)
3A Solvent and other product use: paint
3B Solvent and other product use: degrease
3C Solvent and other product use: chemicals
3D Solvent and other product use: other
4D4 Other direct soil emissions
6C Waste incineration
7A Fossil fuel fires

Time Series of North American Emissions, 2004 to 2013

The CDIAC time series was chosen to represent fossil fuel emissions from Canada, the United States, and Mexico from 2004 to 2013. In part, this is due to CDIAC’s long historical coverage for all three countries and its clear definition of what goes into the country totals (e.g., Marland et al., 2007). Assigning an uncertainty to the CDIAC time series is a challenge. Andres et al. (2014) discuss various ways to characterize the uncertainty of the CDIAC product and suggest that a time-average uncertainty for the United States could be about 4% (2 standard deviations).

SOCCR1 (Marland et al., 2007; p. 59) suggests ±5% for developed countries, concordant with Interna- tional Energy Agency (IEA 2005; Marland et al., 2007) intercomparisons for developed countries (also 5%). Here, the fractional range of the five inventories listed previously is used, averaged over time, to represent the uncertainty. Note that some of these differences are driven by categorical differences in what is included, or not included, in the global inventories. The CDIAC time series is recognized as different from the mean of the five invento- ries. Results are shown in Table E.2 and Table E.3, this page, and Figure E.1, p. 842.


Figure A5.1: Fossil Fuel Carbon Dioxide Emissions

Figure A5.1: (Left column) Data are from Canada, the United States, Mexico, and their total for North America, plotted between 2004 and 2013. (Right column) Graphs show the range of the estimates expressed as a percentage of the Carbon Dioxide Information Analysis Center (CDIAC) estimate for each year. Key: FF, fossil fuels; Tg C, teragrams of carbon; USA, United States (conterminous); EDGAR FT, Emissions Database for Global Atmospheric Research Fast Track; EIA, U.S. Energy Information Administration; FFDAS, Fossil Fuel Data Assimilation System.

SHRINK

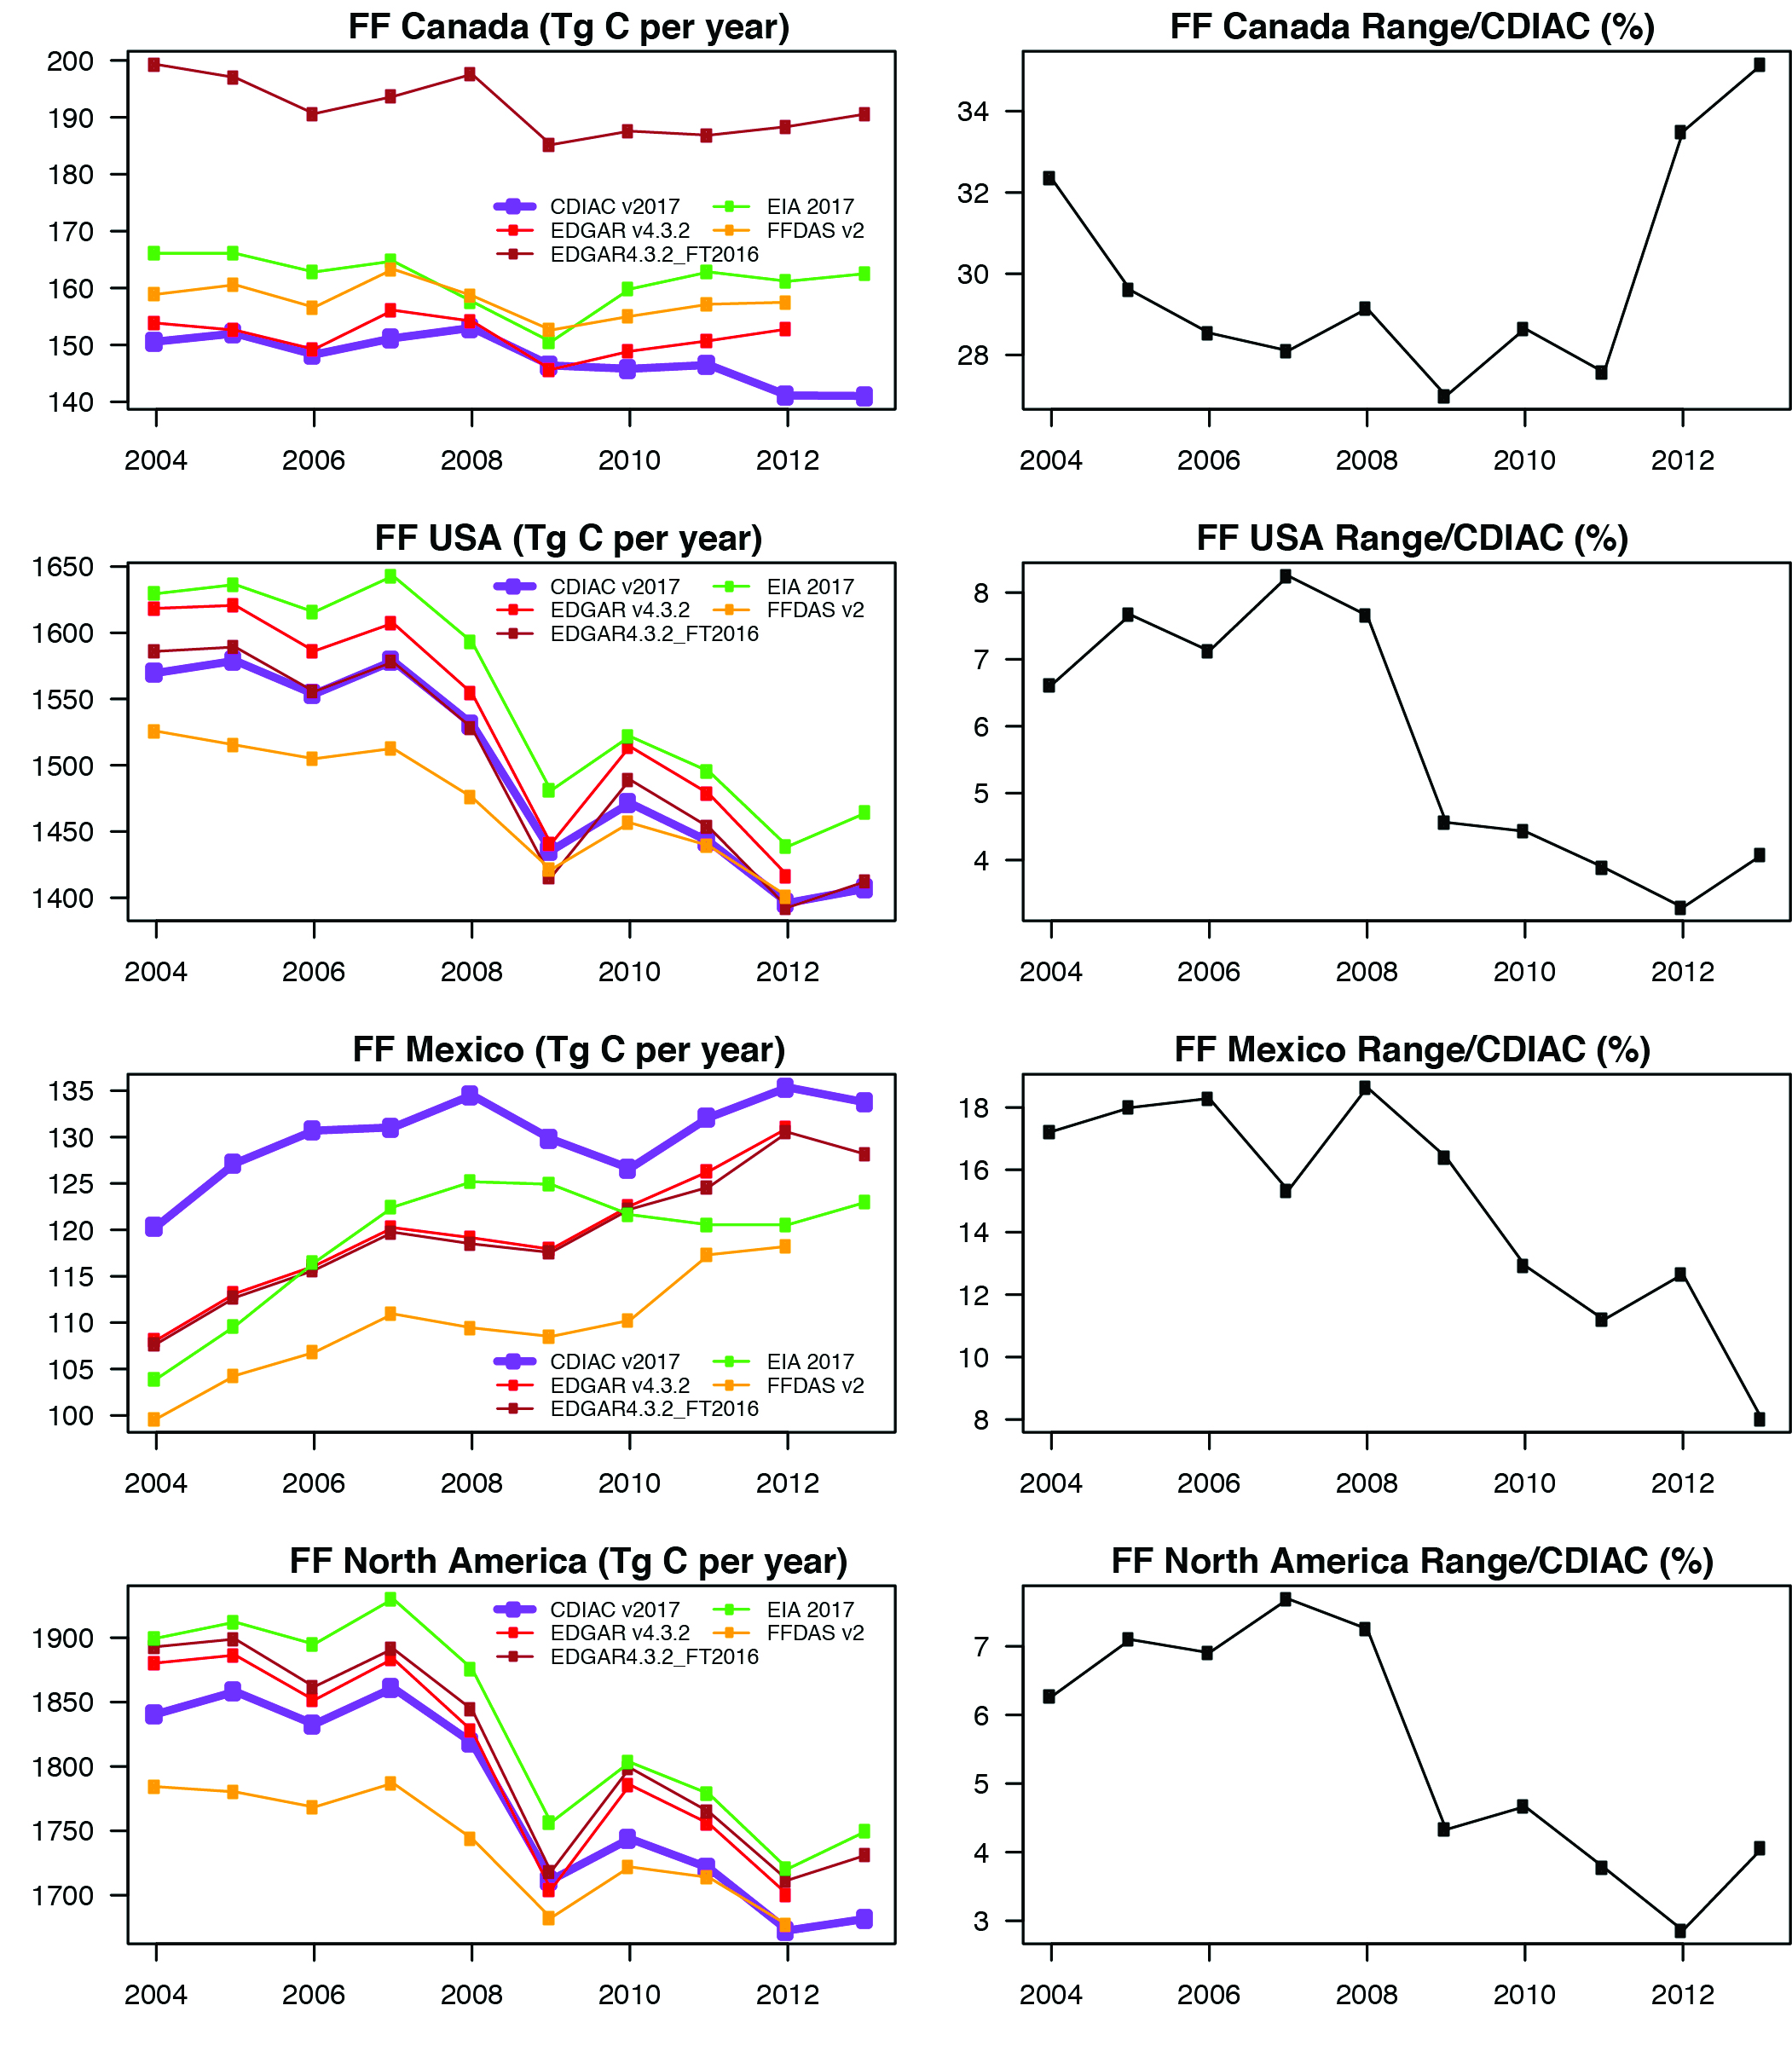
Table E.2. North American Fossil Fuel Carbon Dioxide Emissionsa

Year Canada United States Mexico North America
2004 150.6 1569.7 120.3 1840.6
2005 152.0 1578.9 127.2 1858.1
2006 148.3 1553.7 130.7 1832.7
2007 151.2 1578.7 131.0 1860.9
2008 153.0 1531.0 134.5 1818.5
2009 146.4 1435.4 129.8 1711.5
2010 145.8 1471.4 126.6 1743.8
2011 146.5 1442.5 132.1 1721.1
2012 141.1 1396.1 135.3 1672.5
2013 141.0 1406.9 133.7 1681.7

Notes
aFossil fuel emissions in teragrams of carbon (Tg C) per year from the Carbon Dioxide Information Analysis Center (Boden et al., 2017; see Section E.2).

Table E.3. Summary Statistics on North American Fossil Fuel Carbon Dioxide Emissionsa

Quantity Canada United States Mexico North America
2004–2013 CDIACb mean 147.6 1496.4 130.1 1774.1
CDIAC interannual variability (standard error of mean) 1.3 23.3 1.4 23.8
Time mean (2004–2013) of the range of the five emissions inventories in Section E.2 divided by CDIAC (percent) 30.0 5.8 14.9 5.5<

Notes
aEmissions measured in teragrams of carbon (Tg C) per year.
bCDIAC, Carbon Dioxide Information Analysis Center.

References

Andres, R. J., T. A. Boden, and D. Higdon, 2014: A new evaluation of the uncertainty associated with CDIAC estimates of fossil fuel carbon dioxide emission. Tellus B: Chemical and Physical Meteorology, 66(1), 23616, doi: 10.3402/tellusb.v66.23616.

Asefi-Najafabady, S., P. J. Rayner, K. R. Gurney, A. McRobert, Y. Song, K. Coltin, J. Huang, C. Elvidge, and K. Baugh, 2014: A multiyear, global gridded fossil fuel CO2 emission data product: Evaluation and analysis of results. Journal of Geophysical Research: Atmospheres, 119(17), 10,213-210,231, doi: 10.1002/2013jd021296.

Boden, T. A., G. Marland, and R. J. Andres, 2017: Global, Regional, and National Fossil-Fuel CO2 Emissions. Carbon Dioxide Information Analysis Center, U.S. Department of Energy, Oak Ridge National Laboratory, Oak Ridge, TN, USA, doi: 10.3334/CDIAC/00001_V2017. [URL]

EIA, 2017: International Data. U.S. Energy Information Administration. [URL]

IEA, 2005: CO2 Emissions from Fuel Combustion, 1971–2003. Organisation for Economic Cooperation and Development and International Energy Agency. OECD Publishing, Paris, 506 pp. doi: 10.1787/co2_fuel-2005-en-fr.

Janssens-Maenhout, G., M. Crippa, D. Guizzardi, M. Muntean, E. Schaaf, J. Olivier, J. Peters, and K. Schure, 2017a: Fossil CO2 and GHG Emissions of All World Countries. EU Publications.

Janssens-Maenhout, G., M. Crippa, D. Guizzardi, M. Muntean, E. Schaaf, F. Dentener, P. Bergamaschi, V. Pagliari, J. G. J. Olivier, J. A. H. W. Peters, J. A. van Aardenne, S. Monni, U. Doering, and A. M. R. Petrescu, 2017b: EDGAR v4.3.2 Global atlas of the three major greenhouse gas emissions for the period 1970–2012. Earth System Science Data Discussions, 1-55, doi: 10.5194/essd-2017-79.

Lloyd, C., 2016: WorldPop Archive global gridded spatial datasets. Version Alpha 0.9. Harvard Dataverse. [URL].

Lloyd, C. T., A. Sorichetta, and A. J. Tatem, 2017: High resolution global gridded data for use in population studies. Sci Data, 4, 170001, doi: 10.1038/sdata.2017.1.

Macknick, J., 2014: Energy and CO2 emission data uncertainties. Carbon Management, 2(2), 189-205, doi: 10.4155/cmt.11.10.

Marland, G., R. J. Andres, T. J. Blasing, T. A. Boden, C. T. Broniak, J. S. Gregg, L. M. Losey, and K. Treanton, 2007: Energy, Industry, and Waste Management Activities: An Introduction to CO2 Emissions From Fossil Fuels. In: First State of the Carbon Cycle Report (SOCCR): The North American Carbon Budget and Implications for the Global Carbon Cycle. A Report by the U.S. Climate Change Science Program and the Subcommittee on Global Change Research. [A. W. King, L. Dilling, G. P. Zimmerman, D. M. Fairman, R. A. Houghton, G. Marland, A. Z. Rose, and T. J. Wilbanks (eds.)]. National Oceanic and Atmospheric Administration, National Climatic Data Center, Asheville, NC, USA, pp. 57-64.

Olivier, J., K. M. Schure, and J. A. Peters, 2017: Trends in Global CO2 and Total Greenhouse Gas Emissions: 2017 Report. PBL Netherlands Environmental Assessment Agency. [URL]

Rayner, P. J., M. R. Raupach, M. Paget, P. Peylin, and E. Koffi, 2010: A new global gridded data set of CO2 emissions from fossil fuel combustion: Methodology and evaluation. Journal of Geophysical Research: Atmospheres, 115(D19), doi: 10.1029/2009JD013439.

External Link External Link

You are leaving The Second State of the Carbon Cycle Report and will be redirected to a new site in 5 seconds.

USGCRP Globalchange.gov earth logo

13 Logos #1 13 Logos #2

U.S. Global Change Research Program
1800 G Street, NW, Suite 9100, Washington, DC 20006 USA
Tel: +1 202.223.6262 | Fax: +1 202.223.3065

Contact Us • Credits • Privacy Policy • Site Map

Some figures and images are copyright protected.
Permission of the copyright owner must be obtained
before making use of copyrighted material.