NCA4 Carbon Measurement
  • ABOUT
    Preface Executive Summary Report Credits
  • CHAPTERS

    Front Matter

    • Highlights
    • Preface
    • Executive Summary

    Synthesis 

    1. Overview
    2. The North American Carbon Budget

    Human Dimensions of the Carbon Cycle 

    1. Energy Systems
    2. Understanding Urban Carbon Fluxes
    3. Agriculture
    4. Social Science Perspectives on Carbon
    5. Tribal Lands

    State of Air, Land and Water 

    1. Observations of Atmospheric CO2 and Methane
    2. Forests
    3. Grasslands
    4. Arctic and Boreal Carbon
    5. Soils
    6. Terrestial Wetlands
    7. Inland Waters
    8. Tidal Wetlands and Estuaries
    9. Coastal Oceans and Continental Shelves

    Consequences and Ways Forward 

    1. Biogeochemical Effects of Rising Atmospheric CO2
    2. Carbon Cycle Science in Support of Decision Making
    3. Future of the North American Carbon Cycle

    Appendices

    1. Report Development Process
    2. Information Quality in the Assessment
    3. Selected Carbon Cycle Research Observations and Measurement Programs
    4. Carbon Measurement Approaches and Account Frameworks
    5. Fossil Fuel Emissions Estimates for North America
    6. Acronyms, Abbreviations and Units
    7. Glossary
  • DOWNLOADS
    View All Report Downloads Full Chapter PDF Chapter Figures (.zip) Chapter Bibliography (RIS)
Carbon Measurement
×

SECOND STATE OF THE CARBON CYCLE REPORT

CARBON MEASUREMENT APPROACHES AND ACCOUNTING FRAMEWORKS

  • SECTIONS
  • Approaches to Measuring
  • Estimating Carbon
  • Frameworks
  • References

APPENDIX
Carbon Measurement Approaches and Accounting Frameworks

Approaches to Measuring

Authors:
Richard Birdsey, Woods Hole Research Center
Noel P. Gurwick, U.S. Agency for International Development
Kevin Robert Gurney, Northern Arizona University
Gyami Shrestha, U.S. Carbon Cycle Science Program and University Corporation for Atmospheric Research
Melanie A. Mayes, Oak Ridge National Laboratory
Raymond G. Najjar, The Pennsylvania State University
Sasha C. Reed, U.S. Geological Survey
Paty Romero-Lankao, National Center for Atmospheric Research (currently at National Renewable Energy Laboratory)

<b>Birdsey</b>, R., N. P. <b>Gurwick</b>, K. R. <b>Gurney</b>, G. <b>Shrestha</b>, M. A. Mayes, R. G. Najjar, S. C. Reed, and P. RomeroLankao, 2018: Appendix D. Carbon measurement approaches and accounting frameworks. In Second State of the Carbon Cycle Report (SOCCR2): A Sustained Assessment Report [Cavallaro, N., G. Shrestha, R. Birdsey, M. A. Mayes, R. G. Najjar, S. C. Reed, P. Romero-Lankao, and Z. Zhu (eds.)]. U.S. Global Change Research Program, Washington, DC, USA, pp. 834-838, doi: https:// doi.org/10.7930/SOCCR2.2018.AppD.

Since publication of the First State of the Carbon Cycle Report (SOCCR1), coordinated research supported and facilitated by multiple agencies in the United States, Canada, and Mexico has enabled significant innovative observational, analytical, and modeling capabilities and approaches to further advance understanding of the North American car- bon cycle. This appendix describes such approaches and methods for carbon stock and flow estimations, measurements, and accounting.1

1 This appendix describes carbon accounting and measurement approaches used in the research assessed in this report. These approaches were introduced in the Preface section titled “Methods for Estimating Carbon Stocks and Fluxes,” and are elaborated on here.

Estimating Carbon

D.2.1 Inventory Measurements or “Bottom-Up” Methods

Measurements of carbon contained in biomass, soils, and water, as well as ecosystem measurements of carbon dioxide (CO2) and methane (CH4) exchanges between land and water ecosystems and the atmosphere, constitute carbon inventories and are sometimes referred to as bottom-up approaches. Generally, carbon stocks in land ecosystems are measured with remote sensing and field sampling, which may be repeated over time to estimate changes in stocks. In addition, the exchange of CO2 and CH4 between land and water ecosystems and the atmosphere may be observed directly by using gas concentration measurements, directly measuring fluxes or estimating fluxes from assessments of energy consumption and sales (in the case of fossil fuel flux). Measurements in specific environments, such as urban areas, often combine demographic and activity data (e.g., population and building floor areas) with “emissions factors” that estimate the amount of CO2 released per unit of activity. Emissions of CO2 and CH4 released from large sources (e.g., power plants) may be observed directly.

D.2.2 Atmospheric Measurements or “Top-Down” Methods

Observations of atmospheric concentrations of CO2 and CH4 are obtained using air sampling instruments on the ground, towers, buildings, balloons, and aircraft or remote sensors on satellites. Top-down approaches infer fluxes from the terrestrial land surface and ocean by coupling these atmospheric gas measurements with carbon isotope methods, tracer techniques, and simulations of how these gases move in the atmosphere. The network of greenhouse gas (GHG) measurements, types of measurement techniques, and diversity of gases measured has grown exponentially since SOCCR1, providing improved estimates of CO2 and CH4 and increased temporal resolution at regional to local scales across North America.

D.2.3 Ecosystem Models

Terrestrial and marine ecosystem models are used to estimate quantities or fluxes of carbon that may be difficult or impossible to measure directly over large areas. The models typically are evaluated and calibrated using measurements at a limited number of sites representing different ecosystems. The models are then used to apply these measurements to larger areas or regions based on knowledge of ecosystem characteristics such as species composition, soils, weather, physiography, or management history. Ecosystem models also are used with topdown atmospheric measurements to attribute GHG observations to specific terrestrial or ocean domains of interest.

Frameworks

Two approaches to quantify carbon cycle components inform research and analysis for scientific studies as well as for management and decisions: 1) production-based or in-boundary accounting and 2) consumption-based accounting.

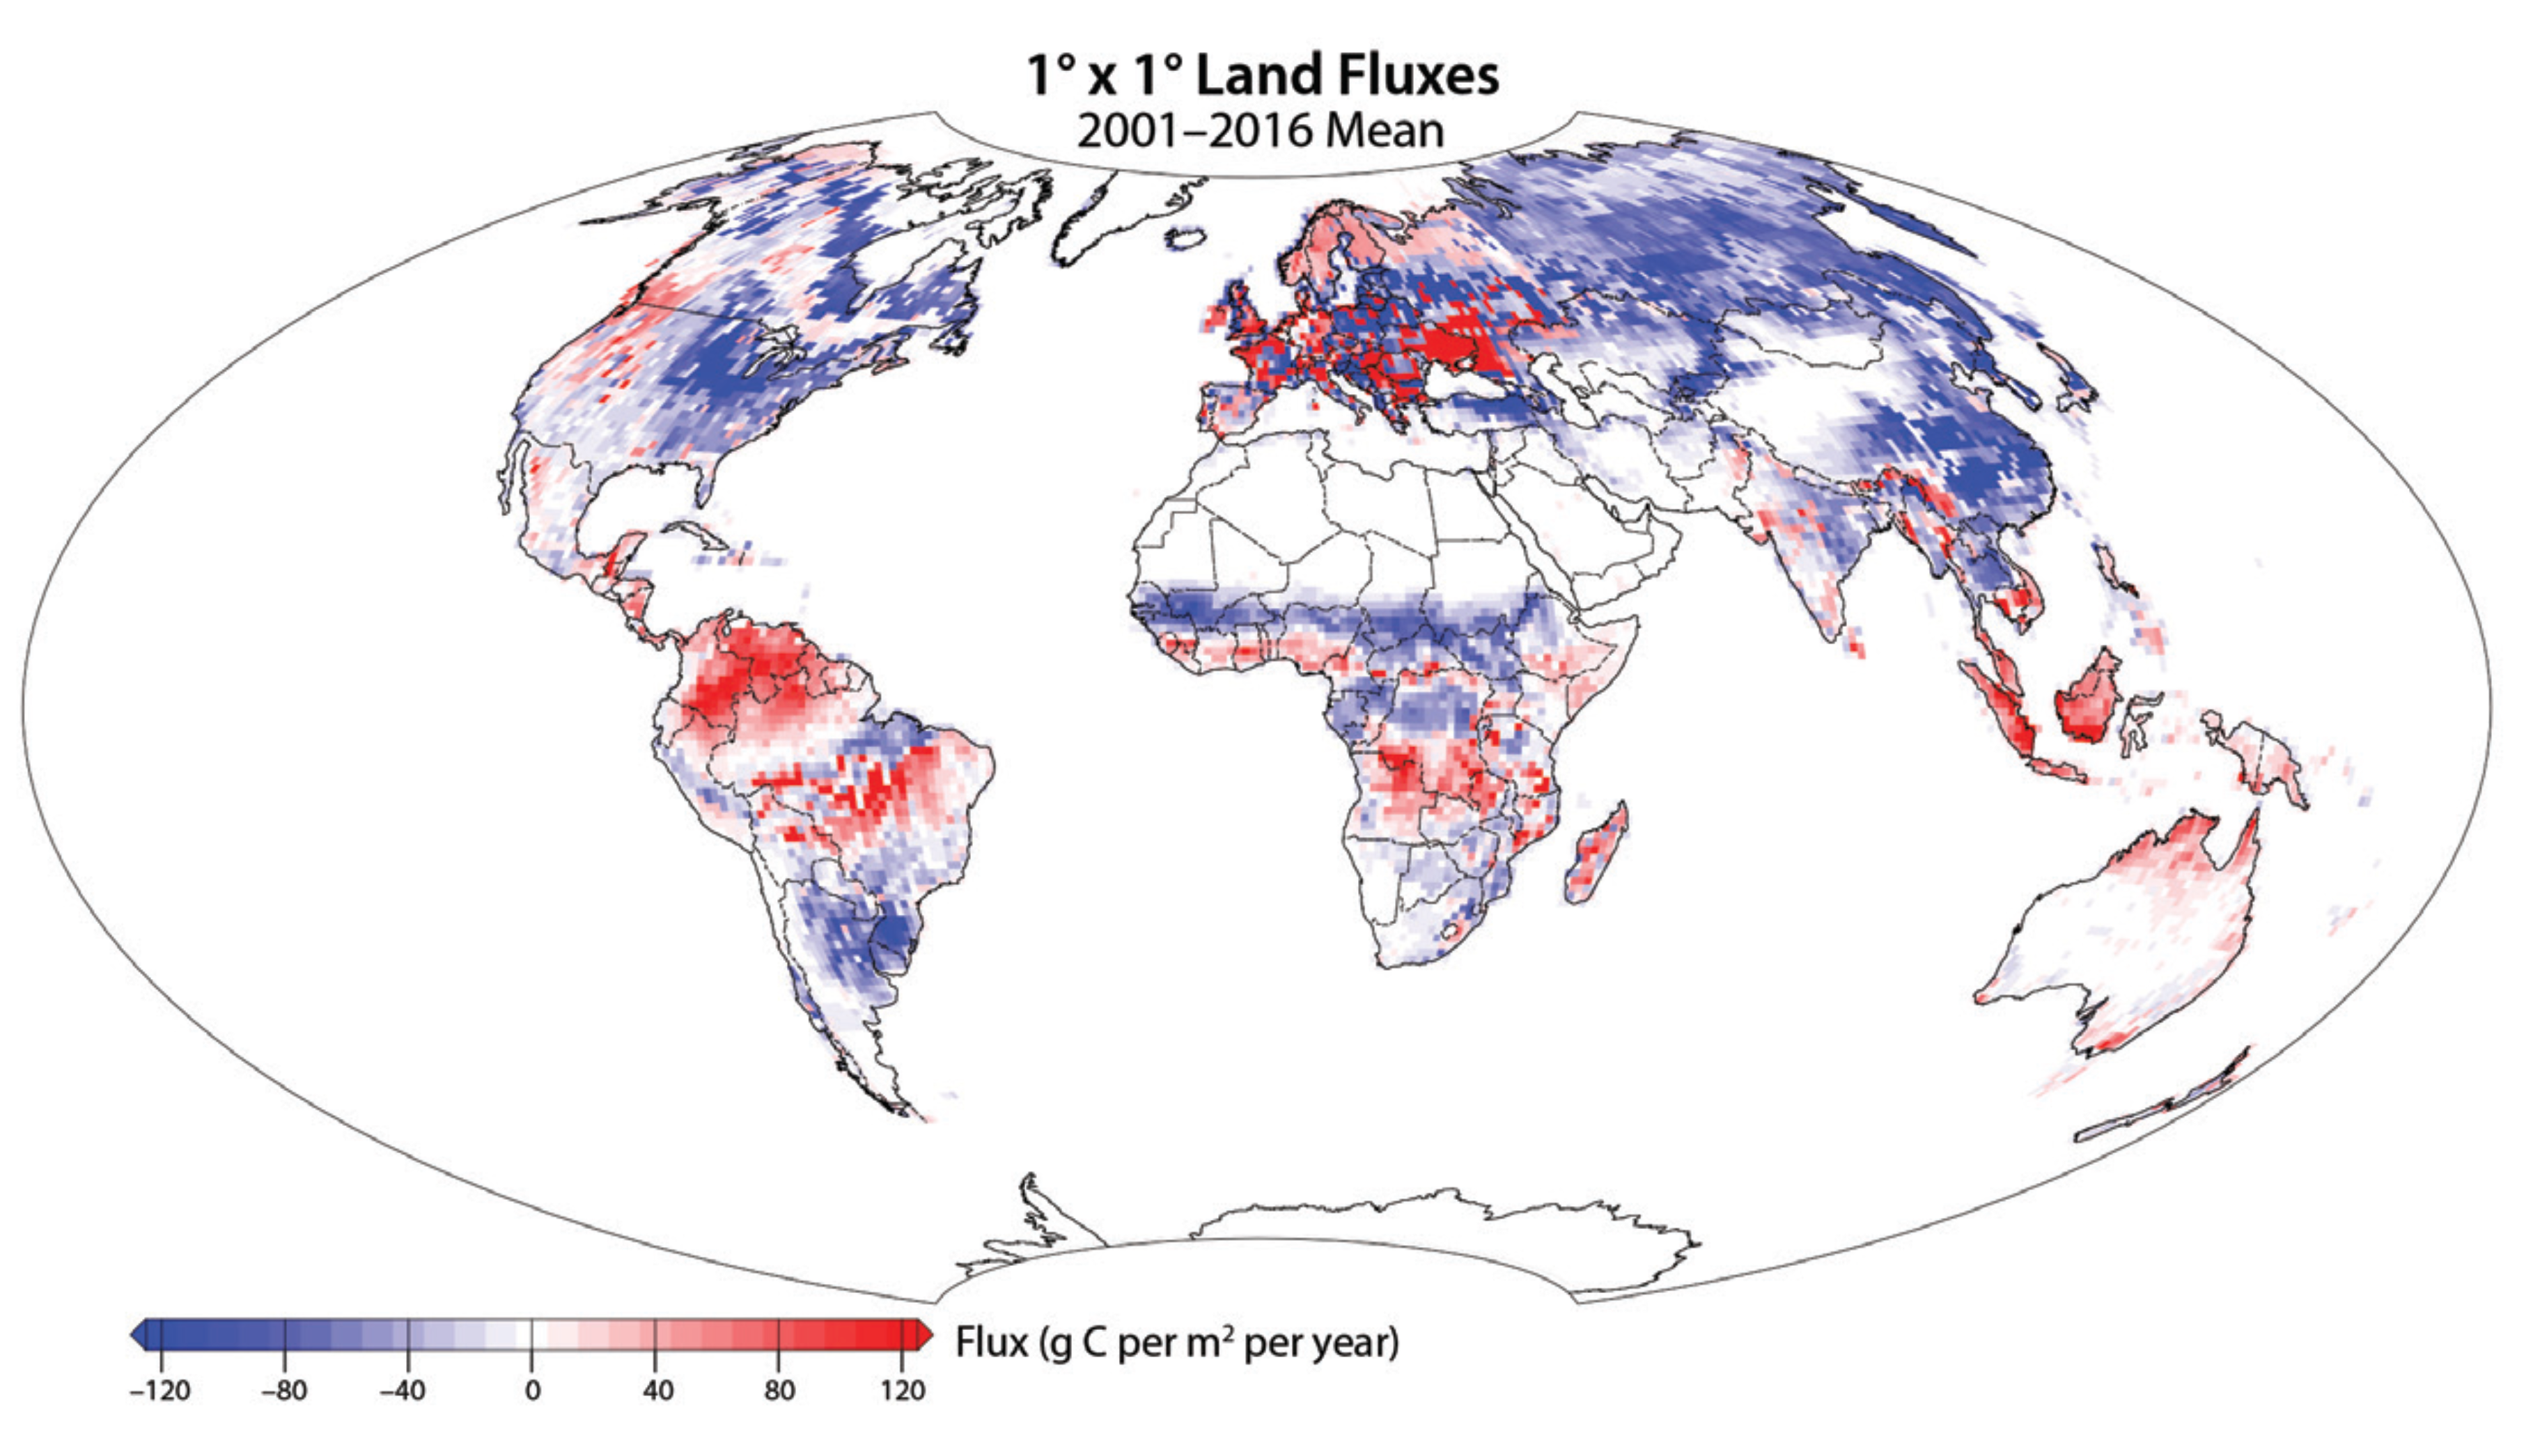
Production-based, or in-boundary accounting, considers CO2 and CH4 flows into and out of specific areas of land or water. For a hectare of land, net emissions result from, for example, photosynthesis, CO2 absorption by concrete, fossil fuel combustion at a power plant, and the decay of plants and animals on that parcel (see Figure D.1, this page). In practice, analyses of terrestrial ecosystems such as forests and grasslands also typically include lateral transfers of carbon among parcels (e.g., via erosion or streamflow).


Figure D4.1: Carbon Emissions as Estimated Using a Production-Based Approach

Figure D4.1: This approach assigns emissions to the place where fluxes between the atmosphere and terrestrial or aquatic ecosystems physically occur. One-degree fluxes are shown at bottom left. The map shows the land biosphere pattern of net ecosystem exchange of carbon dioxide averaged over the time period indicated, as estimated by CarbonTracker. [Figure source: Reprinted from National Oceanic and Atmospheric Administration’s CarbonTracker, version CT2016 (Peters et al., 2007).]

SHRINK

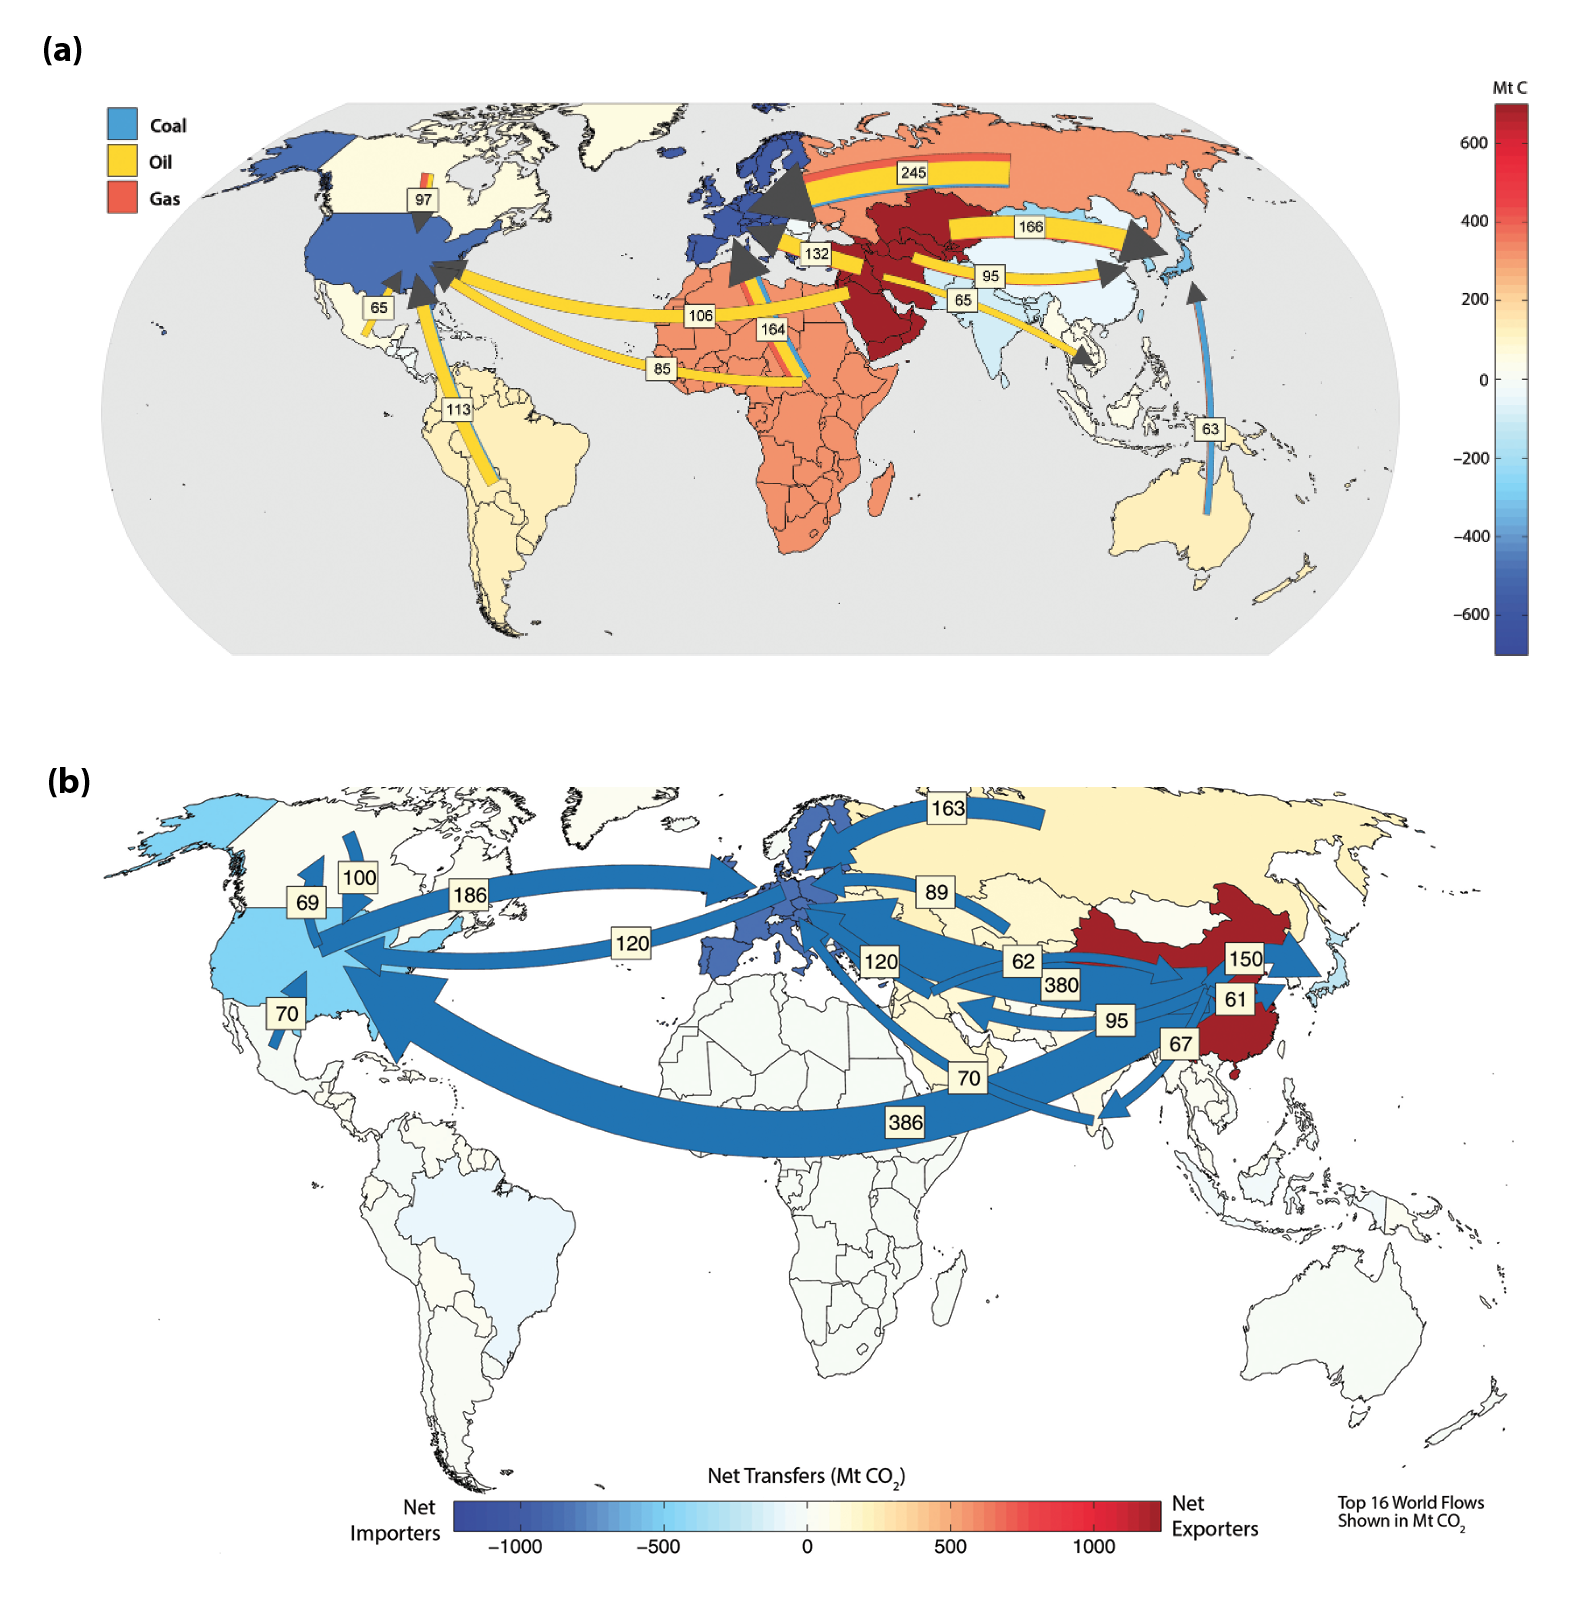
Consumption-based accounting assigns carbon flows associated with products and services (e.g., timber, electricity, food, chairs, televisions, and heat) to the places where people ultimately use those products (see Figure D.2). This approach captures demand and trade as drivers of carbon emissions. For example, emissions from fossil fuel combustion during the production of electricity are assigned not to a power plant, but rather to the places where people use that electricity. In other examples, emissions from crop production are assigned to the place where the crop is consumed (by humans or animals), and carbon captured in trees harvested for timber is assigned to the timber mill or to the place where the timber is used. Quantification of these indirect fluxes typically employs a life cycle assessment framework that also can quantify the carbon stock residing in infrastructure and materials. Consumption-based approaches are more suited to revealing opportunities for replacing highly inefficient processes on the demand side with carbon-conserving processes (e.g., reducing GHG emissions by reducing food loss and waste), and to pointing out sectors in which demand for high-carbon products is strong (e.g., buildings that use excessive electricity compared to similarly sized buildings).

The difference between these two carbon accounting approaches is central to understanding stakeholder interests and deciding which accounting approaches to apply in different circumstances. How does responsibility for emissions divide, for example, between the person who finances a power plant that relies on fossil fuels and the people who own computers manufactured using electricity from that plant? How does responsibility for CH4 production by cattle divide among the people who own goods made of leather, people who transport cattle to the slaughterhouse, people who own feedlots, organizations that sell hamburgers, and people who consume beef? Questions like these, often unstated, determine which carbon accounting framework is most useful for informing debate, management, and decisions.

In some sectors, and at regional or national scales, production-based and consumption-based carbon accounting yield dramatically different results. In urban ecosystems, for example, where energy and goods are imported from sometimes distant suppliers into the urban domain, consumption-based estimates can yield a very different emissions responsibility than production-based estimates. Trade among nations also leads to dramatic differences in carbon flux estimates between production- and consumption-based approaches, with carbon-intensive production dominating some economies and consumption of those goods occurring primarily on other continents. At the scale of the whole planet, the two approaches necessarily converge.

Production- and consumption-based approaches reflect supply and demand perspectives, respectively, both of which inform management and policy decisions. For example, production-based approaches illuminate the consequences of different land-use patterns and the geographic areas where inefficient production systems offer compelling opportunities for improved carbon management. They also provide information about the relative importance of different processes to trends in carbon stocks; for example, they illustrate the magnitude of CO2 production from fossil fuel combustion in relation to CH4 production from ruminants and carbon capture by forests. Estimates from this accounting approach also correspond to direct measurements of CO2 and CH4 flows into and out of terrestrial and aquatic ecosystems (e.g., with flux towers).


Figure D4.2: Carbon Emissions as Estimated Using a Consumption-Based Approach

Figure D4.2: This approach assigns emissions to the place where goods and energy are consumed. (a) The top 12 inter-regional flows of fossil fuel carbon embodied in trade from extracting region to producing region, broken down by primary fuel type and disaggre- gated further to highlight key countries. (b) Fossil fuel carbon flows from extraction to consumption. [Figure sources: Panel (a) reprinted from Peters et al., 2012, used with permission under a Creative Commons Attribution License (CC BY 3.0 US). Panel (b) reprinted from Le Quéré et al., 2018, used with permission under a Creative Commons Attribution License (CC BY 4.0 US).]

SHRINK

References

Le Quéré, C., R. M. Andrew, P. Friedlingstein, S. Sitch, J. Pongratz, A. C. Manning, J. I. Korsbakken, G. P. Peters, J. G. Canadell, R. B. Jackson, T. A. Boden, P. P. Tans, O. D. Andrews, V. K. Arora, D. C. E. Bakker, L. Barbero, M. Becker, R. A. Betts, L. Bopp, F. Chevallier, L. P. Chini, P. Ciais, C. E. Cosca, J. Cross, K. Currie, T. Gasser, I. Harris, J. Hauck, V. Haverd, R. A. Houghton, C. W. Hunt, G. Hurtt, T. Ilyina, A. K. Jain, E. Kato, M. Kautz, R. F. Keeling, K. K. Goldewijk, A. Körtzinger, P. Landschützer, N. Lefèvre, A. Lenton, S. Lienert, I. Lima, D. Lombardozzi, N. Metzl, F. Millero, P. M. S. Monteiro, D. R. Munro, J. E. M. S. Nabel, S. Nakaoka, Y. Nojiri, X. A. Padin, A. Peregon, B. Pfeil, D. Pierrot, B. Poulter, G. Rehder, J. Reimer, C. Rödenbeck, J. Schwinger, R. Séférian, I. Skjelvan, B. D. Stocker, H. Tian, B. Tilbrook, F. N. Tubiello, I. T. van der Laan-Luijkx, G. R. van der Werf, S. van Heuven, N. Viovy, N. Vuichard, A. P. Walker, A. J. Watson, A. J. Wiltshire, S. Zaehle, and D. Zhu, 2018: Global Carbon Budget 2017. Earth System Science Data, 10, 405-448, doi: 10.5194/essd-10-405-2018.

Peters, P., G. Davis, M. Steven, and R. Andrew, 2012: A synthesis of carbon in international trade. Biogeosciences, 9, 3247-3276, doi: 10.5194/bg-9-3247-2012.

Peters, W., A. R. Jacobson, C. Sweeney, A. Andrews, T. J. Conway, K. Masarie, J. B. Miller, L. M. P. Bruhwiler, G. Pétron, A. I. Hirsch, D. E. J. Worthy, G. R. van der Werf, J. T. Randerson, P. O. Wennberg, M. C. Krol, and P. P. Tans, 2007: An atmospheric perspective on North American carbon dioxide exchange: CarbonTracker. Proceedings of the National Academy of Sciences USA, 104(48), 18925-18930, doi: 10.1073/pnas.0708986104.

External Link External Link

You are leaving The Second State of the Carbon Cycle Report and will be redirected to a new site in 5 seconds.

USGCRP Globalchange.gov earth logo

13 Logos #1 13 Logos #2

U.S. Global Change Research Program
1800 G Street, NW, Suite 9100, Washington, DC 20006 USA
Tel: +1 202.223.6262 | Fax: +1 202.223.3065

Contact Us • Credits • Privacy Policy • Site Map

Some figures and images are copyright protected.
Permission of the copyright owner must be obtained
before making use of copyrighted material.