<b>Hayes</b>, D. J., R. <b>Vargas</b>, S. R. Alin, R. T. Conant, L. R. Hutyra, A. R. Jacobson, W. A. Kurz, S. Liu, A. D. McGuire, B. Poulter, and C. W. Woodall, 2018: Chapter 2: The North American carbon budget. In Second State of the Carbon Cycle Report (SOCCR2): A Sustained Assessment Report [Cavallaro, N., G. Shrestha, R. Birdsey, M. A. Mayes, R. G. Najjar, S. C. Reed, P. Romero-Lankao, and Z. Zhu (eds.)]. U.S. Global Change Research Program, Washington, DC, USA, pp. 71-108, https://doi.org/10.7930/SOCCR2.2018.Ch2.
The North American Carbon Budget
Current estimates of carbon stocks available from the sector-based chapters across SOCCR2 are compiled in Table 2.1. These estimates total about 627 Pg C stored in North American terrestrial ecosystems, particularly soils or sediments, which contain about 93% of the total stock. Notably, the magnitude of many soil pools across ecosystems has not been measured or estimated (see Table 2.1), leading to an unknown uncertainty in the size of this pool (see Ch. 12: Soils). Estimates of vegetation carbon stocks generally are more comprehensive and precise than soil stocks because vegetation biomass—particularly in forests—can be estimated with inventory measurements and remote-sensing methods (Masek et al., 2015). Relative to the organic carbon stored in long-term soil pools, vegetation stocks are of much smaller magnitude and are more transient as a function of their higher turnover rates. The largest SOC pool, thought to be stored in northern high-latitude soils (Tarnocai et al., 2007, 2009), is vulnerable to decomposition and release to the atmosphere as permafrost thaws due to climate warming (Schuur et al., 2015). In general, however, a reliable estimate of total stocks at the continental scale currently is not possible, given the lack of comprehensive and systematic inventories across all the major components of the carbon cycle. Instead, the SOCCR2 synthesis effort focuses on the stock changes, fluxes, and transfers of carbon among the major terrestrial and coastal pools and the atmosphere.
Table 2.1. Estimated Stocks of Major North American Carbon Pools ca. 2013a
| Carbon Pools | Canada | United States | Mexico | North America |
|---|---|---|---|---|
| Forest Biomassb | 18,591 | 19,675 | 1,995 | 40,261 |
| Forest Soilsc | 31,395 | 31,454 | 4,900 | 67,749 |
| Agricultural Soilsd | 5,500 | 13,000 | 2,115 | 20,615 |
| Grassland Biomasse | NDf | 1,362 | ND | 1,362 |
| Grassland Soilsg | ND | 6,049 | 4,100 | 10,149 |
| Tundra Biomassh | 1,010 | 350 | NAf | 1,360 |
| Permafrost Soilsi | ND | ND | NAf | 459,000 |
| Terrestrial Wetland Biomassj | 946 | 412 | 16 | 1,374 |
| Terrestrial Wetland Soilsk | 46,354 | 20,188 | 764 | 67,306 |
| Inland Waters Sediment | ND | ND | ND | ND |
| Tidal Wetland and Estuary Soilsl | ND | ND | ND | 1,886 |
| Coastal Ocean Sediment | ND | ND | ND | ND |
| Total Biomass | 20,547 | 21,799 | 2,011 | 44,357 |
| Total Soils | 83,249 | 70,691 | 11,879 | 626,705 |
Notes
a Data, in teragrams of carbon (Tg C), are from the sector-based chapters of this report.
b Includes above- and belowground biomass plus deadwood (Table 9.2).
c Includes litter plus soil (Table 9.2).
d Canadian estimate (Table 12.4); U.S estimate from Rapid Carbon Assessment (RaCA) project (Table 12.1); Mexican grazing lands estimate (Table 12.3).
e Estimate for conterminous United States only (Table 10.2).
f ND = no data; NA = not applicable.
g Conterminous U.S. estimate (Table 10.2); Mexican estimate for “Other Lands” (Table 12.2).
h Tundra vegetation biomass for Canada and Alaska (Table 11.2).
i North America contains about one-third of the total estimated 1,460 to 1,600 petagrams of carbon (Pg C) stock of circumpolar permafrost soils (to a 3-m depth; see Ch. 11: Arctic and Boreal Carbon).
j Calculated as 2% of the total carbon stock of nonforested wetlands with peatland and mineral soils (Table 13.1).
k Calculated as 98% of the total carbon stock of nonforested wetlands with peatland and mineral soils (Table 13.1).
l The total estimated carbon stocks from tidal wetlands, estuaries, and seagrasses (see Ch. 15: Tidal Wetlands and Estuaries)
All of the land, water, and coastal ocean flux estimates compiled in the budget presented here are considered to be the best available approximations of each sector’s NEE, as shown in Table 2.2, where a negative value represents a removal (i.e., sink) from the atmosphere. There is very high confidence that the North American continent—including its energy systems, land base, and coastal ocean—was a net source of carbon to the atmosphere from 2004 to 2013, having contributed on average approximately 1,008 Tg C per year (see Table 2.2). Natural sinks within North American land ecosystems, waters, and coastal ocean areas accounted for about 766 Tg C per year in net uptake from 2004 to 2013, offsetting about 43% of the total fossil fuel emissions over that time period. The largest sink in this continental-scale budget is the estimated 260 Tg C per year associated with inland waters. This estimate represents the net effect of inland waters on surface-atmosphere CO2 exchange, accounting for lateral fluxes, gas emissions, and sedimentation (see Ch. 14: Inland Waters), but it is considered a highly uncertain value (i.e., >100% of the estimate). The United States has the largest estimated land-based sink (360 Tg C per year) among the three countries, with the majority of net uptake occurring in its forest sector (201 Tg C per year). The U.S. forest sector estimate is among the most well constrained of the land ecosystem fluxes, with the true value likely to be within 25% of the estimate. Estimated uptake by the North American coastal ocean, at 160 Tg C per year, represents the other significant sink in the budget, having a medium certainty (i.e., within 50% of the estimate; see Ch. 16: Coastal Ocean and Continental Shelves). All the estimated fluxes from land and coastal ocean ecosystems, compiled across the key sectors of the continental carbon budget, are based largely on inventory approaches or other bottom-up methods described in other chapters of this report.
Table 2.2. Estimated Average Annual Net Emissions or Uptake for North American Carbon Cycle Components, ca. 2004 to 2013
| Carbon Source (+) or Sink (–) | Canada | United States | Mexico | North America |
|---|---|---|---|---|
| Fossil Source (+) | ||||
| Fossil Fuel Emissions (Ch. 3) | 148 | 1,496 | 130 | 1,774 |
| Nonfossil Sink (–) or Source (+) | ||||
| Forests (Ch. 9) | 16 | –201 | –32 | –217 | Agricultural Soilsa | –1 | –14 | NDb | –15 |
| Grasslands (Ch. 10)c | –3 | –13 | –9 | –25 |
| Arctic and Boreal Carbon (Ch. 11) | –9 | –5 | NAb | –14 |
| Terrestrial Wetlands (Ch. 13)d | –18 | –34 | –7 | –58 |
| Inland Waters (Ch. 14) | ND | –85 | ND | –260 |
| Tidal Wetlands and Estuaries (Ch. 15) | ND | –8 | ND | –17 |
| Coastal Ocean (Ch. 16) | ND | ND | ND | –160 |
| Total | –15 | –360 | –48 | –766 |
| Net Carbon Source | 134 | 1136 | 82 | 1,008 |
Estimates of carbon emissions (sources) or uptake (sinks) are given in teragrams of carbon (Tg C) per year. These estimates are generally consistent with those in Figure 2.3, although some components are defined differently and estimates include inferred values. Because the estimates have different spatial domains, the North American total does not always equal the sum of the three individual country estimates. Mathematical rounding accounts for the difference between the estimated North American net carbon source in this table (1,008 Tg C per year) and the carbon added to the atmospheric pool over North America in Figure 2.3 (1,009 Tg C per year).
Notes
a Average annual stock change in soil organic carbon in croplands, 2000–2009; based on inventory estimates by King et al. (2015).
b ND = no data; NA = not applicable.
c “Inventory Analysis” estimates (Table 10.1).
d The “Net Carbon Balance” of nonforested wetlands with peatland and mineral soils (Table 13.1).
2.3.1 Fossil Fuel Emissions
According to recent data (Boden et al., 2015), the United States emitted approximately 1,400 Tg C from fossil fuel burning, cement production, and gas flaring during 2013—accounting for 15% of the global total that year. The United States still contributes 85% of the combined fossil fuel emissions from the three North American countries, but in 2013 the continental proportion of the global total dropped to 17% from the 27% reported for 2003 in SOCCR1 (CCSP 2007). The proportional emissions among the three nations to the continental total have remained relatively constant over the last 30 years (about 8%, 86%, and 6% for Canada, the United States, and Mexico, respectively), but the annual total magnitudes have varied in the last 10 years because of changing national and global socioeconomic factors (King et al., 2012). The annual rate of total fossil fuel emissions from North America indicates a notable change in trend during the decade since SOCCR1. Emissions from 1994 to 2003 showed a significant (p<0.01) increasing trend of 24 Tg C per year in contrast to a significant decreasing trend of 23 Tg C per year between 2004 and 2013 (see Figure 2.2 and Ch. 8: Observations of Atmospheric Carbon Dioxide and Methane). In 2007, the highest annual continental total fossil fuel emissions were recorded at about 1,800 Tg C. That level has not been exceeded since, with emissions estimates averaging about 1,700 Tg C per year from 2008 to 2013.
Figure 2.2: Annual North American Fossil Fuel Emissions from 1959 to 2014
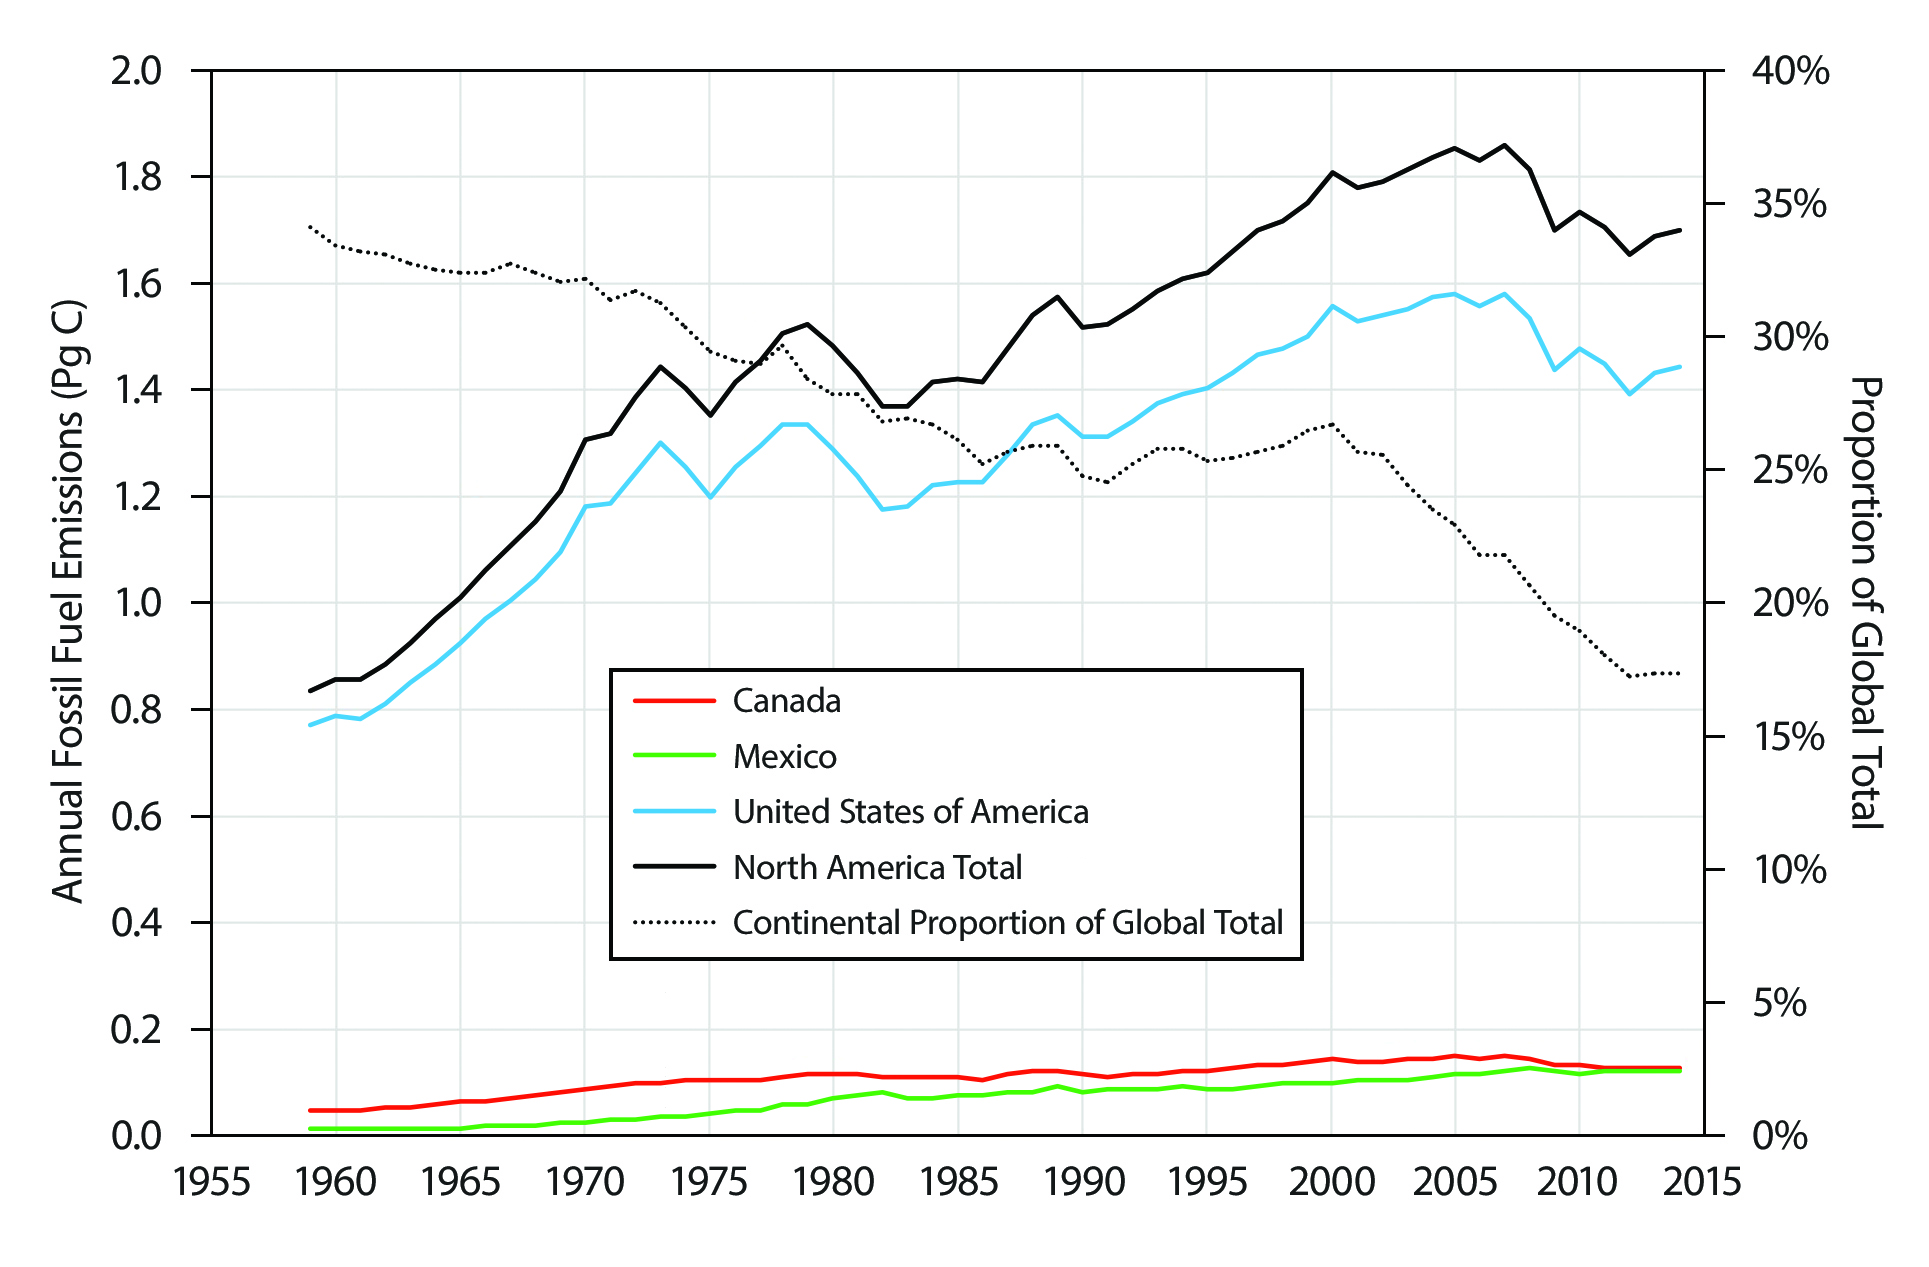
Among the various potential sources of emissions data (see Appendix E: Fossil Fuel Emissions Estimates for North America), the Carbon Dioxide Information Analysis Center (CDIAC) dataset was chosen for its consistency and length of record (Boden et al., 2017). However, assigning an uncertainty to the CDIAC time series is a challenge. Andres et al. (2014) discuss various ways to characterize the uncertainty of this data product and suggest that a time-average uncertainty for the United States could be about 4% (or 2 standard deviations around the mean estimate). U.S. fossil fuel estimates reported in SOCCR1 used ±5% for the uncertainty of estimates for developed countries, concordant with intercomparisons using the International Energy Agency dataset (IEA 2005). This chapter represents the uncertainty as the fractional range of estimates from five different inventories, averaged over time (see Appendix E). By this measure, estimates of fossil fuel emissions have varied in uncertainty over time and among countries. The current ±5.5% uncertainty applies to the total estimated North American fossil fuel emissions of 1,774 Tg C per year from 2004 to 2013 as reported here (see Table 2.2). The uncertainty around the mean estimate by country is highest for Canada (±30%) and lower for Mexico (±15%) and the United States (±6%). Precision of the fossil fuel emissions estimates is sensitive to the spatial and temporal scales of the inventories, and uncertainty at the scale of individual cities is poorly constrained, ranging from 50% to 100% variation around the mean (NAS 2010; Rayner et al., 2010; see also Ch. 4: Understanding Urban Carbon Fluxes). Notably, current uncertainties associated with urban emissions typically exceed emissions reduction goals, making verification of these goals very challenging (Gurney et al., 2015; Hutyra et al., 2014).
2.3.2 Net Ecosystem Exchange
Calculating North American NEE involves assembling information from the major sectors (i.e., ecosystem compartments) for each country (see Table 2.2). The North American forest sector estimate (–217 Tg C per year) is based on current inventory estimates from this report (see Ch. 9: Forests), including forestland NEE, the net of forest area gain and loss, the sink in urban trees, and emissions from biomass removal and use in each country (see Table 9.3). The estimate for agricultural soils (–15 Tg C per year) is based on average annual stock change data for the 2000s, as compiled for the United States and Canada by King et al. (2015). Grassland estimates for the three countries (i.e., –3, –13, and –9 Tg C per year for Canada, the United States, and Mexico, respectively) represent average annual stock change in “other lands” between 2000 and 2006, as reported by Hayes et al. (2012; see also Table 10.1). The estimated NEE for the Arctic-boreal region of North America (–14 Tg C per year) is based on a synthesis of eddy covariance flux data during the 2000s from research sites in Alaska and Canada (King et al., 2015; McGuire et al., 2012). Of this small sink, the portion attributed to the United States (–5 Tg C per year) is based on model simulations for upland ecosystems in Alaska (Genet et al., 2016) and, without a specific estimate for NEE, the remaining portion (–9 Tg C per year) is attributed to Arctic tundra and unmanaged boreal forest in Canada. The NEE estimate for terrestrial wetlands included in this budget (–58 Tg C per year) is based on information from Ch. 13: Terrestrial Wetlands. However, only the contribution from nonforested wetlands (including both peatland and mineral soils) is included in the calculations (see Table 13.1) because NEE from forested wetlands is considered to be accounted for already in the estimate for the forest sector. The estimated contribution to continental NEE from inland waters (–260 Tg C per year) is based on estimates from Ch. 14: Inland Waters and considered here to be the amount of carbon of terrestrial origin that is stored as sediment (155 Tg C per year) plus the amount exported to estuaries (105 Tg C per year; see Table 14.1), as discussed in more detail below. The NEE estimate given for the combined tidal wetland and estuary ecosystems (–17 Tg C per year) is the balance of uptake by tidal wetlands (–27 Tg C per year) and outgassing by estuaries (10 Tg C per year), as estimated from information in Ch. 15: Tidal Wetlands and Estuaries and as discussed in more detail below. Finally, data from Ch. 16: Coastal Ocean and Continental Shelves are used to account for the uptake of atmospheric carbon by waters of the coastal ocean (–160 Tg C per year; see Table 16.5) in the continental NEE budget estimates.
2.3.3 Stock Changes, Emissions, and Lateral Transfers of Carbon
Figure 2.3 shows carbon flows among the major components of the North American carbon cycle for the decade since the ca. 2003 estimates reported in SOCCR1. This figure aims to reconcile atmospheric flux and lateral transfer estimates with estimates of stock changes among the major sectors described throughout this report. Unlike estimates of sector-atmosphere exchange (i.e., NEE) in Table 2.2, the boxes in Figure 2.3 represent the best estimates of stock change in each component, and the arrows represent the flows of carbon between components. As explained in Section 2.1 the 2004 to 2013 time period chosen for this analysis generally represents the decade since the estimates reported in Chapter 3 of SOCCR1, which are given as ca. 2003. These exact dates are not used rigidly, however, when combining and reconciling various datasets in the budget synthesis reported here. Although some datasets—such as the fossil fuel emissions estimates (e.g., Boden et al., 2015)—have a temporal resolution allowing summary of precise time periods, other datasets, such as the periodically sampled forest inventory (see Ch. 9: Forests), do not. As such, this chapter attempts to synthesize the various budget components using reported estimates and datasets generally representative of the 2004 to 2013 time period. While this coarser-than-annual level of precision does add an additional (but unknown) amount of uncertainty to the overall budget, this synthesis approach represents a best estimate of carbon stock changes and flows for an average year during the decade since the SOCCR1 synthesis.
Figure 2.3: Major Components of the North American Carbon Cycle
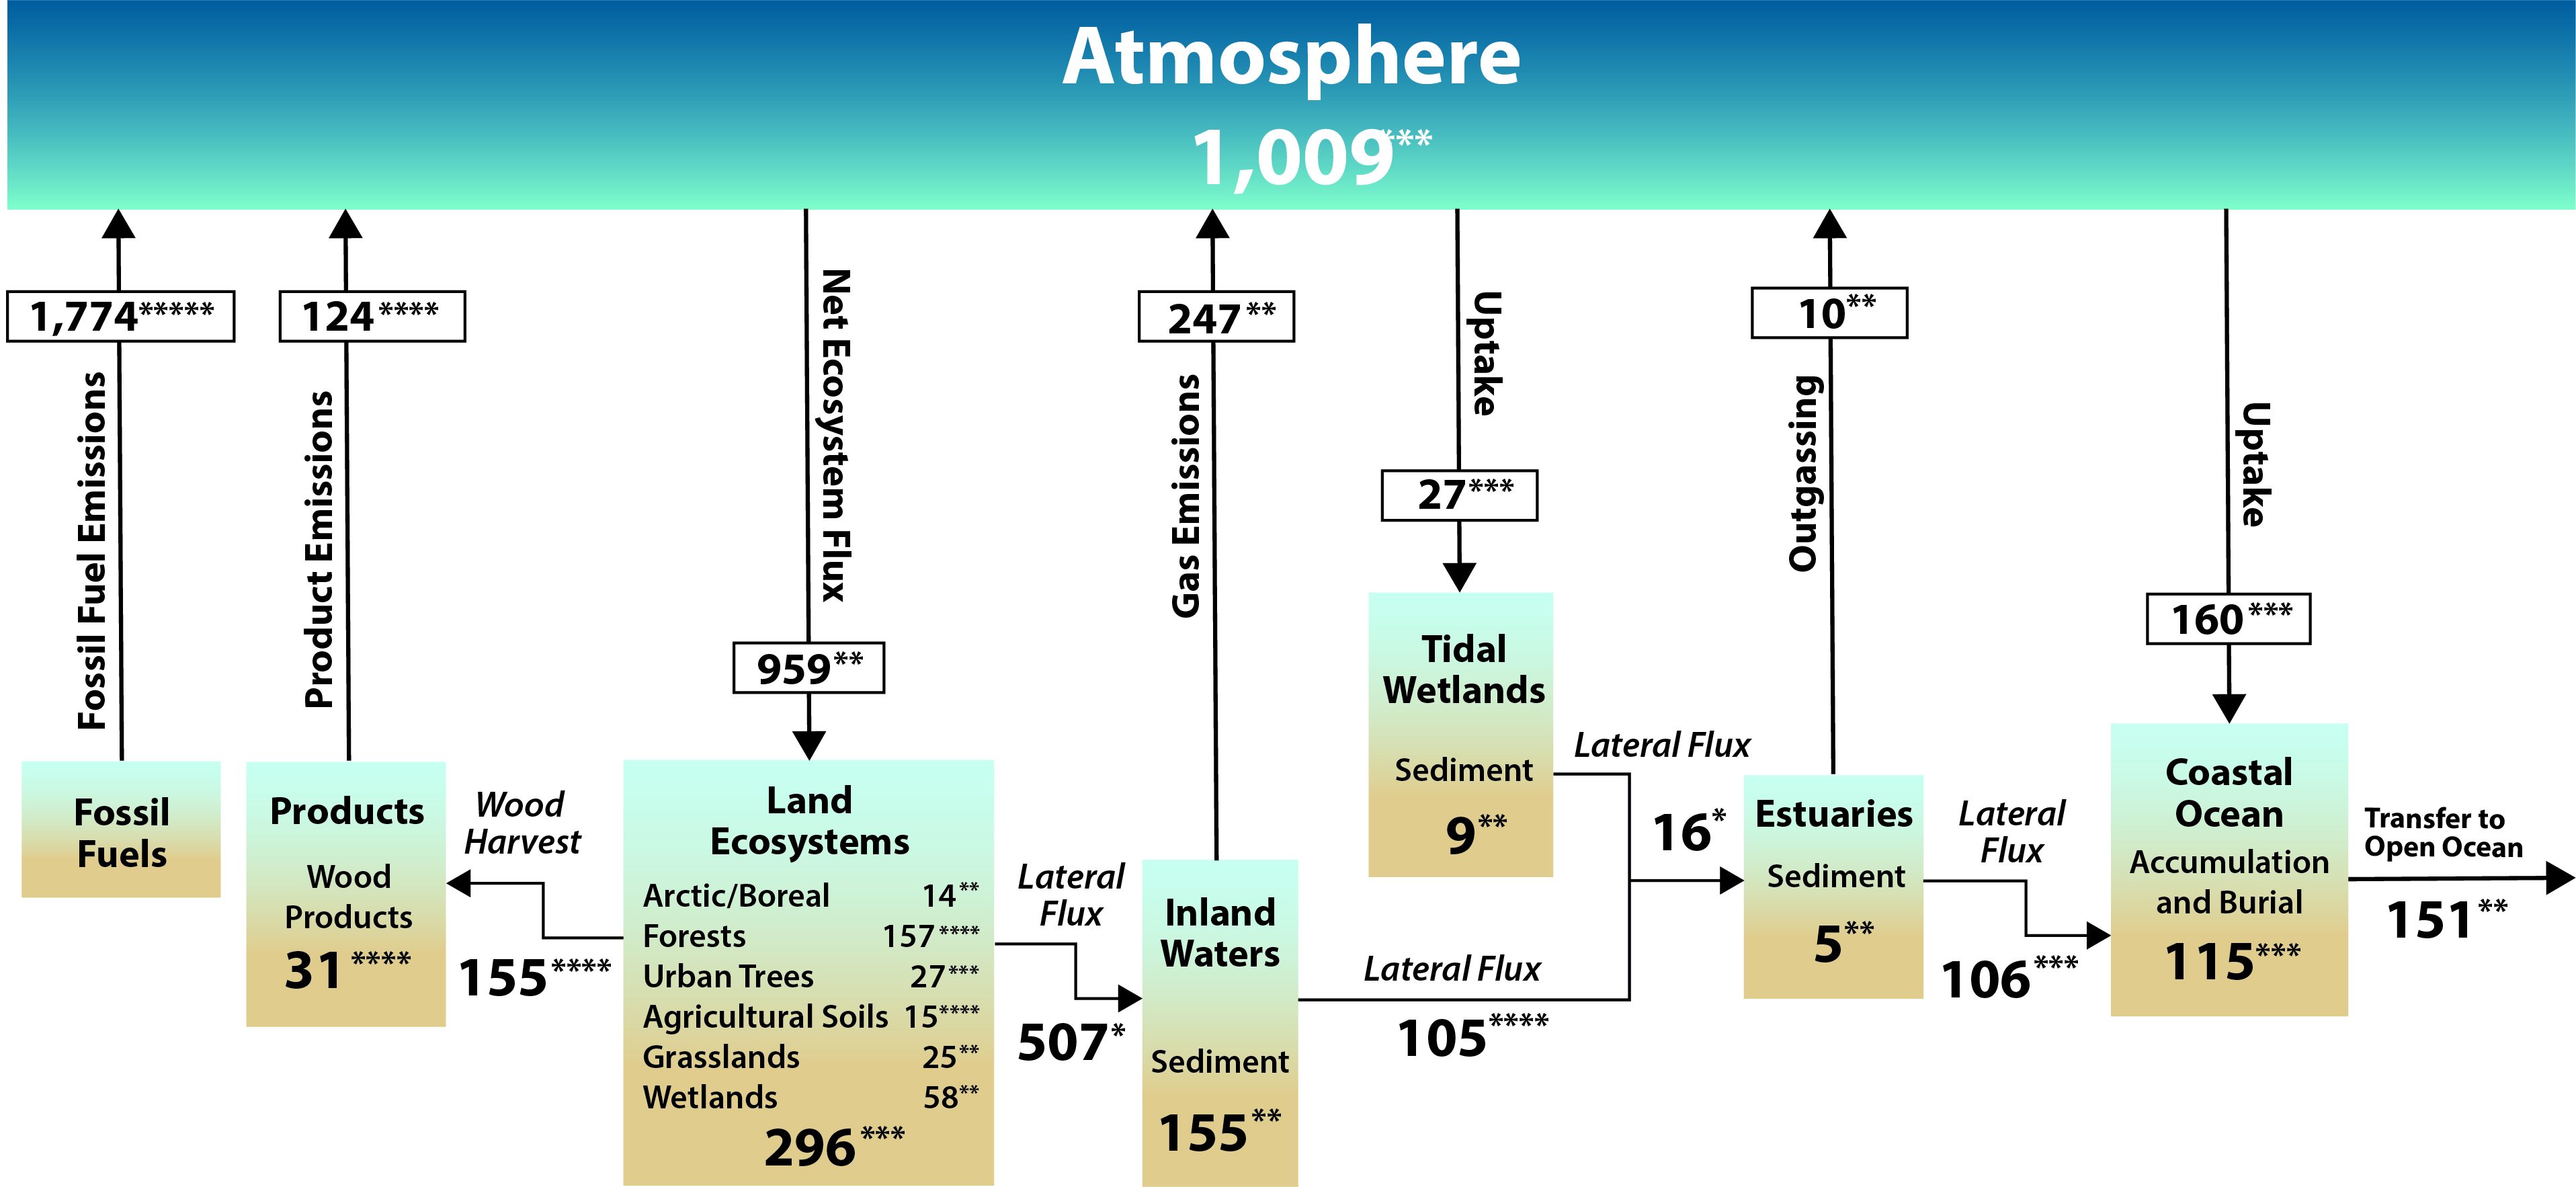
Collectively, the land ecosystems of North America increased their carbon stocks at an estimated rate of about 296 Tg C per year over the ca. 2004 to 2013 time period, as shown in Figure 2.3. The majority (i.e., 53%) of this stock increase occurred in the managed forests of North America. The estimate for stock change in forests at the continental scale is the sum of the three countries, where stock change in forestland plus the net of forest area loss or gain was used to calculate U.S. and Canadian estimates and where forest NEE was used as an approximation of stock change in Mexico (see Table 9.3). The stock change estimate for urban trees is distinguished from that of the forest sector, and the transfers and fluxes associated with the wood products pool are separated as well. Remaining land carbon gains occurred in smaller sinks associated with wetlands, urban trees in settled areas, grasslands, and agricultural soils, along with Arctic ecosystems and unmanaged boreal forests in Alaska and Canada. The stock change in each of these land ecosystems is approximated as their NEE estimates (see Table 2.2). In addition to the net gain in land ecosystems, a substantial amount of carbon was transferred laterally out of land ecosystems into aquatic ecosystems (507 Tg C per year; see Table 14.1) and pools of harvested products (155 Tg C per year; see Table 9.3). The large amount of carbon estimated as lateral fluxes from land ecosystems originates in atmospheric CO2 taken up by vegetation before being cycled through the soil pool and ultimately transported to aquatic systems. Similarly, the carbon in wood products also was taken up originally in forest trees before being removed in harvest. As such, the lateral transfer fluxes of carbon into both wood harvest and aquatic ecosystems are added to net stock change estimates to calculate an overall apparent net absorption of atmospheric CO2 by North American land ecosystems (959 Tg C per year).
Net ecosystem flux into North American land ecosystems from the atmosphere is an estimated 959 Tg C per year (see Figure 2.3). Of that amount, about 371 Tg C per year (or approximately 40%) is returned to the atmosphere through a combination of emissions from both inland waters (247 Tg C per year, which include emissions from rivers, streams, lakes, and reservoirs; see Table 14.1) and from woody biomass removal and use (124 Tg C per year; see Table 9.3). The rest of the lateral carbon transfers are stored as sediments in inland waters (155 Tg C per year; see Table 14.1), stored as wood in the products pool (31 Tg C per year; see Table 9.3), or exported to estuarine and coastal ocean systems (105 Tg C per year; see Table 14.1). Tidal wetlands are estimated to act as an additional small net sink of atmospheric CO2 (27 Tg C per year) that either is stored in sediment (9 Tg C per year) or transferred laterally to estuaries (16 Tg C per year) that represent a small net outgassing of CO2 (10 Tg C per year; see Ch. 15: Tidal Wetlands and Estuaries). Coastal ocean areas are estimated to be a substantial net sink of carbon from the atmosphere (160 Tg C per year; see Table 16.5) over the time period of analysis. Additional carbon is buried in estuary sediments (5 Tg C per year; see Ch. 15) and in the coastal ocean (115 Tg C per year; see Table 16.5). The remainder in the overall budget calculation represents a net export of carbon out of the continental system to the open ocean (151 Tg C per year; see Table 16.5).
Totaling all the vertical fluxes in Figure 2.3 amounts to an overall estimate of 1,009 Tg C per year added to the atmosphere from North America when considering all sources and sinks over the 2004 to 2013 time period. (Note that Table 2.2 provides a slightly different estimate of 1,008 Tg C per year due to rounding differences). In reconciling estimates of carbon stock change, fluxes, and lateral transfers across components in the overall budget, it is important to note that the total carbon from sedimentation, emissions, and export from inland waters (507 Tg C per year) represents carbon that has been taken up by terrestrial ecosystems and transferred laterally to inland waters. As such, this substantial amount of carbon is accounted for in the net ecosystem uptake estimate (959 Tg C per year) within the continental-scale, mass-balance budget (see Figure 2.3). Forest carbon budgets track the loss of carbon but may not distinguish between direct losses to the atmosphere and losses to streams and lakes, from which there are CO2 emissions to the atmosphere. Thus, there is potential for an unknown amount of double-counting of CO2 emissions assumed to be heterotrophic respiration in forest ecosystem models and CO2 emissions observed from inland water bodies and coastal margins. On the other hand, some of the CO2 assumed lost from terrestrial ecosystems may in fact be accumulating in lake and ocean sediments.
2.3.4 Determining Coastal Ocean and Methane Impacts
The coastal margin sources and sinks within North America’s carbon budget are not well understood, although land margin ecosystems provide a critical link in the lateral transport of carbon from land to ocean (Battin et al., 2009). This knowledge gap is largely due to limited information about the magnitude, spatial distribution, and temporal variability of carbon sources and sinks in coastal waters. Information from North America’s estuaries indicates that they act as carbon sources and include 12% of global estuary emissions (Chen et al., 2013). The coastal ocean and continental shelf regions are estimated net sinks for carbon (Bourgeois et al., 2016; Laruelle et al., 2015), but upwelling regions can be “hotspots” of emissions during upwelling events (Reimer et al., 2013), resulting in current debate about the processes governing carbon dynamics in the coastal ocean (Cai 2011).
The potential benefits of the North American CO2 sink (i.e., mitigating against the buildup of GHGs in the atmosphere) may be negated wholly by emissions of non-CO2 GHGs such as CH4 and nitrous oxide (N2O; Tian et al., 2015, 2016). North America is a net source of CH4 to the atmosphere, and isotopic approaches to partition global integrated measurements of δ13C-CH4 confirm a large source from agriculture, wetlands, and fossil fuels (Dlugokencky et al., 2009; Kirschke et al., 2013). The Global Carbon Project recently estimated global and regional CH4 sources and sinks for the 2003 to 2012 time period using both bottom-up and top-down approaches (Saunois et al., 2016). For North America, inventory-based estimates of anthropogenic CH4 sources (e.g., fossil fuels, agriculture, and biofuels) ranged from 38 to 49 Tg CH4 per year, while modeling estimates of CH4 emissions from wetlands ranged from 23 to 80 Tg CH4 per year (see Figure 2.4). Compared to these bottom-up estimates, the top-down CH4 emissions estimates based on AIM approaches generally were lower for natural sources (17 to 52 Tg CH4 per year) but similar for anthropogenic sources (25 to 61 Tg CH4 per year). Methane sinks include the oxidation of CH4 either from reactions with atmospheric hydroxyl radicals or from methanotrophy in upland soils, estimated for North America to be from 5 to 16 Tg CH4 per year (Kirschke et al., 2013). Confidence in estimates of CH4 emissions typically is low at all spatial scales (Brandt et al., 2014; Kirschke et al., 2013; Miller et al., 2013). Wetland emissions uncertainty is dominated by inaccuracies in location, extent, and seasonal dynamics of the CH4-producing area (Desai et al., 2015), and anthropogenic emissions uncertainty is related to oil and gas production and distribution (Brandt et al., 2014; Frankenberg et al., 2016; McKain et al., 2015). Uncertainties from energy-related activities derive from knowing neither the actual extent and duration of gas flaring, nor the magnitude of leakage from pipelines, distribution systems, and other point sources. A recent example is the Aliso Canyon, California, gas leak that released about 97 gigagrams of CH4 to the atmosphere (Conley et al., 2016). Although this gas leak was measured and monitored, it was undetected for a time. The number of other leaks that may have gone undetected or unmeasured, and for how long, is uncertain.
See Full Chapter & References