<b>Schuur</b>, E. A. G., A. D. <b>McGuire</b>, V. <b>Romanovsky</b>, C. Schädel, and M. Mack, 2018: Chapter 11: Arctic and boreal carbon. In Second State of the Carbon Cycle Report (SOCCR2): A Sustained Assessment Report [Cavallaro, N., G. Shrestha, R. Birdsey, M. A. Mayes, R. G. Najjar, S. C. Reed, P. Romero-Lankao, and Z. Zhu (eds.)]. U.S. Global Change Research Program, Washington, DC, USA, pp. 428-468, https://doi.org/10.7930/ SOCCR2.2018.Ch11.
Arctic and Boreal Carbon
11.1.1 Drivers of Carbon Cycle Change
This assessment focuses on Arctic and boreal carbon pools and fluxes, particularly those included within the northern circumpolar permafrost (perennially frozen ground) zone, which includes tundra and a large fraction of the boreal biome. Current knowledge of the state of organic carbon in soils and vegetation is evaluated herein, along with the potential for these pools to change over time in response to disturbance regimes and changing climate. Changes in temperature and precipitation act as gradual “press” (i.e., continuous) disturbances that directly affect carbon stocks and fluxes by modifying the biological processes of photosynthesis and respiration (LTER 2007). Climate changes also can modify the occurrence and magnitude of biological disturbances such as insect outbreaks as well as abrupt physical disturbances such as fire, extreme drought, and soil subsidence and erosion resulting from ice-rich permafrost thaw. These “pulse” (i.e., discrete) disturbances often are part of the ongoing successional cycle in Arctic and boreal ecosystems, but changing rates of occurrence alter the landscape distribution of successional ecosystem states, in turn, affecting landscape carbon storage. This overview introduces recent and expected trends in these drivers; their combined impact on carbon pools and fluxes is detailed later in the chapter.
Continuous Press Disturbances: Temperature, Precipitation
The most pronounced change in high-latitude climate during the last 40 to 50 years is the increase in mean annual surface air temperatures (see Figure 11.1). Global temperature change is amplified in high-latitude regions, as seen in the Arctic where temperature rise is about 2.5 times faster than that for the whole Earth (IPCC 2013). Air temperature increased in the Arctic by 1 to 2°C over the last 20 to 30 years (Overland et al., 2014). This increase was even more substantial (>3°C) in some regions of the Arctic Ocean and over the central and eastern parts of the Canadian Arctic Archipelago. Warming is most noticeable during the winter, but summer temperatures also are on the rise, and this differential is expected to continue in the future. The average air temperatures in the cold season (November through April) in Alaska, northern Canada, and in a large portion of Siberia have increased by 2 to 4°C between 1961 and 2014. In contrast, the temperature increase in the warm half of the year (May through October) was between 1 and 2°C for the same regions and time interval (data.giss.nasa.gov/gistemp/maps).
Figure 11.1: Difference in Mean Annual Arctic Surface Air Temperatures (in oC) Between the Period 2001 to 2015 and the Baseline Period 1971 to 2000
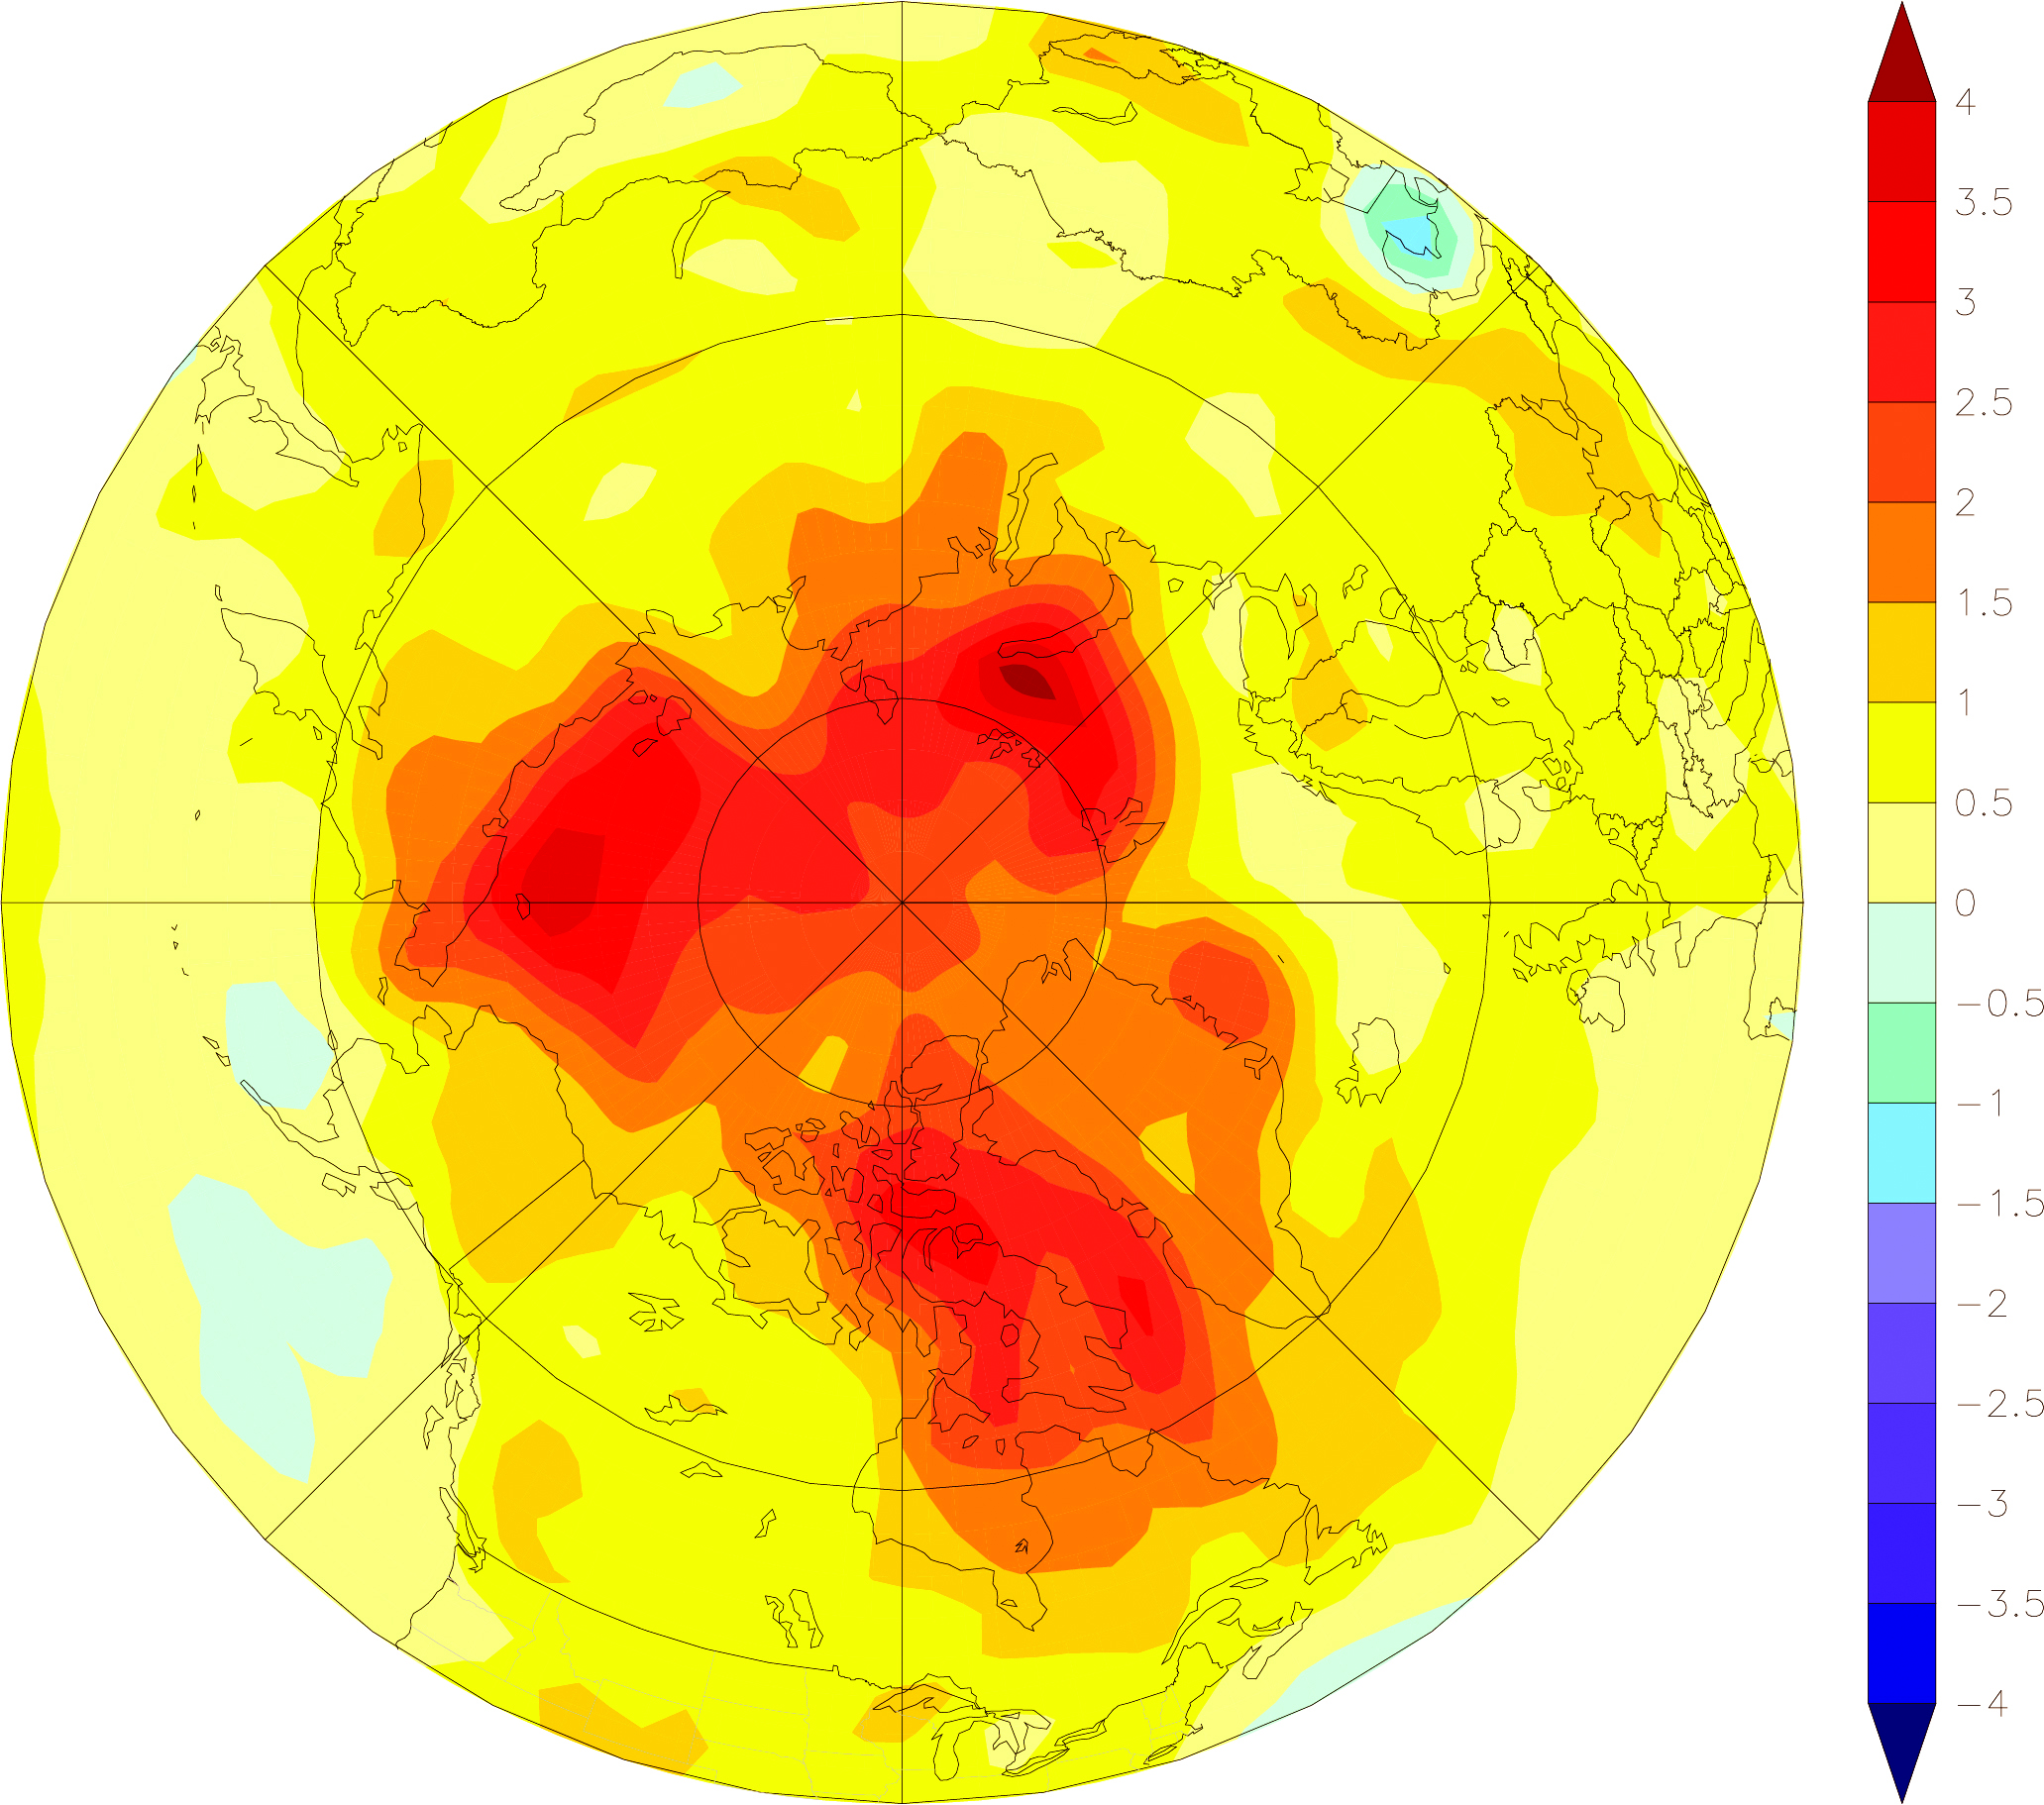
The degree of projected future warming—dependent on the scenario of changes in greenhouse gas (GHG) emissions through time—ranges widely for different Earth System Models (ESMs). By 2050, the differences in these projections as a result of various Representative Concentration Pathway (RCP) forcing scenarios (e.g., RCP4.5 and RCP8.5) are not large. Averaged across 36 ESMs, the projected mean annual air temperature increases for 60°N to 90°N by 2050 is about 3.7°C compared to the 1981 to 2005 period 2°C increase in the summer and 5.3°C increase in the winter (Overland et al., 2014). However, projections for 2100 differ significantly for RCP4.5 and RCP8.5. For 2100, the same models project a 4.3°C increase in mean annual temperature for RCP4.5 and an 8.7°C increase for RCP8.5. The summers are predicted to be warmer by 2.3°C for RCP4.5 and by 5.1°C for RCP8.5; winter temperatures are projected to rise by 6 and 12.5°C, respectively. Projected changes in precipitation are less consistent and vary significantly from region to region and over different time intervals. However, most models project increasing precipitation in the Arctic, especially in the winter. The percentage increases are largest in the cold season and, as a result of the RCP8.5 scenario, over the Arctic Ocean (IPCC 2013).
Permafrost is technically defined as subsurface Earth materials (e.g., rock, soil, and ice) remaining <0°C for at least 2 consecutive years. Observed changes in climate triggered a substantial increase in permafrost temperatures during the last 40 years (Romanovsky et al., 2010, 2016; Smith et al., 2010). Based on data from a selection of sites with both long-term records and good geographical coverage, annual mean permafrost temperatures generally have been increasing (Noetzli et al., 2016; Romanovsky et al., 2016; see Figure 11.2). The greatest temperature increase is found in colder permafrost (approximately –15 to –2°C) in the Arctic where current permafrost temperatures are more than 2 to 2.5°C higher than they were 30 years ago. In areas with warmer permafrost (approximately –2 to 0°C)—such as the southern and central Mackenzie Valley, interior Alaska, Siberia’s discontinuous permafrost zone, and the Nordic region—the absolute temperature change in permafrost has been much smaller, with increases generally less than 1°C since the 1980s.
Figure 11.2: Deep Permafrost Temperature Across a Latitudinal Transect in Alaska

Permafrost change in these warmer regions typically involves near-surface degradation, as measured by the thickness of the seasonally thawed layer at the soil surface, which thaws in summer and refreezes in winter. This parameter is defined as the active layer thickness (ALT), the maximum thaw depth at the end of the summer. ALT responds more to short-term variation in climate as compared to the deeper ground temperature. Ground-based records of ALT, therefore, exhibit greater interannual variability, primarily in response to variation in summer temperature (Smith et al., 2009). Although decadal trends in ALT vary by region (Shiklomanov et al., 2012), most regions where long-term ground-based ALT observations are available show an increase in ALT during the last 5 to 10 years (Romanovsky et al., 2016). These measured ALT increases actually may underestimate surface permafrost degradation because the ground surface can settle with permafrost thaw, obscuring actual changes in the permafrost surface using this metric (Shiklomanov et al., 2013). Recently, several direct and indirect remote-sensing methods were proposed for regional ALT estimations over large geographical areas using both airborne and spaceborne sensors (Gogineni et al., 2014; Liu et al., 2012; Pastick et al., 2013). However, these methods are still in development and thus are not yet used in an operational mode. The increase in ground surface temperatures over the last 30 years triggered long-term permafrost thaw in natural conditions at many locations not only within the discontinuous permafrost zone, but also in the cold continuous permafrost (Drozdov et al., 2012; James et al., 2013; Liljedahl et al., 2016; Malkova et al., 2014; Melnikov et al., 2015).
Episodic Pulse Disturbances: Wildfire, Abrupt Thaw
Beyond documented change in climate that has affected permafrost directly as a press disturbance, recent observations suggest that climate-sensitive pulse disturbance events, such as wildfire and abrupt permafrost thaw, are increasing in frequency, intensity, and extent across many high-latitude regions. Shifts in pulse disturbances are propelled by gradual climate warming (Jorgenson 2013); extreme weather events (Balser et al., 2014); insect and disease outbreaks (Kurz et al., 2008); and interactions among disturbances, such as those between abrupt thaw and wildfire (Hu et al., 2010; Jones et al., 2015; Lara et al., 2016) or human activities (Jorgenson et al., 2006).
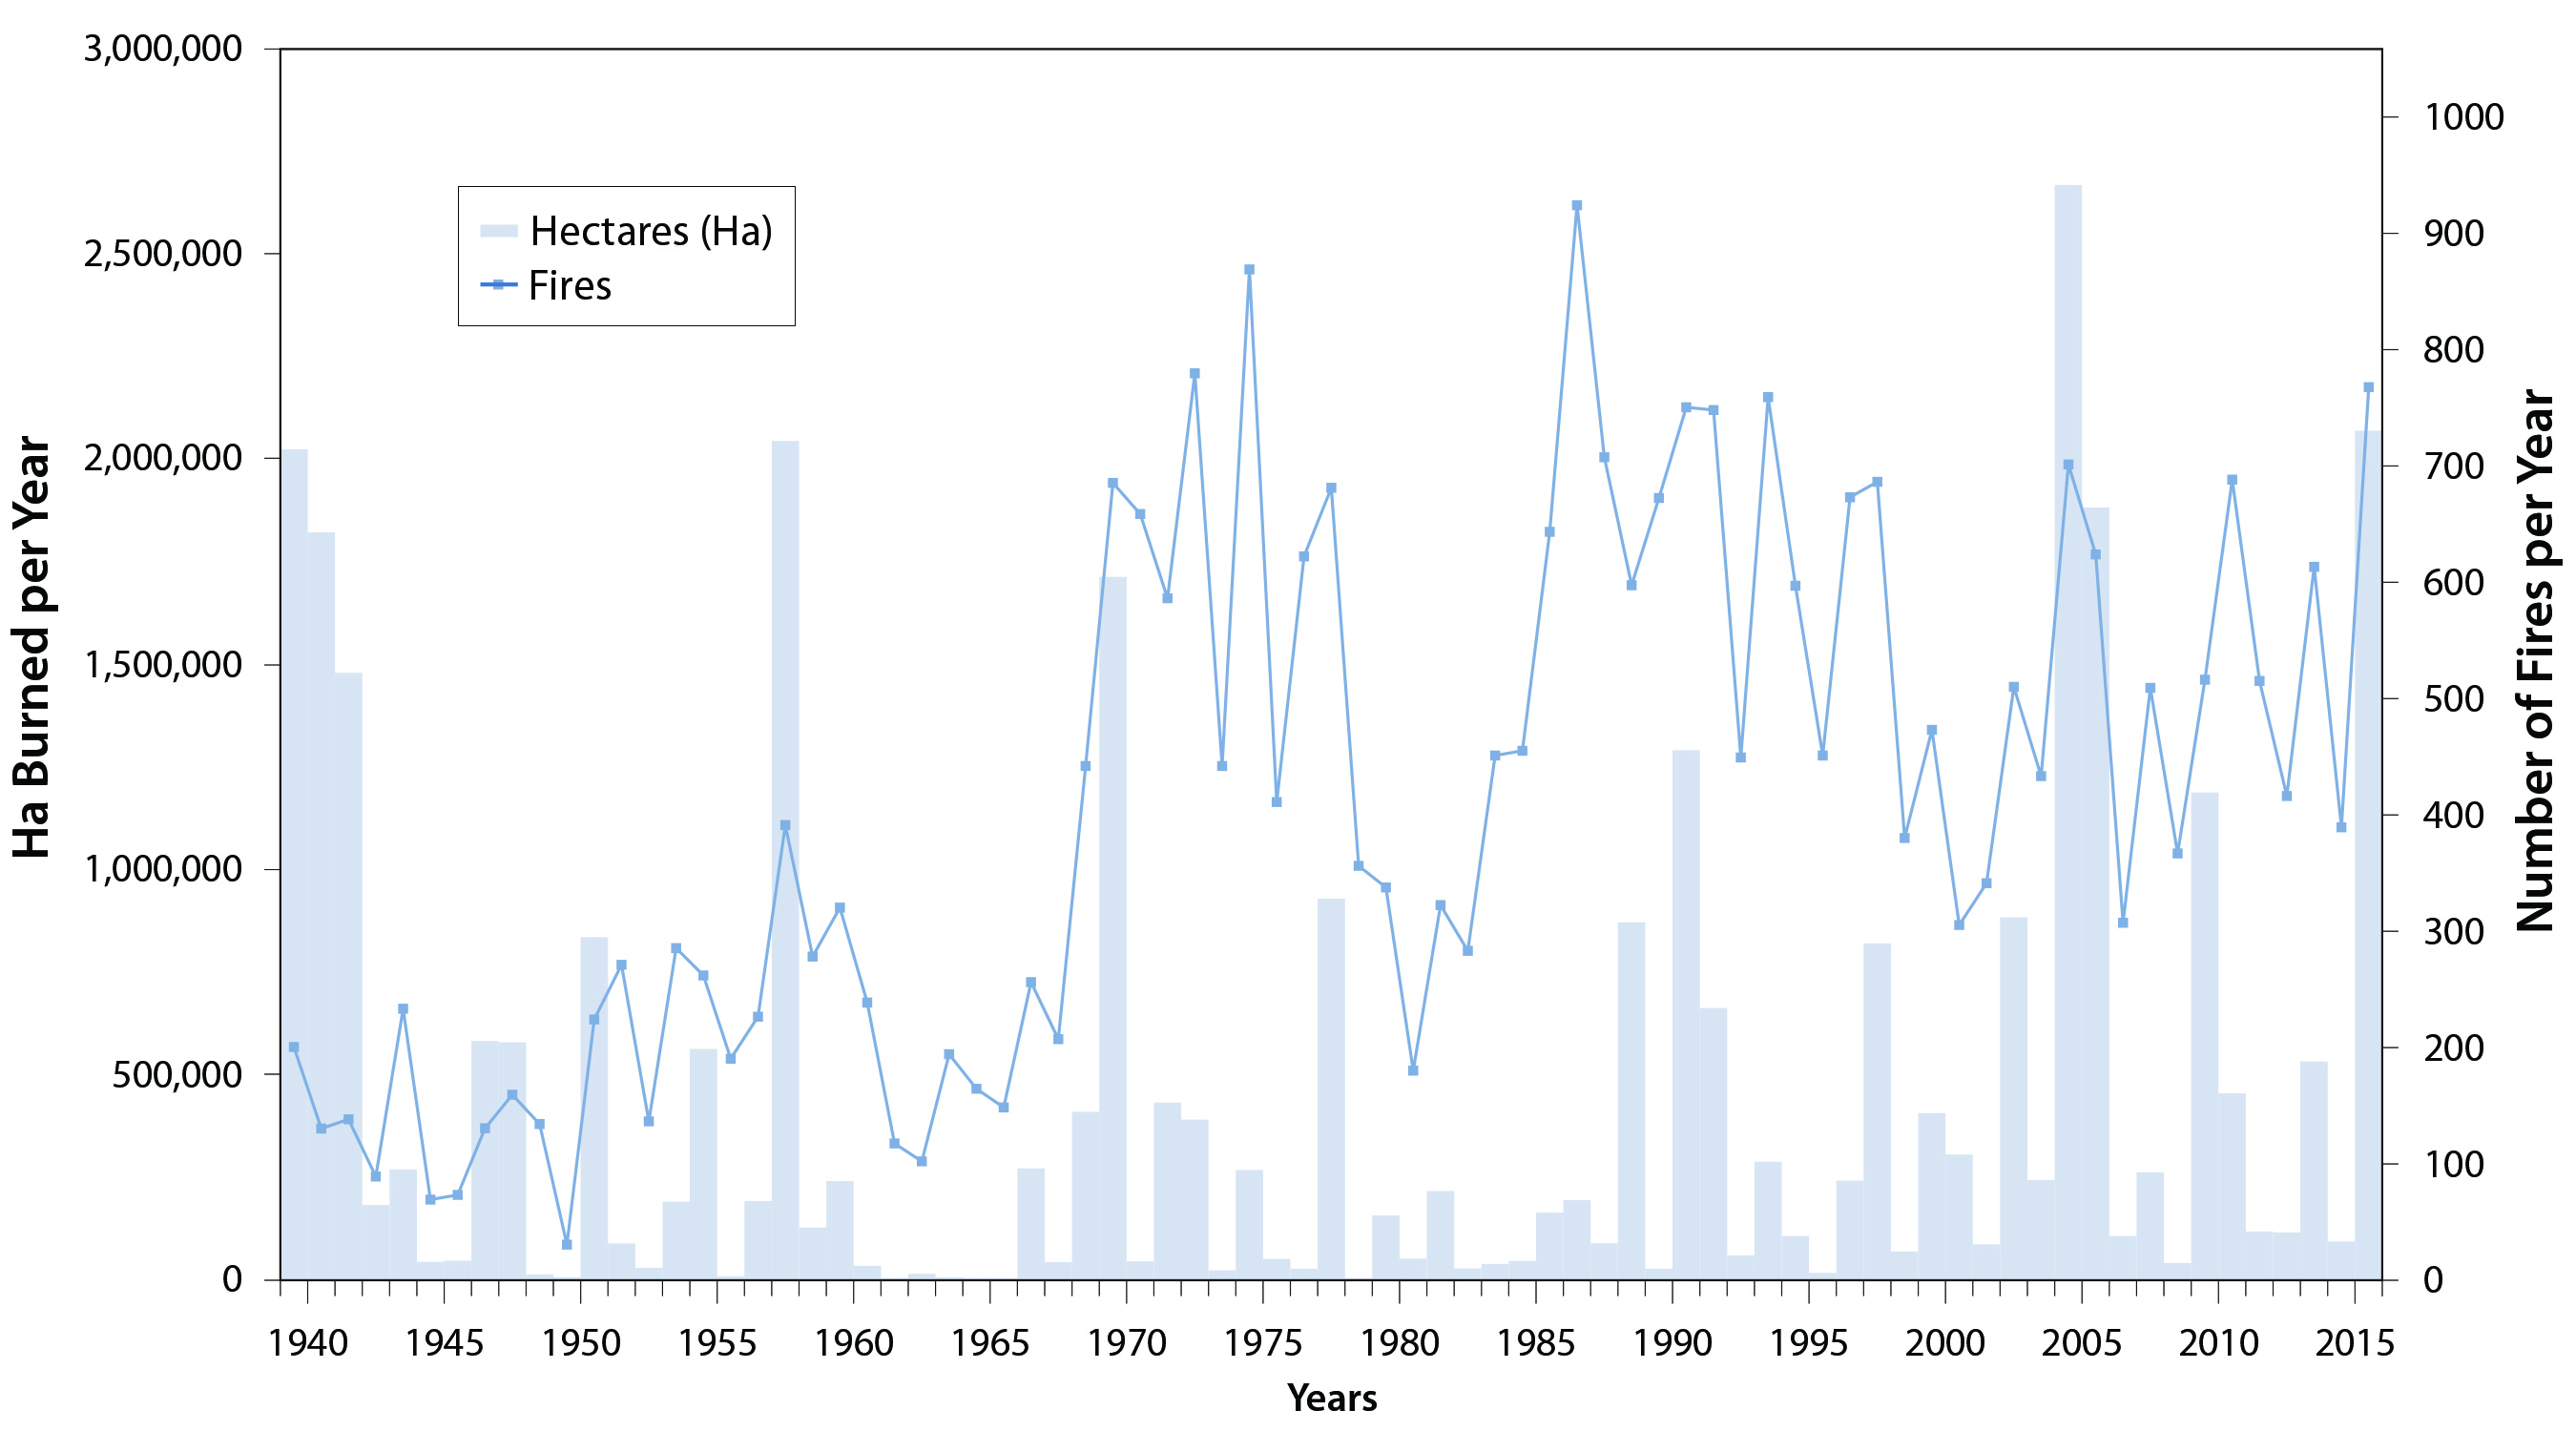
Of all pulse disturbance types, wildfire affects the most land area annually and is currently the best characterized at the regional to continental scale. Fire activity is intimately coupled to climatic variation in regions where fuel buildup is not limiting to burning (van Leeuwen et al., 2014). Recent climate warming has been linked to increased wildfire activity in the boreal forest regions of Alaska (see Figure 11.3; Kelly et al., 2013) and western Canada (Flannigan et al., 2009; Kasischke and Turetsky 2006), where fire has been part of historic disturbance regimes (Johnson 1992). Based on satellite imagery, an estimated 8 million hectares (ha) of boreal area was burned globally per year from 1997 to 2011 (Giglio et al., 2013; van der Werf et al., 2010). Roughly 50% of this burned area is forested; the rest is classified as low-density forest savanna, shrubland, or, in the case of boreal Eurasia, cropland. Eurasian boreal forests account for 69% of global boreal forest area and approximately 70% of the boreal area burned (Giglio et al., 2013). However, extreme fire years in northern Canada during 2014 and Alaska during 2015 doubled the long-term (1997 to 2011) average area burned annually in this region, surpassing Eurasia to contribute 60% of the global boreal area burned (Giglio et al., 2013; Mu et al., 2011; Randerson et al., 2012; van der Werf et al., 2010). These extreme North American fire years were balanced by lower-than-average area burned in Eurasian forests, resulting in a 5% overall increase in global boreal area burned. Decadal trends (Flannigan et al., 2009; Kasischke and Turetsky 2006) and paleoecological reconstructions (Kelly et al., 2013) support the idea that area burned, fire frequency, and extreme fire years are higher now than in the first half of the last century, or even the last 10,000 years.
Figure 11.3: Wildfire Occurrence in Alaska from 1939 to 2015
Fire also appears to be expanding as a novel disturbance into tundra and forest-tundra boundary regions previously protected by cool, moist climate (Hu et al., 2010, 2015; Jones et al., 2009). The annual area burned in Arctic tundra is generally small compared to that in the forested boreal biome. However, the expansion of fire into tundra that has not experienced large-scale disturbance for centuries causes large reductions in soil carbon stocks (Mack et al., 2011), shifts in vegetation composition and productivity (Bret-Harte et al., 2013), and can lead to widespread permafrost degradation (Jones et al., 2015). In Alaska—the only region where estimates of burned area exist for both boreal forest and tundra vegetation types—tundra burning averaged approximately 0.3 million ha per year during the last half century (French et al., 2015), accounting for 12% of the average annual area burned throughout the state. Change in the rate of tundra burning projected for this century is highly uncertain (Rupp et al., 2016), but these regions appear to be particularly vulnerable to climatically induced shifts in fire activity. Modeled estimates range from a reduction in activity based on a regional process-model study of Alaska (Rupp et al., 2016) to a fourfold increase across the circumboreal region estimated using a statistical approach (Young et al., 2016).
Variability in northern fire regimes ultimately is a product of both climate and ecological controls over fuel characteristics and accumulation. Fire regime affects vegetation composition and productivity, creating the potential for fire-vegetation feedbacks to emerge that either increase or decrease fire activity at the regional scale. Although interannual variability in the fire regime is high across Alaska and western Canada, fire frequency and area burned have increased in recent years (Rupp et al., 2016). This trend is projected to continue for the rest of the century across most of this region for many climate scenarios, with the boreal region projected to have the greatest increase in total area burned (Balshi et al., 2009; Rupp et al., 2016). As fire activity increases, however, flammable vegetation, such as the black spruce forest that dominates boreal Alaska, is projected to decline as it is replaced by low-flammability deciduous forest. This shift in fuel flammability and accumulation rate could create regional-scale feedbacks that reduce the spread of fire on the landscape, even as the frequency of fire weather increases (Johnstone et al., 2011). In western Canada, by contrast, black spruce could be replaced by the even more flammable jack pine, creating regional-scale feedbacks that increase the spread of fire on the landscape (Johnson 1992). In tundra regions, graminoid (herbaceous, grass-like) tundra is projected to decrease in future climate scenarios, while flammable shrub tundra generally is projected to increase (Rupp et al., 2016). Similarly, tree migration into tundra could further increase fuel loading and flammability, creating novel fire regimes in these highly sensitive areas. Each of these scenarios has important implications for carbon release during fire.
11.1.2 Geographical Coverage
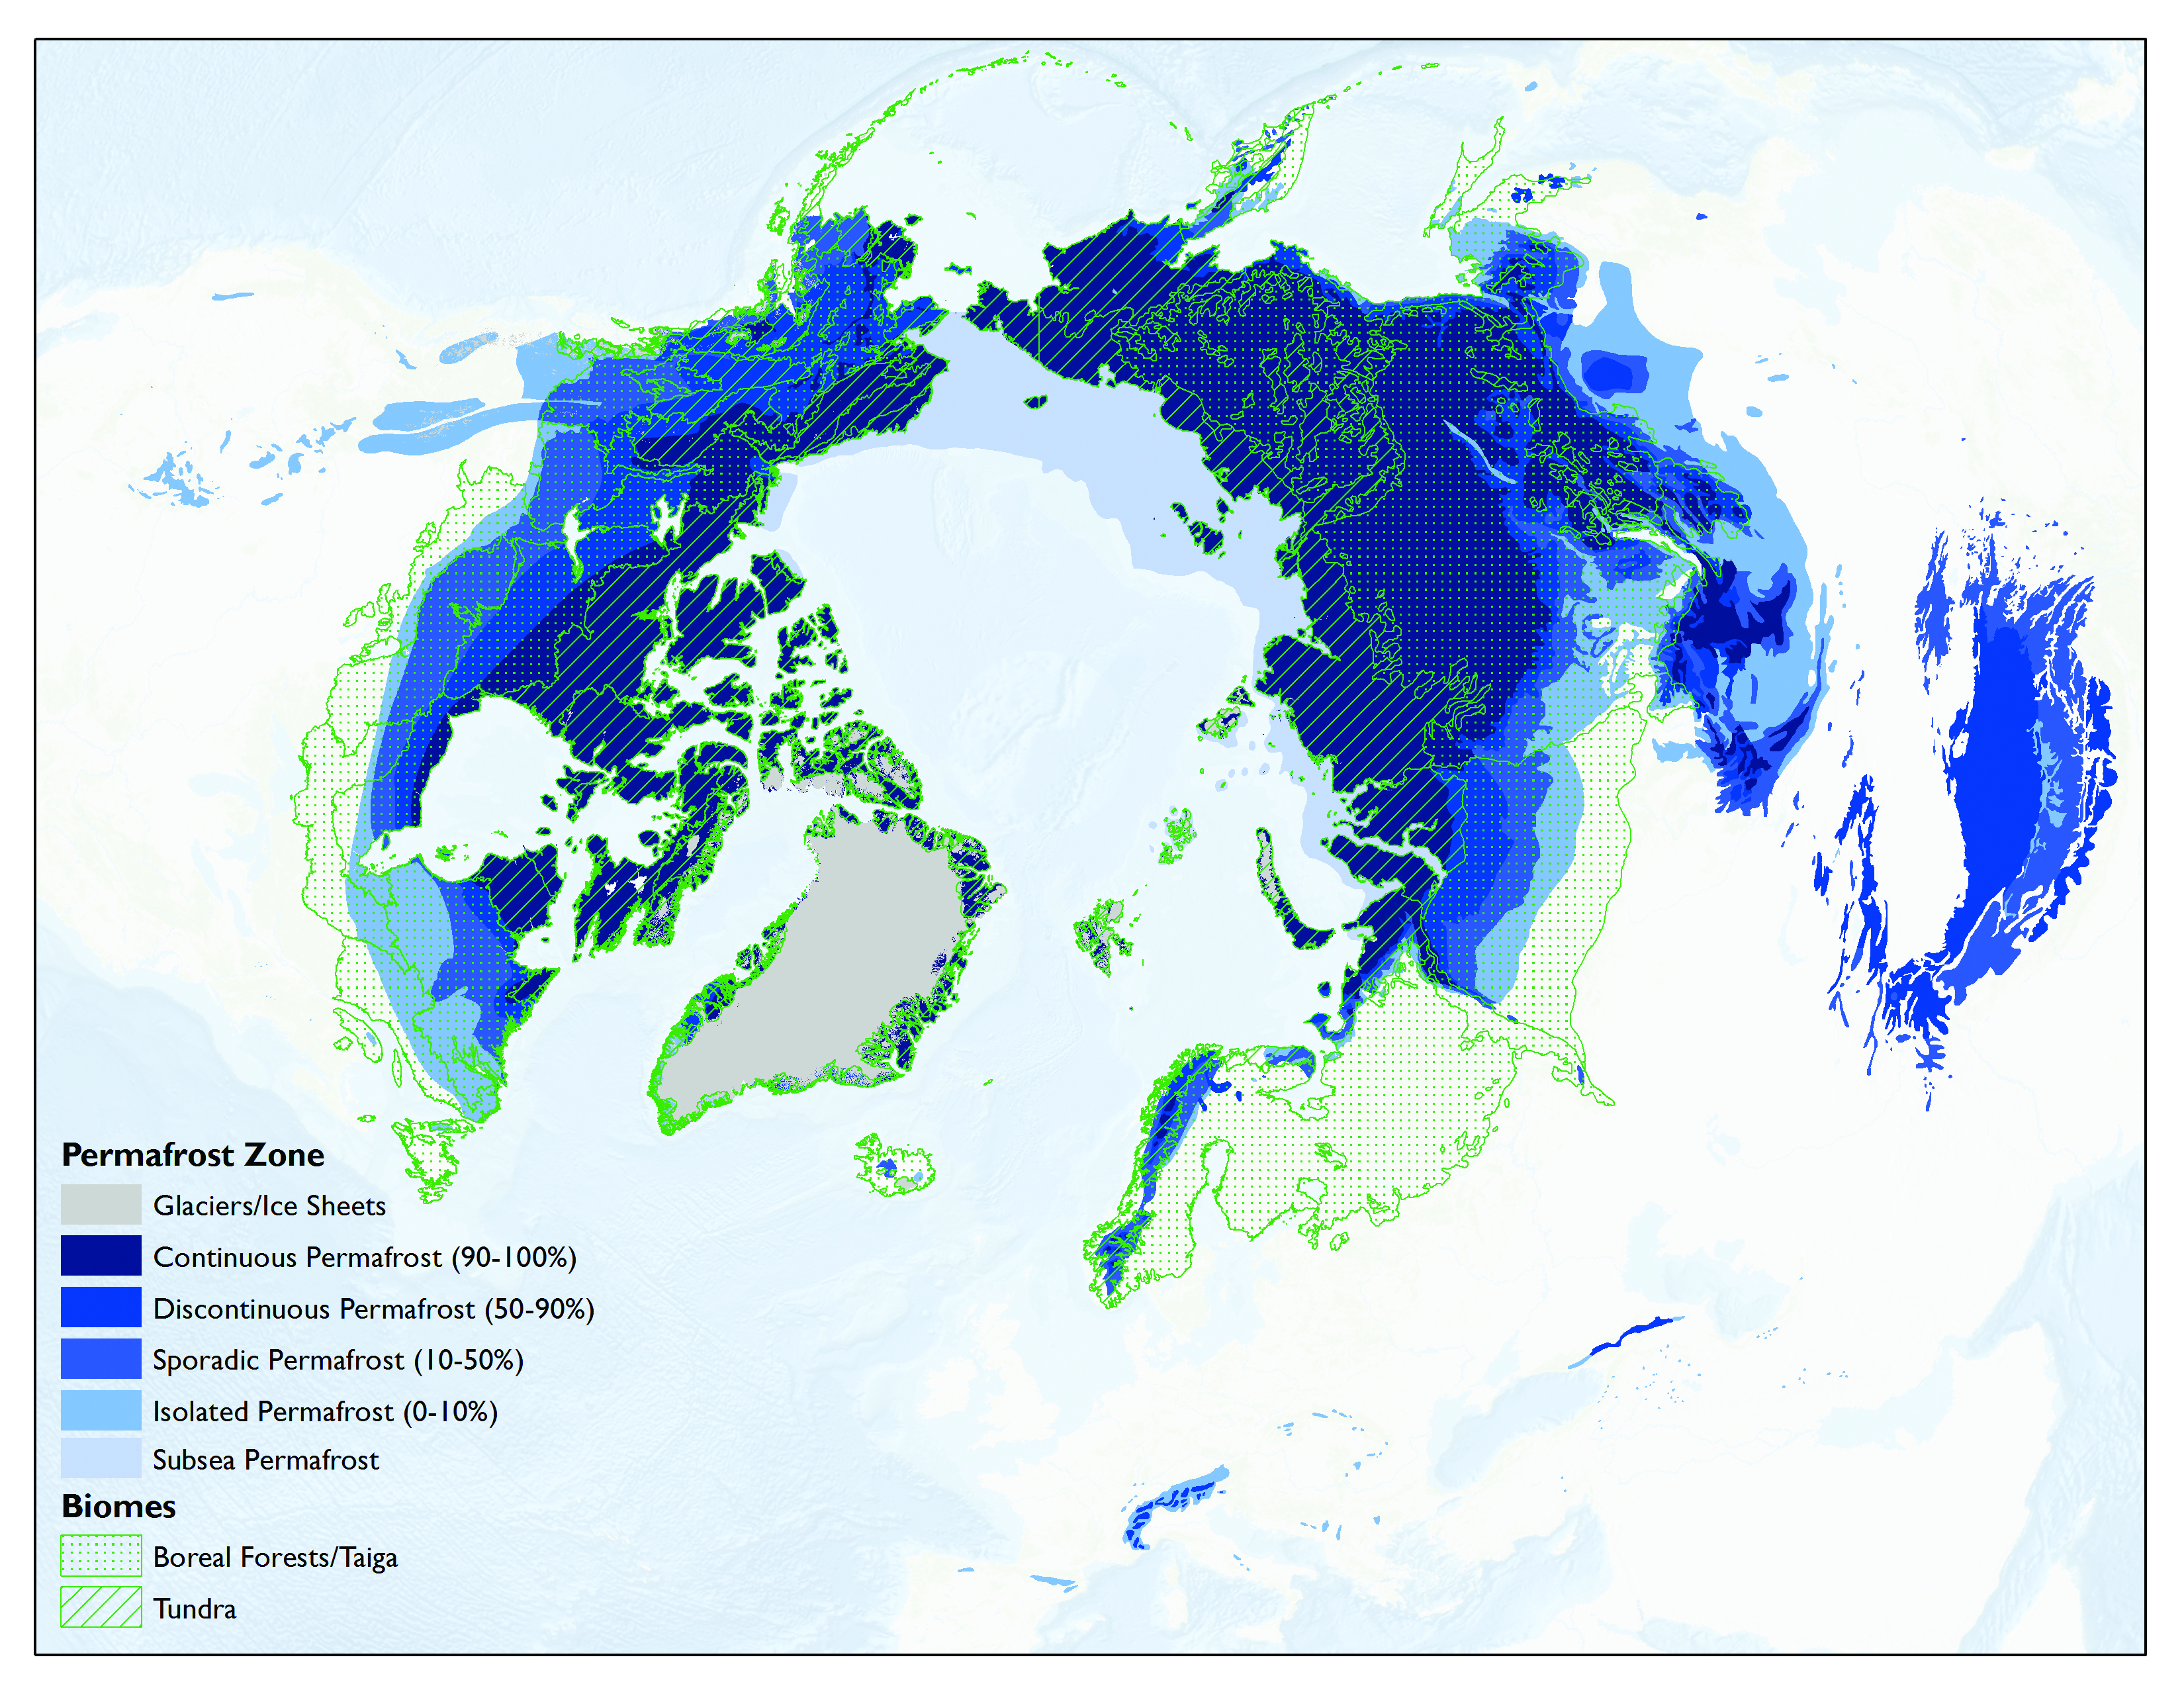
Most permafrost is located in the Northern Hemisphere, where the permafrost zone occupies 24% of the exposed land surface (22.8 × 10⁶ km2; Brown et al., 1998, revised February 2001; Zhang et al., 2000; see Figure 11.4). Within the Northern Hemisphere, 47% of the permafrost zone is classified as continuous permafrost, where >90% of the land surface is underlain by frozen ground. Another 19% is classified as discontinuous permafrost, where 50% to 90% of the land surface is underlain by frozen ground. The remaining 34% of the total permafrost zone is split between sporadic and isolated permafrost, where 10% to 50% and <10% of the land surface is underlain by frozen ground, respectively. Soils in this region cover 17.8 × 10⁶ km2; this subset of the entire permafrost zone excludes exposed bedrock, glaciers, ice sheets, and water bodies, which, with the exception of water bodies, contain little to no organic carbon stocks (Hugelius et al., 2014). Alaska, Canada, and Greenland comprise 39% of the soil area, and Eurasia (including Russia, Mongolia, and Scandinavia) comprises 61%. The northern circumpolar permafrost zone is used for soil carbon accounting and is largely comparable to most tundra and a large fraction of the boreal biome in the Northern Hemisphere but does not overlap with them completely (see Figure 11.4). Biome regions are used for vegetation carbon accounting and cover 5 × 10⁶ km2 (tundra) and 12 × 106 km2 (boreal forest), respectively (Jobbágy and Jackson 2000; Margolis et al., 2015; Neigh et al., 2013; Raynolds et al., 2012). The Tibetan plateau is outside of the geographical scope of this chapter described above. Permafrost underlays 1.35 × 10⁶ km2, 67% of the total plateau area, but is not classified within the tundra or boreal biome. Due to its permafrost, the soil carbon inventory is briefly discussed in this chapter in the context of the circumpolar permafrost zone soil carbon inventory.
Figure 11.4: Permafrost Zones and Biome Area for Tundra and Boreal Regions
11.1.3 Temporal Coverage
The Arctic is remote and understudied compared with more populated areas of Earth. As a result, state-of-the-art quantification of carbon pools still is being conducted for current conditions rather than as repeat measurements through time. However, a few sites have been recording time-series measurements of carbon fluxes over a few decades, although with severely restricted spatial coverage considering the large geographical scale of this domain (e.g., see Belshe et al., 2013). Observation-based changes in carbon cycling extend back to the 1970s, and this chapter focuses on historical model simulations that estimate the 50-year period from 1960 to 2009. Forward projections typically span the time frame until 2100 using future climate projections based on emissions scenarios from the Intergovernmental Panel on Climate Change (IPCC).
See Full Chapter & References