Birdsey, R., M. A. Mayes, P. Romero-Lankao, R. G. Najjar, S. C. Reed, N. Cavallaro, G. Shrestha, D. J. Hayes, L. Lorenzoni, A. Marsh, K. Tedesco, T. Wirth, and Z. Zhu, 2018: Executive summary. In Second State of the Carbon Cycle Report (SOCCR2): A Sustained Assessment Report [Cavallaro, N., G. Shrestha, R. Birdsey, M.A. Mayes, R. G. Najjar, S. C. Reed, P. Romero-Lankao, and Z. Zhu (eds.)]. U.S. Global Change Research Program, Washington, DC, USA, pp. 21-40, https://doi.org/10.7930/SOCCR2.2018.ES.
Executive Summary
In North America, GHGs are emitted primarily from fossil fuel burning; cement production; organic matter decomposition in inland lakes and rivers; land-use changes; and agricultural activities, particularly on drained peatland soils. Conversion of carbon gases (mainly CO2) to organic matter through photosynthesis occurs in forests, grasslands, other land ecosystems, and coastal waters. Just under one-half of CO2 emissions (43%) are offset by carbon sinks in the land and coastal waters. Compared to SOCCR1, this report defines more land and aquatic ecosystem components, providing an improved understanding of their respective roles in carbon cycling. Selected highlights about the North American carbon cycle follow.
Fossil Fuels Are Still the Largest Source
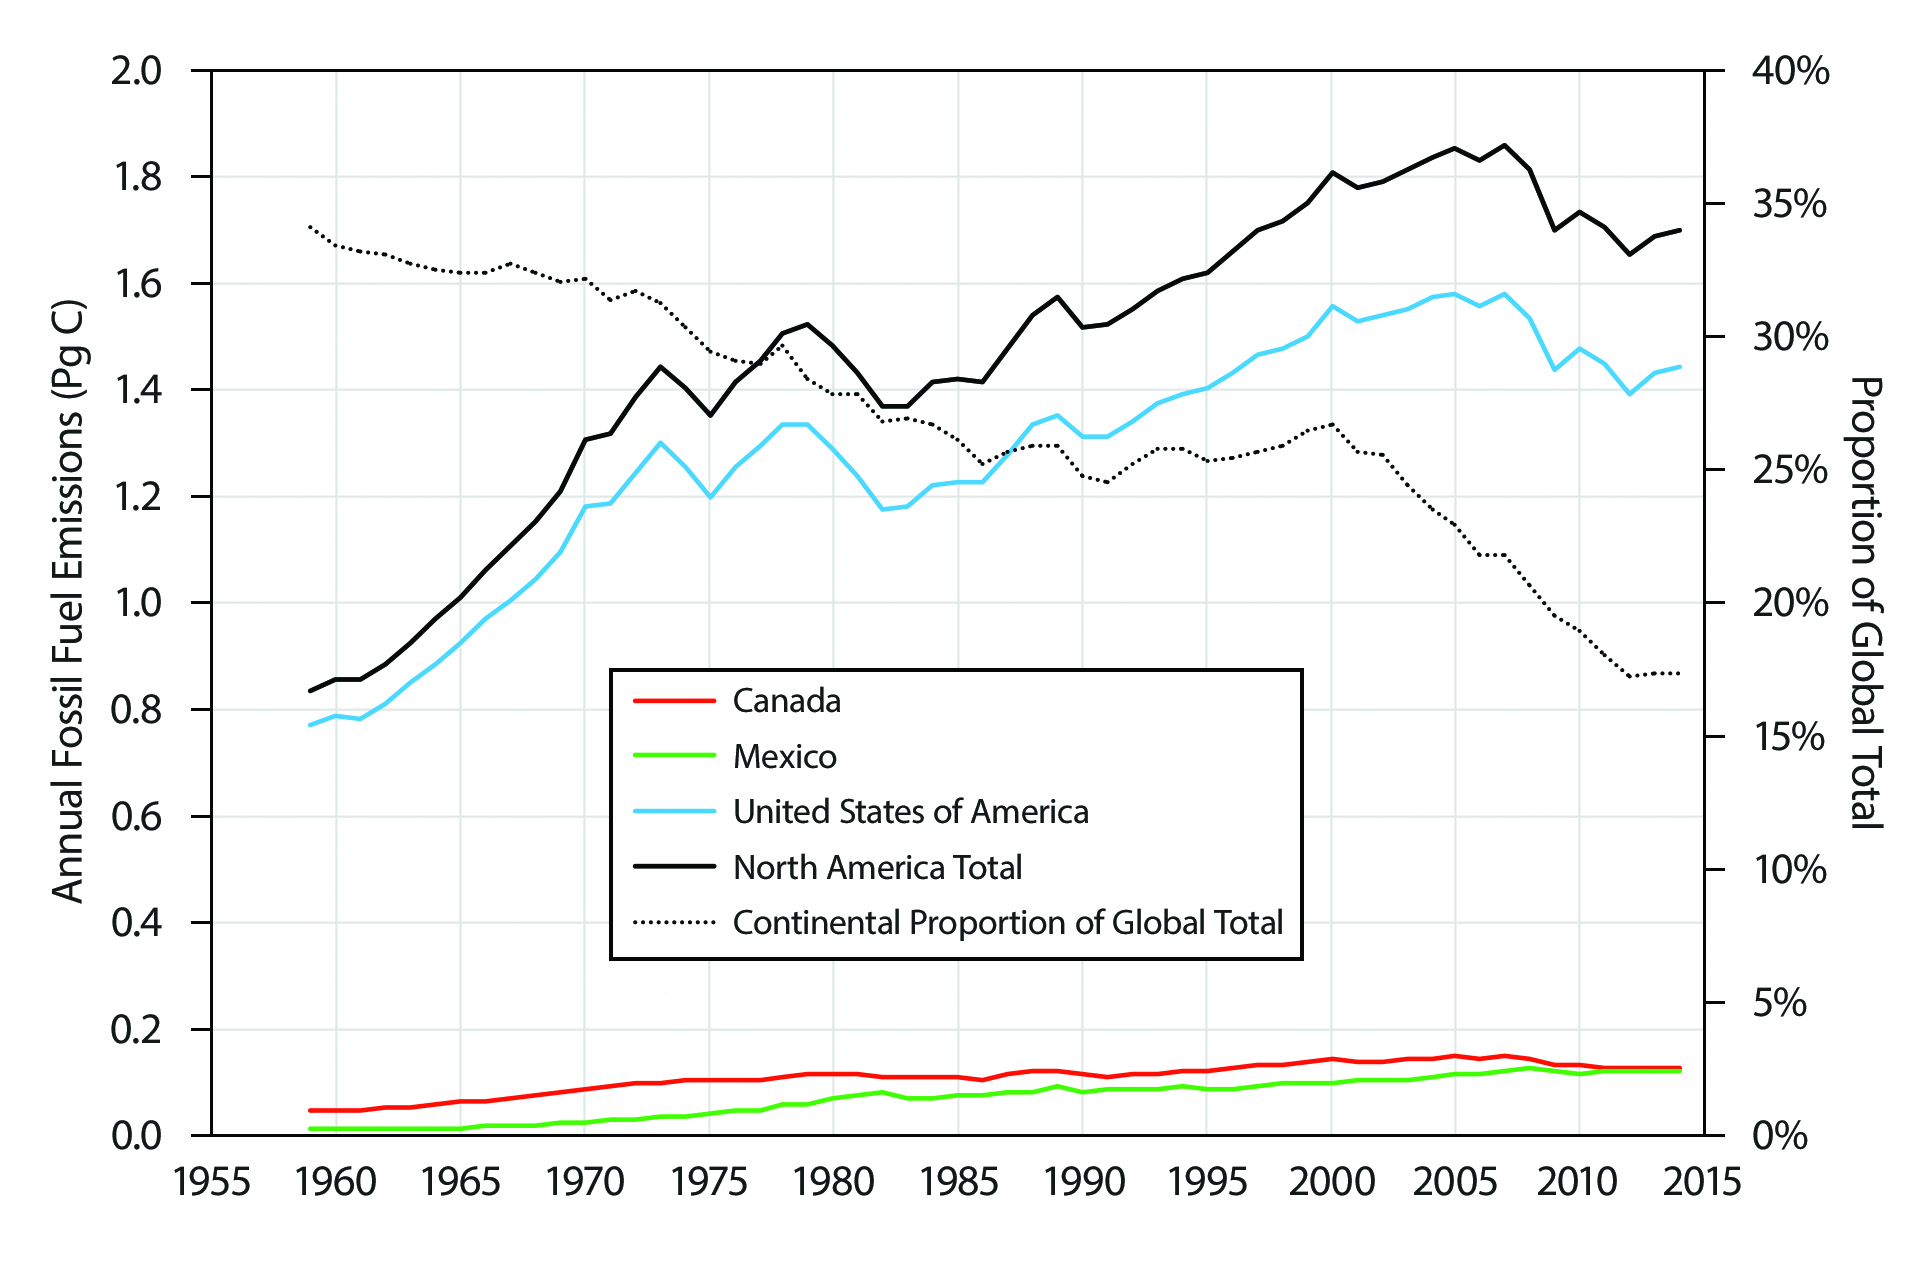
Carbon dioxide emissions from fossil fuels in North America averaged 1,774 teragrams of carbon (Tg C) per year (±6%) from 2004 to 2013 (see Figure ES.2). This estimate is similar to the 1,856 Tg C per year (±10%) reported for the decade prior to 2003 (CCSP 2007). From 2004 to 2013, CO2 fossil fuel emissions decreased about 1% per year because of various market, technology, and policy drivers, as well as the financial crisis (see Ch. 3: Energy Systems). During this same time period, North America likely acted as a net source of CH4 to the atmosphere, contributing on average about 66 Tg CH4 per year. Currently, the United States is responsible for about 85% of total fossil fuel emissions from North America. As of 2013, the continent contributes about 17% of total global emissions from fossil fuels, a decline from about 24% in 2004 because of increasing emissions elsewhere and reduced emissions in the United States (see Figure ES.5; Ch. 2: The North American Carbon Budget; Ch. 3: Energy Systems; and Ch. 8: Observations of Atmospheric Carbon Dioxide and Methane).
Figure ES.5: Annual North American Fossil Fuel Emissions from 1959 to 2014
Aquatic Ecosystems Are Both Sources and Sinks
Although SOCCR1 did not directly quantify net CO2 emissions from inland waters to the atmosphere, this report estimates those emissions at about 247 Tg C per year (±100%; see Figure ES.2; Figure ES.3; and Ch. 14: Inland Waters). Burial in lakes and reservoirs, which is part of the terrestrial carbon sink, is about 155 Tg C per year (±100%), a level much higher than a similar estimate made for SOCCR1 (25 Tg C per year ± 120%) but still within the uncertainty bounds of each estimate, making the identification of a trend impossible (see Figure ES.3 and Ch. 14). Lateral transfers from inland waters to estuaries total about 105 Tg C per year and from estuaries to the coastal ocean about 106 Tg C per year (±30%; see Ch. 14 and Ch. 15: Tidal Wetlands and Estuaries). The transfer from the coastal ocean to the open ocean is estimated to be 151 Tg C per year (±70%; see Ch. 16: Coastal Ocean and Continental Shelves). These estimates were not included in SOCCR1, except for transfers from rivers to coastal waters, which were estimated at 35 Tg C per year (±100%).
Carbon losses from inland waters in North America total about 507 Tg C per year (see Figure ES.3). Although there is a reasonably good basis for this estimate, knowledge of carbon sources to inland waters is extremely poor. The only source that has been estimated is the lateral transport of dissolved organic carbon from terrestrial wetlands, which equals only 16 Tg C per year. Other sources include different types of carbon from terrestrial wetlands (e.g., dissolved inorganic carbon and particulate carbon) and carbon from surface runoff, groundwater flow, and erosion. Assuming no accumulation of carbon in inland waters, these sources should total 491 Tg C per year (see Figure ES.3).
Three types of wetlands constitute small net sinks of CO2: 1) terrestrial nonforested wetlands, estimated at 60 Tg C per year; 2) forested wetlands, estimated at 67 Tg C per year (also included in the forestland category); and 3) tidal wetlands, estimated at 27 Tg C per year (see Figure ES.3; Ch. 13: Terrestrial Wetlands; and Ch. 15). Terrestrial wetlands are a natural source of CH4 (see Ch. 13), annually emitting an estimated 45 Tg of carbon as CH4 (±75%). Carbon moving in and out of terrestrial wetlands cannot be fully traced. The carbon budget (see Figure ES.3) does not balance because the net uptake from the atmosphere (82 Tg C per year equals CO2 uptake minus CH4 release) exceeds by 26 Tg C per year the sum of accumulation in vegetation (44 Tg C per year) and soils (48 Tg C per year) and the loss of dissolved organic carbon (16 Tg per year; see Figure ES.3).
Land and Coastal Waters Are a Net Sink
Natural sinks on North American land and adjacent coastal waters offset approximately 43% of the total fossil fuel emissions of CO2 from 2004 to 2013 (see Ch. 2: The North American Carbon Budget). The magnitude of the North American terrestrial sink estimated from “bottom-up” methods (i.e., inventory and biosphere-based approaches such as field measurements and ecosystem process models) is about 606 Tg C per year (±50%). This value is derived from estimates of net uptake by ecosystems and tidal wetlands minus emissions from harvested wood, inland waters, and estuaries (see Figure ES.2). The bottom-up estimate is about the same as the estimated 699 Tg C per year (±12%) inferred by “top-down” (atmospheric-based) observations but with larger uncertainties (see Ch. 2 and Ch. 8: Observations of Atmospheric Carbon Dioxide and Methane.).
The coastal ocean of North America (the Exclusive Economic Zone, not including tidal wetlands and estuaries) is an estimated sink of 160 Tg C (±50%) annually, based on estimates of air-sea carbon fluxes and a numerical model (see Figure ES.3). This net uptake from the atmosphere is driven primarily by fluxes in high-latitude regions (see Ch. 16: Coastal Ocean and Continental Shelves).
Soil Stocks
Carbon stocks in North American soils are estimated as 627 Pg C, representing more than 90% of the continent’s total carbon stocks including biomass (see Table 2.1 in Ch. 2: The North American Carbon Budget). Because soil carbon concentrations vary by depth, estimates of soil carbon depend on the soil depth considered in surveys, which often do not account for deeper soil carbon. Summing the estimates of organic carbon contained in soils to a depth of 1 m from Canada, the United States, and Mexico yields about 400 Pg C (see Ch. 12: Soils). Globally, stocks in the circumpolar Arctic and boreal regions are estimated as 1,400 to 1,600 Pg C based on inventories of soils and sediments to a 3-m or more depth. About one-third of this carbon is in North America (see Ch. 11: Arctic and Boreal Carbon).
Forests
Forests, including their soils, constitute the largest component of the land sink, taking up a net 217 Tg C per year (±25%) from 2004 to 2013 (see Ch. 9: Forests). Across the continent, afforestation added 27 Tg C per year and deforestation led to a loss of 38 Tg C per year (see Ch. 9). Woody encroachment, which refers to increasing density of woody vegetation on grasslands and shrublands, is part of the carbon sink, and it is included within the terrestrial categories of forests and grasslands as appropriate.
Agriculture
Agricultural GHG emissions totaled 567 Tg CO2 equivalent (CO2e)4 for the United States in 2015, 60 Tg CO2e for Canada in 2015, and 80 Tg CO2e for Mexico in 2014. These estimates do not include emissions from land-use change involving agriculture, as reported in each country’s GHG inventory submission to the United Nations Framework Convention on Climate Change. The major non-CO2 emissions from agricultural sources are N2O from cropped and grazed soils and manure and enteric CH4 emissions from livestock production (see Ch. 5: Agriculture). Because management plays a large role in determining the carbon cycle of agricultural systems, there are significant opportunities to reduce emissions and increase the magnitude of carbon sinks in these areas.
Arctic and Boreal Ecosystems
Arctic and boreal ecosystems are estimated to be a small sink of 14 Tg C annually (see Ch. 2: The North American Carbon Budget and Ch. 11: Arctic and Boreal Carbon). Confidence in this estimate is low because the extent to which these results overlap or leave gaps with other terrestrial categories, particularly boreal forests and terrestrial wetlands, is not clear due to the relatively limited data coverage for these northern ecosystems.
See Full Chapter & References