<b>Jacobson</b>, A. R., J. B. <b>Miller</b>, and K. R. <b>Gurney</b>, 2018: Appendix E. Fossil fuel emissions estimates for North America. In Second State of the Carbon Cycle Report (SOCCR2): A Sustained Assessment Report [Cavallaro, N., G. Shrestha, R. Birdsey, M. A. Mayes, R. G. Najjar, S. C. Reed, P. Romero-Lankao, and Z. Zhu (eds.)]. U.S. Global Change Research Program, Washington, DC, USA, pp. 839-843, doi: https://doi.org/10.7930/SOCCR2.2018.AppE.
Fossil Fuel Emissions Estimates for North America
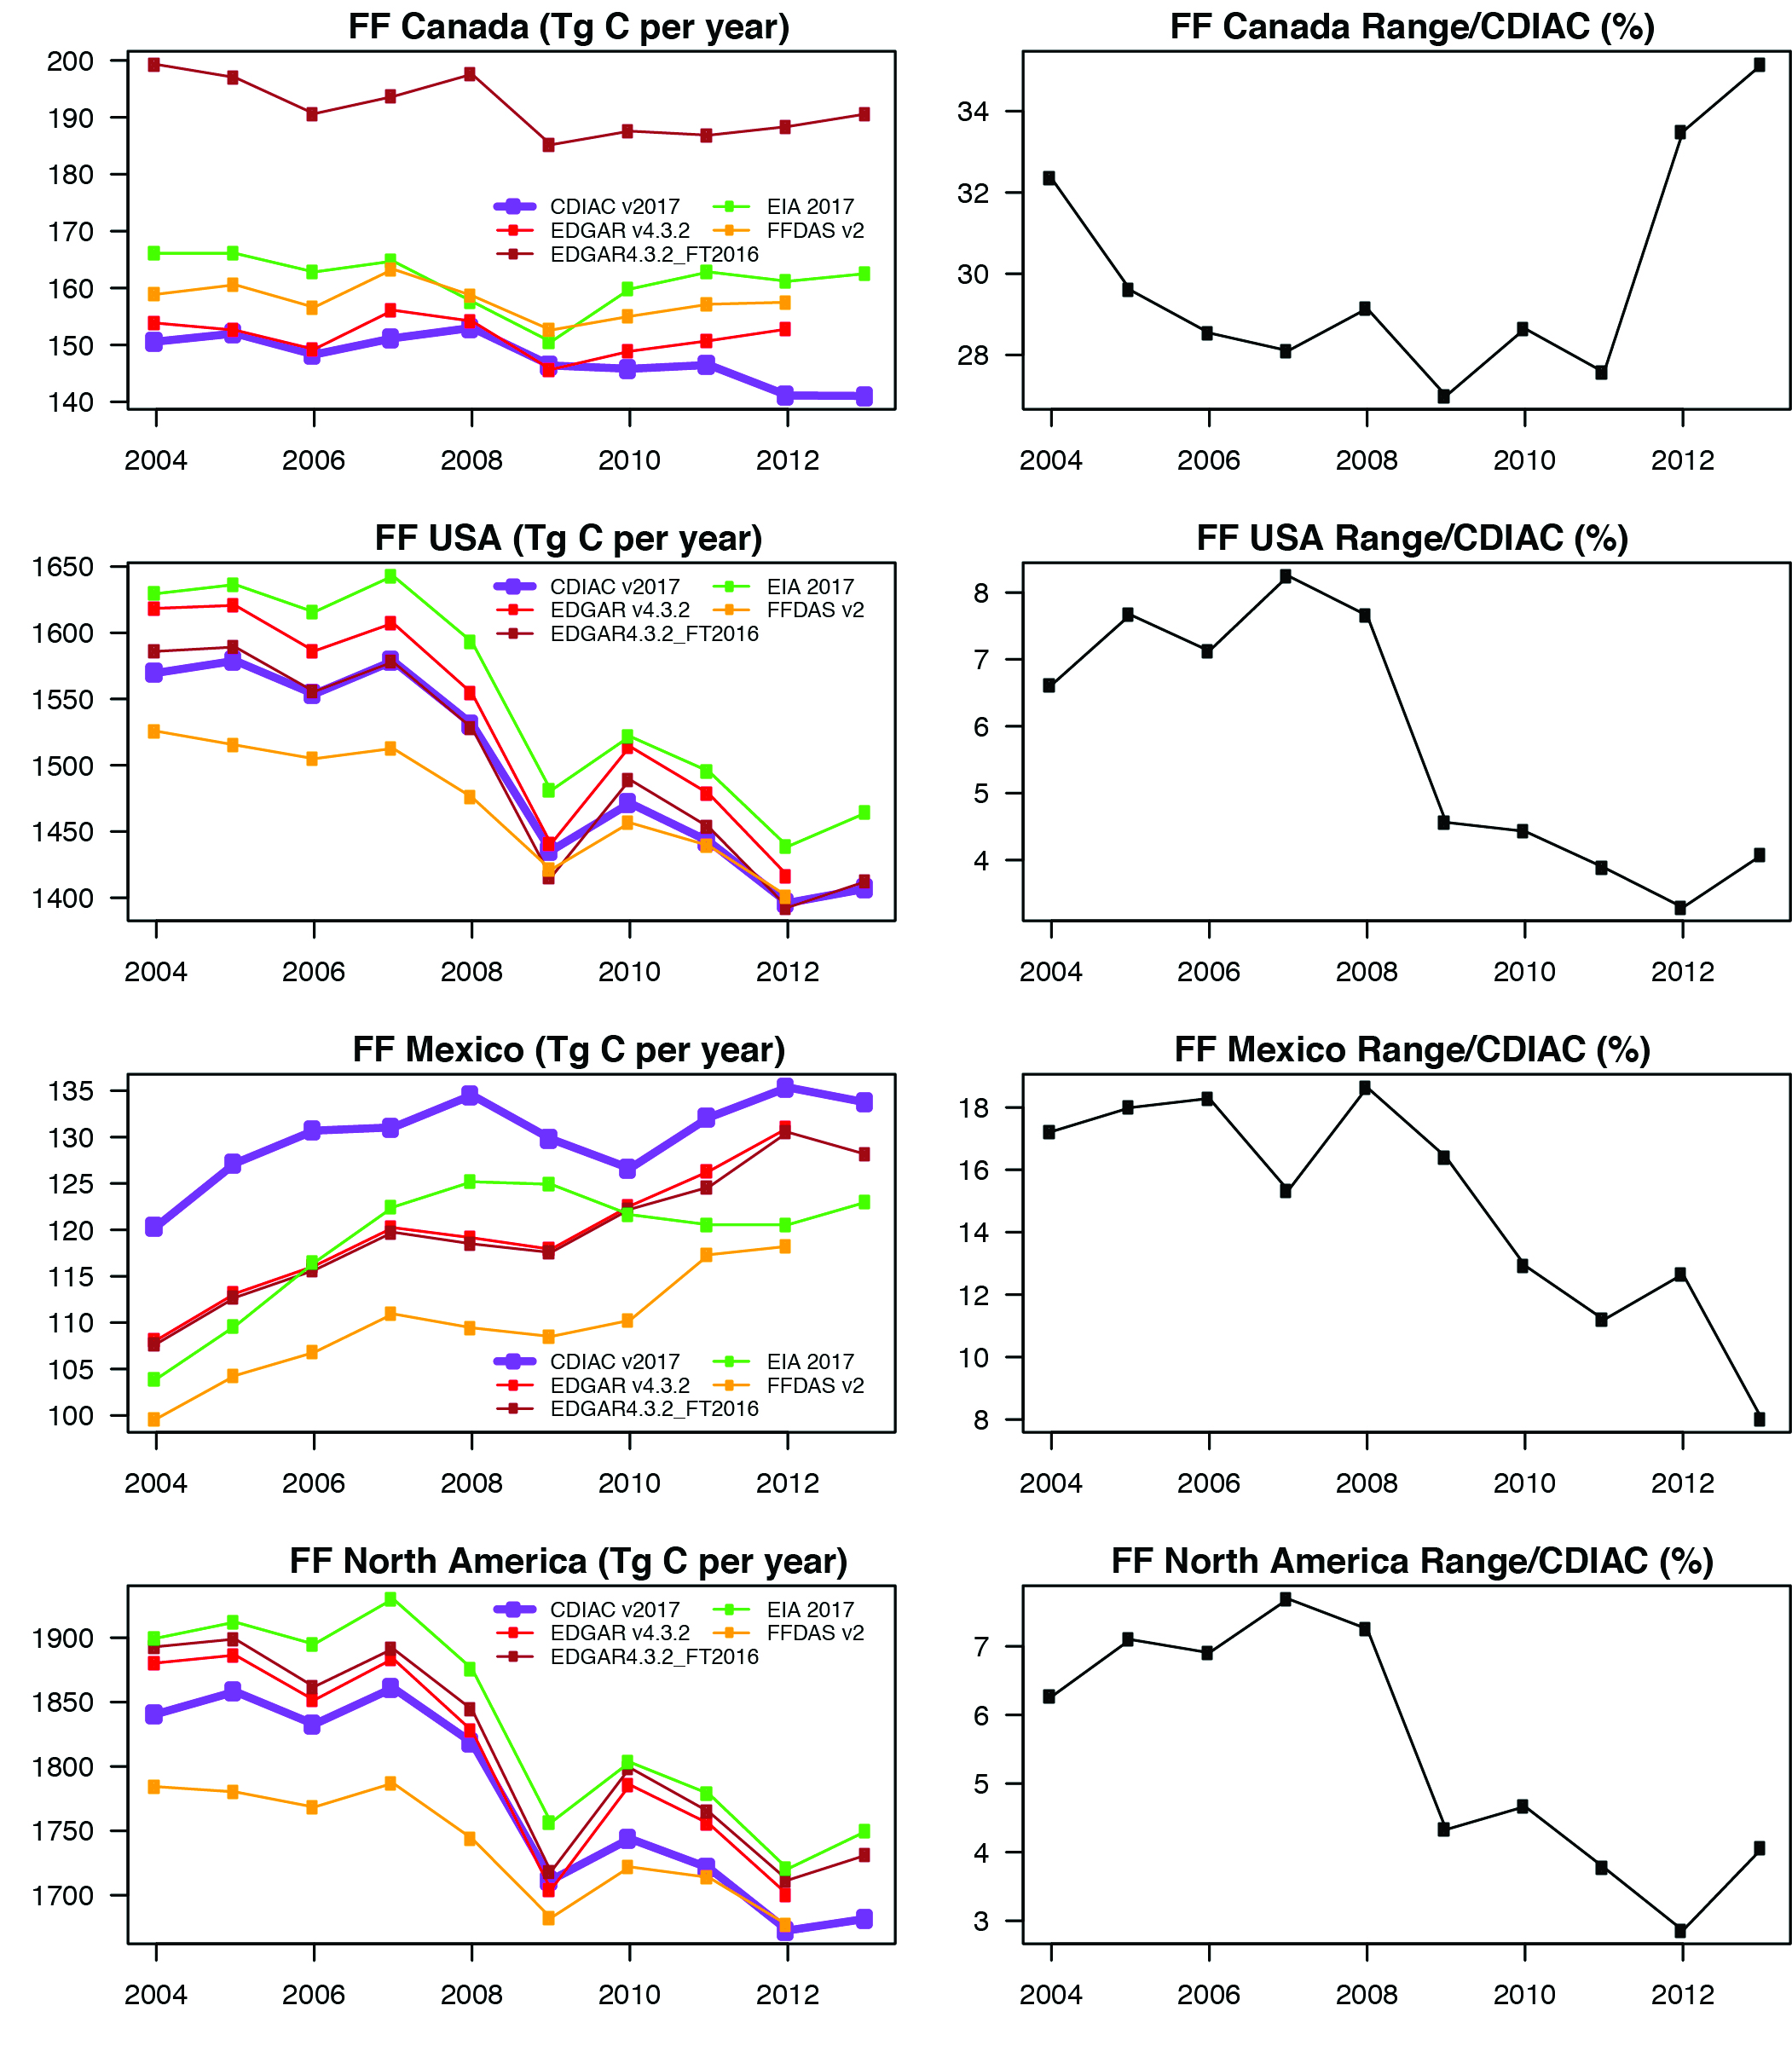
The CDIAC time series was chosen to represent fossil fuel emissions from Canada, the United States, and Mexico from 2004 to 2013. In part, this is due to CDIAC’s long historical coverage for all three countries and its clear definition of what goes into the country totals (e.g., Marland et al., 2007). Assigning an uncertainty to the CDIAC time series is a challenge. Andres et al. (2014) discuss various ways to characterize the uncertainty of the CDIAC product and suggest that a time-average uncertainty for the United States could be about 4% (2 standard deviations).
SOCCR1 (Marland et al., 2007) suggests ±5% for developed countries, concordant with International Energy Agency (IEA 2005; Marland et al., 2007) intercomparisons for developed countries (also 5%). Here, the fractional range of the five inventories listed previously is used, averaged over time, to represent the uncertainty. Note that some of these differences are driven by categorical differences in what is included, or not included, in the global inventories. The CDIAC time series is recognized as different from the mean of the five inventories. Results are shown in Table E.2 and Table E.3, this page, and Figure E.1.
Table E.2. North American Fossil Fuel Carbon Dioxide Emissionsa
| Year | Canada | United States | Mexico | North America |
|---|---|---|---|---|
| 2004 | 150.6 | 1569.7 | 120.3 | 1840.6 |
| 2005 | 152.0 | 1578.9 | 127.2 | 1858.1 |
| 2006 | 148.3 | 1553.7 | 130.7 | 1832.7 |
| 2007 | 151.2 | 1578.7 | 131.0 | 1860.9 |
| 2008 | 153.0 | 1531.0 | 134.5 | 1818.5 |
| 2009 | 146.4 | 1435.4 | 129.8 | 1711.5 |
| 2010 | 145.8 | 1471.4 | 126.6 | 1743.8 |
| 2011 | 146.5 | 1442.5 | 132.1 | 1721.1 |
| 2012 | 141.1 | 1396.1 | 135.3 | 1672.5 |
| 2013 | 141.0 | 1406.9 | 133.7 | 1681.7 |
Notes
aFossil fuel emissions in teragrams of carbon (Tg C) per year from the Carbon Dioxide Information Analysis Center (Boden et al., 2017; see Section E.2).
Table E.3. Summary Statistics on North American Fossil Fuel Carbon Dioxide Emissionsa
| Quantity | Canada | United States | Mexico North | America |
|---|---|---|---|---|
| 2004–2013 CDIACb mean | 147.6 | 1496.4 | 130.1 | 1774.1 |
| CDIAC interannual variability (standard error of mean) | 1.3 | 23.3 | 1.4 | 23.8 |
| Time mean (2004–2013) of the range of the five emissions inventories in Section E.2 divided by CDIAC (percent) | 30.0 | 5.8 | 14.9 | 5.5< |
Notes
aEmissions measured in teragrams of carbon (Tg C) per year.
bCDIAC, Carbon Dioxide Information Analysis Center.
Figure E.1: Fossil Fuel Carbon Dioxide Emissions
