<b>Domke</b>, G., C. A. <b>Williams</b>, R. Birdsey, J. Coulston, A. Finzi, C. Gough, B. Haight, J. Hicke, M. Janowiak, B. de Jong, W. A. Kurz, M. Lucash, S. Ogle, M. Olguín-Álvarez, Y. Pan, M. Skutsch, C. Smyth, C. Swanston, P. Templer, D. Wear, and C. W. Woodall, 2018: Chapter 9: Forests. In Second State of the Carbon Cycle Report (SOCCR2): A Sustained Assessment Report [Cavallaro, N., G. Shrestha, R. Birdsey, M. A. Mayes, R. G. Najjar, S. C. Reed, P. Romero-Lankao, and Z. Zhu (eds.)]. U.S. Global Change Research Program, Washington, DC, USA, pp. 365-398, https://doi.org/10.7930/SOCCR2.2018.Ch9.
Forests
9.3.1 Carbon Stocks and Pools
Forests
Carbon is continuously cycled among the atmosphere and ecosystem carbon storage pools (i.e., above- and belowground biomass, dead wood, litter, and soil). This cycling is driven by biogeochemical processes in forests (e.g., photosynthesis, respiration, decomposition, and disturbances such as fires or pest outbreaks) and anthropogenic activities (e.g., harvesting, thinning, and replanting). As trees photosynthesize and allocate a portion of this carbon to growth, carbon is removed from the atmosphere and stored in living tree biomass. As live biomass dies, litter and dead wood are deposited on the forest floor and in the soil below ground (e.g., dead roots). The carbon in these dead components is either stored as soil organic matter or released to the atmosphere or water through decomposition by microorganisms. When forests are harvested, some of the biomass carbon is transferred to harvested wood products from which it may be lost to the atmosphere (burned) in the year of the harvest (e.g., fuelwood [including pellets] and mill residues) or stored for a few years (e.g., paper products) to centuries (e.g., sawnwood or panels used in buildings) (IPCC 2006; Skog 2008).
Carbon stocks in North American forests have continued to increase over the last decade to an estimated 103,110 teragrams of carbon (Tg C), of which 32% is in live biomass and 68% is in dead organic matter (see Table 9.2; Stinson et al., 2011; Köhl et al., 2015; FAO 2010, 2016b; U.S. EPA 2018). The increase in total carbon stocks is largely due to increases in aboveground biomass in the eastern United States, even as carbon stocks in Canada decreased slightly in recent years because of natural disturbances such as insects and wildfire (Stinson et al., 2011; Köhl et al., 2015; FAO 2010, 2016b; U.S. EPA 2018; ECCC 2016).
Table 9.2. Forest Carbon Stocks (in Teragrams of Carbon) by Carbon Pool in North America
| Country | Aboveground Biomass | Belowground Biomass | Dead Wood | Litter | Soil |
|---|---|---|---|---|---|
| Canadaa | 11,162 | 2,746 | 4,683 | 11,666 | 19,729 |
| Mexicob | 1,597 | 396 | 2 | NAc | NA |
| United Statesd | 14,182 | 2,923 | 2,570 | 2,680 | 28,774 |
| Totale | 26,941**** | 6,065**** | 7,255**** | 14,346**** | 48,503**** |
Notes
a Estimates based on FAO (2010).
b Estimates based on FAO (2016b).
c Not applicable.
d Estimates based on U.S. EPA (2018).
e Uncertainty estimates (noted by asterisks) follow the convention described in Treatment of Uncertainty in SOCCR2 in the Preface.
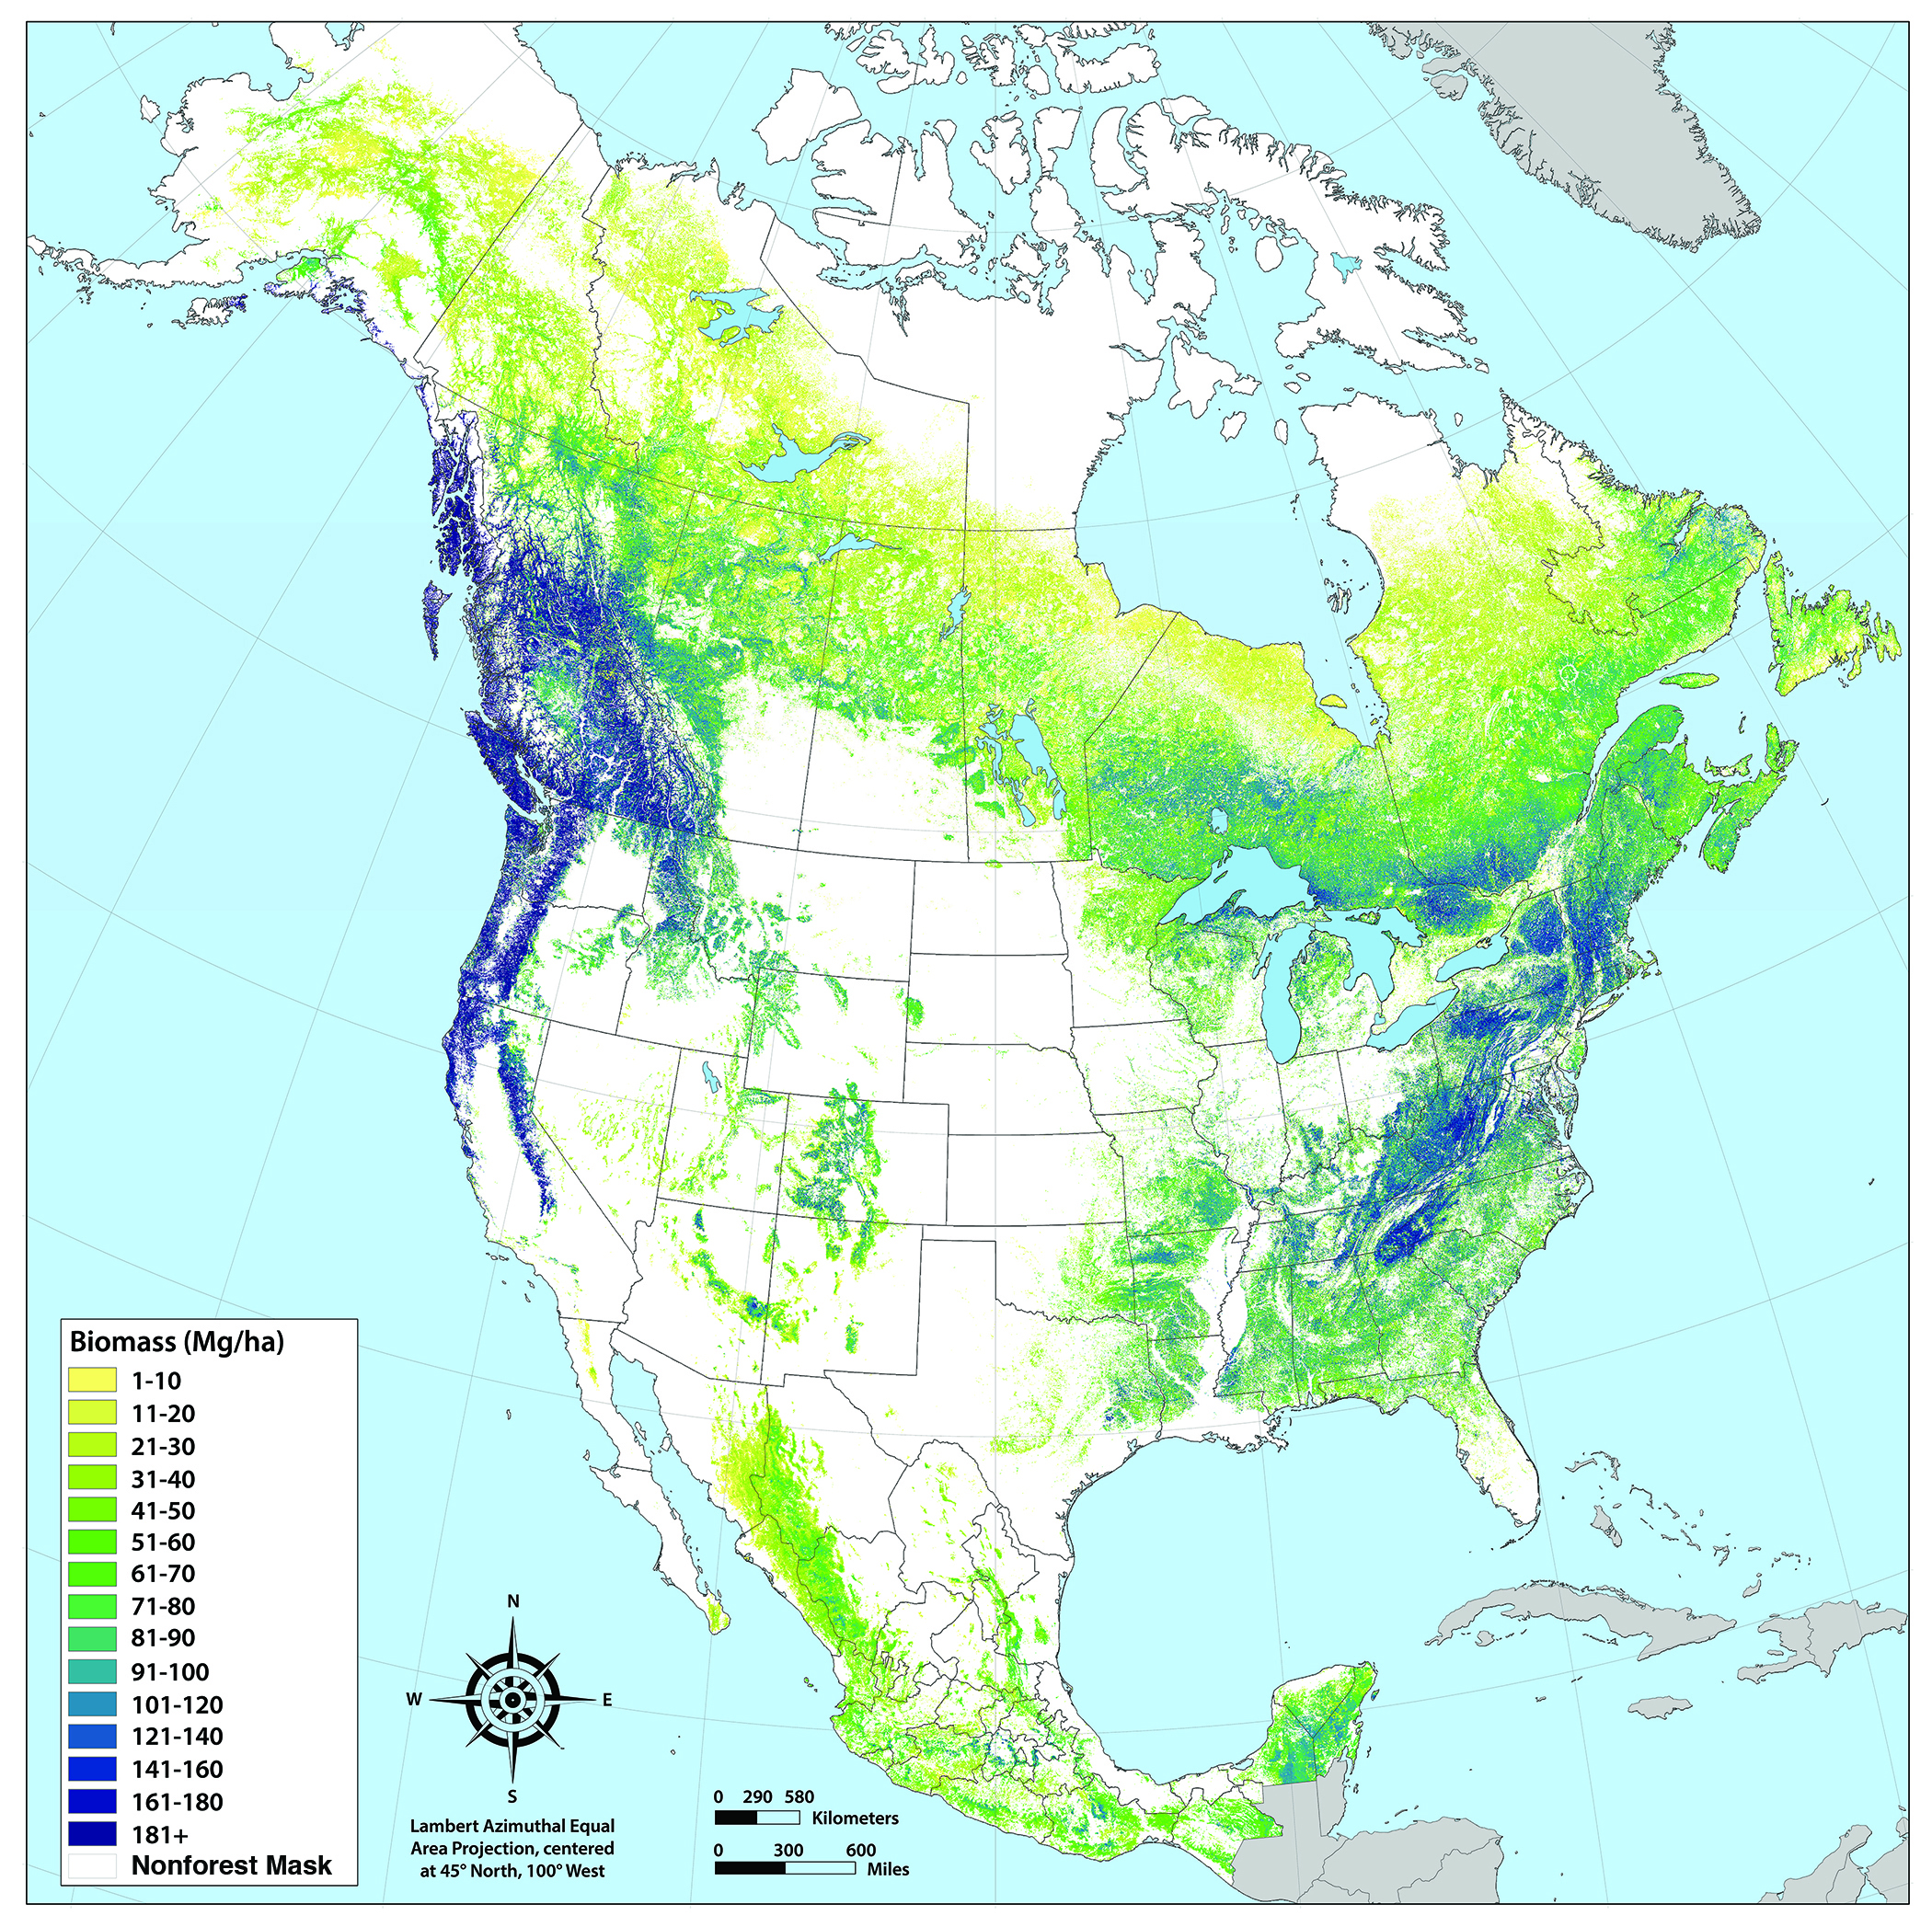
Carbon density (i.e., the amount of carbon stored per unit of land area) is highly variable (e.g., see Figure 9.1 for the distribution of aboveground live biomass density on forestland in North America). The estimated carbon density in North American forests is 142.4 megagrams of carbon (Mg C) per hectare. In Canada, the largest carbon densities are in boreal and cordilleran forests (ECCC 2016; Kurz et al., 2013). In the United States, forests of the Northeast, upper Midwest, Pacific Coast, and Alaska continue to store the most carbon (U.S. EPA 2018; see Figure ES.1 for a description of the areal extent of regions in the United States). In Mexico, forest carbon stocks are split fairly evenly among temperate, tropical, and semiarid forests (INECC/SEMARNAT 2015).
Figure 9.1: Hectares (ha) of Aboveground Forest Biomass Across North America
Woodlands
Woodlands are areas with tree coverage that falls between savanna and forest biomes. In the United States, for example, tree cover for woodlands does not meet the criteria for forestlands or agroforestry. Most woodlands occur in a matrix of grass vegetation and have been expanding in recent decades as trees and woody shrubs encroach on grasslands around the world, including in the western United States (Archer 1994; Briggs et al., 2002; Weisberg et al., 2007). For example, Asner et al. (2003) estimated a 10% increase in woody plant cover over a 40,000 ha area of northern Texas from 1937 to 1999 and an associated biomass carbon stock increase of 120 grams of carbon (g C) per m2. In the Intermountain West, woodland areas increased by about 1.3 million ha from 2005 to 2010 and resulted in an estimated net carbon stock increase of 6,439 Mg in biomass, litter, and dead wood (Coulston et al., 2016; Ogle and Zeigler 2016). Woody encroachment also could affect soil carbon stocks (Hibbard et al., 2001), although this may not be the case in all woodland systems (Hughes et al., 2006) and may vary depending on the climate (Jackson et al., 2002).
9.3.2 Fluxes
North American forests currently act as a net sink for atmospheric carbon dioxide (CO2; Hayes et al., 2012; King et al., 2015). A summary of data reported in recent GHG inventories (ECCC 2016; INECC/SEMARNAT 2015; U.S. EPA 2018) suggests that the North American carbon sink in forestland remaining forestland was about 325 Tg C per year over the last decade, with U.S. forests accounting for most of the sink (see Table 9.3 and Box 9.1, Clarifying Forest Carbon Flows and Their Relation to Emissions or Removals of Atmospheric Carbon for an explanation of associated terms). This sink results from photosynthetic uptake that exceeds the releases of forest carbon by plant and heterotrophic respiration and from fire. A sizeable portion of the net uptake of atmospheric carbon within forestlands is offset by harvest-related emissions. These emissions include wood processing—from log removal to product generation—as well as the decay and combustion of harvested wood products, which together release about 124 Tg C per year. Thus, the net forest sector–atmosphere flux for North America is estimated to be a sink of 217 Tg C per year over roughly the last decade. Urban trees are estimated to uptake another 27 Tg C per year in the United States and Canada. Note that the fluxes reported here represent contemporary rates in recent years, spatially integrated to the country scale. Future legacies resulting from contemporary or historical drivers of forest carbon dynamics are not included. Such trends are particularly important if those drivers exhibit long-term trends, as in a decline or increase in harvest or natural disturbance rates, which would lead to trends in carbon fluxes.
Table 9.3. Net Emissions of Carbon Dioxide Equivalent (CO2e)a for Forestlands from Net Forest Gain and Loss, Tree Growth in Urbanized Settlements, and Harvested Wood Products of Domestic Origin, by Country and Expressed in Teragrams of Carbon (Tg C) per Year
| Tg C per Year | Canadab | United Statesc | Mexicod | Totalk |
|---|---|---|---|---|
| 1. Net Ecosystem Exchange for Forestland Remaining Forestlande | –18 | –267 | –41 | -325**** |
| Stock Change for Forestland Remaining Forestlande (∆ Forest C) | -27 | 154 | NDj | 127 |
| 2. Net Flux Due to Forest Area Gain and Loss (ALoss + AGain) | 3 | 0 | 9 | 11**** |
| Emissions from Forest Area Lossf (ALoss) | 3 | 23 | 12 | 38 |
| Emissions from Forest Area Gaing (AGain) | 0 | -23 | –3 | -27 |
| 3. Settlements Remaining Settlementsh (Urban; Net Ecosystem Productionsettled) | –3 | –24 | ND | –27**** |
| 4. Emissions from Biomass Removal and Usei (FHWP) | 35 | 89 | ND | 124**** |
| Harvest Removals of Forest Carbon (Harv) | 43 | 113 | ND | 155 |
| Stock Change for Wood Products (from Harvest Removals – 4) | 8 | 23 | ND | 31 |
| 5. Forest Sector–Atmosphere Exchange (from 1 + 2 + 3 + 4; ∆ Atmos. C) | 16 | -201 | -32 | -217**** |
Emissions are from 2000 to 2014 for the United States, from 2006 to 2015 for Canada, and the 2000s for Mexico. Exchanges with the atmosphere (e.g., terms 1, 2, 3, 4, 5) are assigned a negative sign for transfers out of the atmosphere (also known as removals or sinks), but the negative sign is dropped in the text when the direction of transfer is specified with terminology. Stock changes in forestlands and in wood products are assigned a positive sign if they are increasing (see Box 9.1, Clarifying Forest Carbon Flows and Their Relation to Emissions or Removals of Atmospheric Carbon for a review of associated terms).
Notes
a Carbon dioxide equivalent (CO2e): Amount of CO2 that would produce the same effect on the radiative balance of Earth’s climate system as another greenhouse gas, such as methane (CH4) or nitrous oxide (N2O), on a 25-year timescale. For comparison to units of carbon, each kg CO2e is equivalent to 0.273 kg C (0.273 = 1⁄3.67). See Box P.2 in the Preface for more details.
b ECCC (2017). Only includes Canada’s managed forests for the 10-year period 2006 to 2015.
c U.S. EPA (2018). Does not include U.S. territories, Hawai‘i, or a large portion of interior Alaska (19.7 million hectares), which are not yet fully integrated into the U.S. national inventory program.
d INECC/SEMARNAT (2015). Includes effects of forest loss and cyclical uses, which account for some of the emissions that would otherwise appear as releases from harvested wood products.
e Includes net exchange between the atmosphere and forestland remaining forestland, including disturbance emissions that occur within forests such as those from fire combustion and onsite decay of harvest residues. For the United States, this estimate has been calculated from stock change (see c), plus average harvest removals of about 113 Tg C per year (U.S. EPA 2018).
f Includes emissions from forest conversion to croplands, wetlands, grasslands, and settlements when reported, and including residual emissions for decades after conversion; overlaps with reporting in other land use, land-use change, and forestry (LULUCF) categories.
g Includes emissions (and removals) from all lands converted to forestland through direct human activity; overlaps with reporting in other LULUCF categories.
h Also referred to as net growth of urban trees; overlaps with reporting in other LULUCF categories.
i Includes emissions from harvesting removals of biomass of domestic origin and its use in a range of forest products.
j No data.
k Uncertainty estimates (noted by asterisks) follow the convention described in Treatment of Uncertainty in SOCCR2 in the Preface.
Net forest carbon gain and loss constitute a source of 11 Tg C per year in North America. In the United States, net emissions from forest carbon losses encompass losses of aboveground biomass from conversion to croplands, grasslands, and settlements and include both prompt and residual legacy emissions from conversions that occurred over a 20-year time frame. Canada adopted a similar approach for quantifying emissions but accounted for conversions to croplands, settlements, and wetlands. The U.S. and Canadian estimated flux from forest carbon gains and losses includes all live biomass, dead organic matter, and soil carbon components.
Forests are generally believed to neither release nor absorb substantial quantities of methane (CH4), though upland soils can act as modest sinks and forested wetlands can be CH4 sources. However, forest fires release CH4, contributing a 25-year global warming potential (GWP) of 9 Tg of CO2 equivalent1 (CO2e) per year in Canada and releasing 0.22 Tg CH4 per year (ECCC 2016). In the United States, CH4 emissions from forest fires equate to a 100-year GWP of 8.3 Tg CO2e per year, or a 25-year GWP of about 33 Tg CO2e per year (U.S. EPA 2018).
The Canadian forest sector constituted a near-zero carbon exchange with the atmosphere from 2006 to 2015 as net carbon uptake in intact forests was largely balanced by releases from harvested wood products (ECCC 2017; see Table 9.3). Intact Canadian forests took up about 18 Tg C per year over this period, but with large interannual variability ranging from a sink of 248 Tg C to a source of 3.5 Tg C per year. This variability was driven principally by variability in wildfire emissions, ranging from 3 to 75 Tg C per year from 1990 to 2014 (ECCC 2016). Emissions from harvested wood products were about 43 Tg C per year. These estimates pertain solely to Canada’s managed forests, which represent about 66% of the country’s total forested area (Stinson et al., 2011). In addition, Canada’s urban forests contributed a small sink of 3 Tg C per year while land conversions released 3 Tg C per year, with emissions from forest losses exceeding removals from forest gains (ECCC 2016).
U.S. forests took up atmospheric carbon at a rate of about 267 Tg C per year from 2000 to 2015, contributing to a stock change of 154 Tg C per year (U.S. EPA 2018) after harvest removals of about 113 Tg C per year (U.S. EPA 2018; see Table 9.3 This estimate accounts for about 77% of the atmospheric carbon sink in North American forests and includes all managed forestlands in the United States, except for those in interior Alaska (19.7 million ha; U.S. EPA 2018), Hawai’i, and the U.S. territories, all of which are not yet fully integrated into the U.S. national inventory program (U.S. Forest Service 2018). Most of the net sink for atmospheric carbon in U.S. forests is in aboveground carbon pools (U.S. EPA 2018). Urban trees are estimated to uptake another 24 Tg C per year. Net uptake in U.S. forestlands (a sink of 267 Tg C per year) substantially exceeds emissions from harvested wood products estimated at 113 Tg C and the net effect of land conversions, estimated at 0 Tg C per year (U.S. EPA 2018). Interannual variability in U.S. fluxes is reportedly small but may be underestimated by current methods.
Mexico’s forests are estimated to uptake about 41 Tg C per year, overwhelming the net effects of land conversion estimated to release 9 Tg C per year (INECC/SEMARNAT 2015). Carbon releases from land clearing still exceed carbon uptake from reforestation, but their net effect is more than offset by carbon uptake in intact and degraded forestlands. This assessment departs from SOCCR1, which reported a sizeable net carbon release from Mexico’s forests based on a gain-loss analysis that emphasized land change but omitted consideration of carbon accumulation rates in both intact forests and degraded forests, with a corresponding net uptake of atmospheric carbon. Although a complete methodological description is unavailable, the new data sources and methods used in Mexico’s national reporting are believed to provide an improved account of the net carbon uptake in forestlands, which was previously underestimated. Estimates are not available for Mexico’s carbon release from harvested wood products and carbon uptake by urban trees.
Net carbon uptake in North American forests as documented in national reports is in broad agreement with results from a wide range of sources (Hayes et al., 2012; King et al., 2015), including 1) atmospheric inversion models (Peylin et al., 2013), 2) syntheses of forest inventory and land-change data (Pan et al., 2011), 3) measurements of forest-atmosphere carbon exchange with eddy covariance (Amiro et al., 2010), and 4) ecosystem process models (Sitch et al., 2015). Regions differ widely in their source and sink patterns and drivers. For example, in the United States, the Northeast has a prevailing legacy of carbon uptake from historical land clearing; in the Southeast, carbon uptake is dominated by regrowth from contemporary harvesting; and carbon releases in the West are increasing because of the recent rise in disturbances and environmental stresses (e.g., droughts, insects, and pathogens; Williams et al., 2016). Fluxes also exhibit large spatial variability at landscape scales (Turner et al., 2016; Williams et al., 2016), with neighboring stands ranging from sources to sinks due to a host of factors including time since disturbance, disturbance type and severity, forest type, local climate, site fertility, topographic position, and other edaphic factors.
9.3.3 Harvested Wood Products
Carbon storage and emissions from harvested wood products (including products in use and in landfills) substantially contribute to overall carbon stocks and fluxes from the forest sector (UNFCCC 2003). Although the contribution of harvested wood products is uncertain, some studies suggest that the worldwide net increase in harvested wood products amounts to about 8% (189 Tg C per year) of the established global forest sink (Pan et al., 2011; Skog et al., 2004). However, wood product accumulation is the result of harvested wood inputs from forests that exceed releases from the decay and combustion of wood products in use. As such, the wood products pool cannot act as a direct sink for atmospheric carbon, but the store’s losses do act as a direct source of atmospheric carbon (see Box 9.1, Clarifying Forest Carbon Flows and Their Relation to Emissions or Removals of Atmospheric Carbon). Nonetheless, in the United States, Skog (2008) indicates that the amount of carbon in harvested wood products grew at a rate of 25 to 36 Tg C per year from 1990 to 2005. Canada reports an increase in wood products of about 12 to 17 Tg C per year over the same time period, slowing to about 8 Tg C per year from 2006 to 2015 (ECCC 2017). These net increases result from inputs exceeding losses. For example, in the United States, 76% of the annual domestic harvest input to the wood products pool in 2015 (110 Tg C per year) was offset by releases (84 Tg C per year), yielding a corresponding increase in wood products of 26 Tg C (U.S. EPA 2018, Annex 3b, Table A-240). Importantly, the net increase in the harvested wood products pool is contingent upon a sustained or growing rate of harvest removals of forest carbon, or a shift toward products that have a longer residence time. If harvest rates decline (as they did during the economic recession of 2008), net additions to harvested wood products may be lower than emissions from wood harvested in prior years, as was the case in the eastern United States (U.S. EPA 2018).
In 2009, the annual increase in harvested wood products slowed to 15 Tg C and 0 Tg C per year for the United States and Canada, respectively, driven by slowing economic markets, particularly housing. As economies recover, additions to the harvested wood products pool are now returning to prerecession levels, indicating the pool’s strong sensitivity to markets. Looking ahead, carbon storage in harvested wood products is expected to increase by about 7 to 8 Tg C per year over the next 25 years (U.S. Department of State 2016).
See Full Chapter & References