<b>Jacobson</b>, A. R., J. B. <b>Miller</b>, A. Ballantyne, S. Basu, L. Bruhwiler, A. Chatterjee, S. Denning, and L. Ott, 2018: Chapter 8: Observations of atmospheric carbon dioxide and methane. In Second State of the Carbon Cycle Report (SOCCR2): A Sustained Assessment Report [Cavallaro, N., G. Shrestha, R. Birdsey, M. A. Mayes, R. G. Najjar, S. C. Reed, P. Romero-Lankao, and Z. Zhu (eds.)]. U.S. Global Change Research Program, Washington, DC, USA, pp. 337-364, https://doi.org/10.7930/SOCCR2.2018.Ch8.
Observations of Atmospheric Carbon Dioxide and Methane
Atmospheric carbon dioxide (CO2) and methane (CH4) are the primary contributors to anthropogenic radiative forcing. Atmospheric concentration measurements of these two species provide fundamental constraints on sources and sinks, quantities that need to be monitored and understood in order to guide societal responses to climate change. These atmospheric observations also have provided critical insights into the global carbon cycle and carbon stocks and flows among major reservoirs on land and in the ocean. This chapter discusses atmospheric CO2 and CH4 measurements and their use in inverse modeling.
After decades of steady growth in anthropogenic carbon emissions associated with fossil fuel consumption, global emissions began to stabilize in 2014 and 2015 (BP 2016). Global emissions nearly doubled from 5,000 teragrams of carbon (Tg C) per year in 1980 to around 10,000 Tg C per year in 2015. In North America, emissions recently have been decreasing: in Canada from 151 to 141 Tg C per year between 2004 to 2013, and in the United States from 1,570 to 1,407 Tg C per year over the same time period (Boden et al., 2017). Nevertheless, the global atmospheric CO2 concentration has passed the 400 parts per million (ppm) milestone (a part per million represents the mole fraction of CO2 in dry air and is equivalently expressed as μmol per mol). Given the long lifetime of atmospheric CO2, this global burden will continue to rise as long as net emissions remain positive.
The global atmospheric growth rate of CO2 has averaged around half the rate of CO2 input from fossil fuel combustion over the last 50 years, rising from less than 1 ppm per year in the early 1960s to around 2.5 ppm per year between 2010 and 2015 (see Figure 8.1; Ballantyne et al., 2015). Although the growth rate varies substantially from year to year, mainly in response to the El Niño–Southern Oscillation (Bacastow 1976; Sarmiento et al., 2010), the trend in net CO2 absorption by the terrestrial biosphere and the ocean has increased from around 2,000 Tg C per year in 1960 to nearly 5,000 Tg C per year in 2015 (see Figure 8.1; Ballantyne et al., 2015). Although the total sink is well constrained, now limited mainly by the ~5% to 10% uncertainty on global fossil fuel emissions, its partitioning between land and ocean and on land between continents is still uncertain. Accordingly, there is no consensus on the fraction of the global sink in North America, although almost all inventory, biospheric model, and atmospheric studies show it to be a sink (King et al., 2015).
Figure 8.1: Global Monthly Mean Concentrations of Methane (CH4; red line) and Carbon Dioxide (CO2; blue line) and Global Annual Emissions of CH4 (red bars) and Nonfossil Fuel Annual Emissions of CO2 (blue bars)
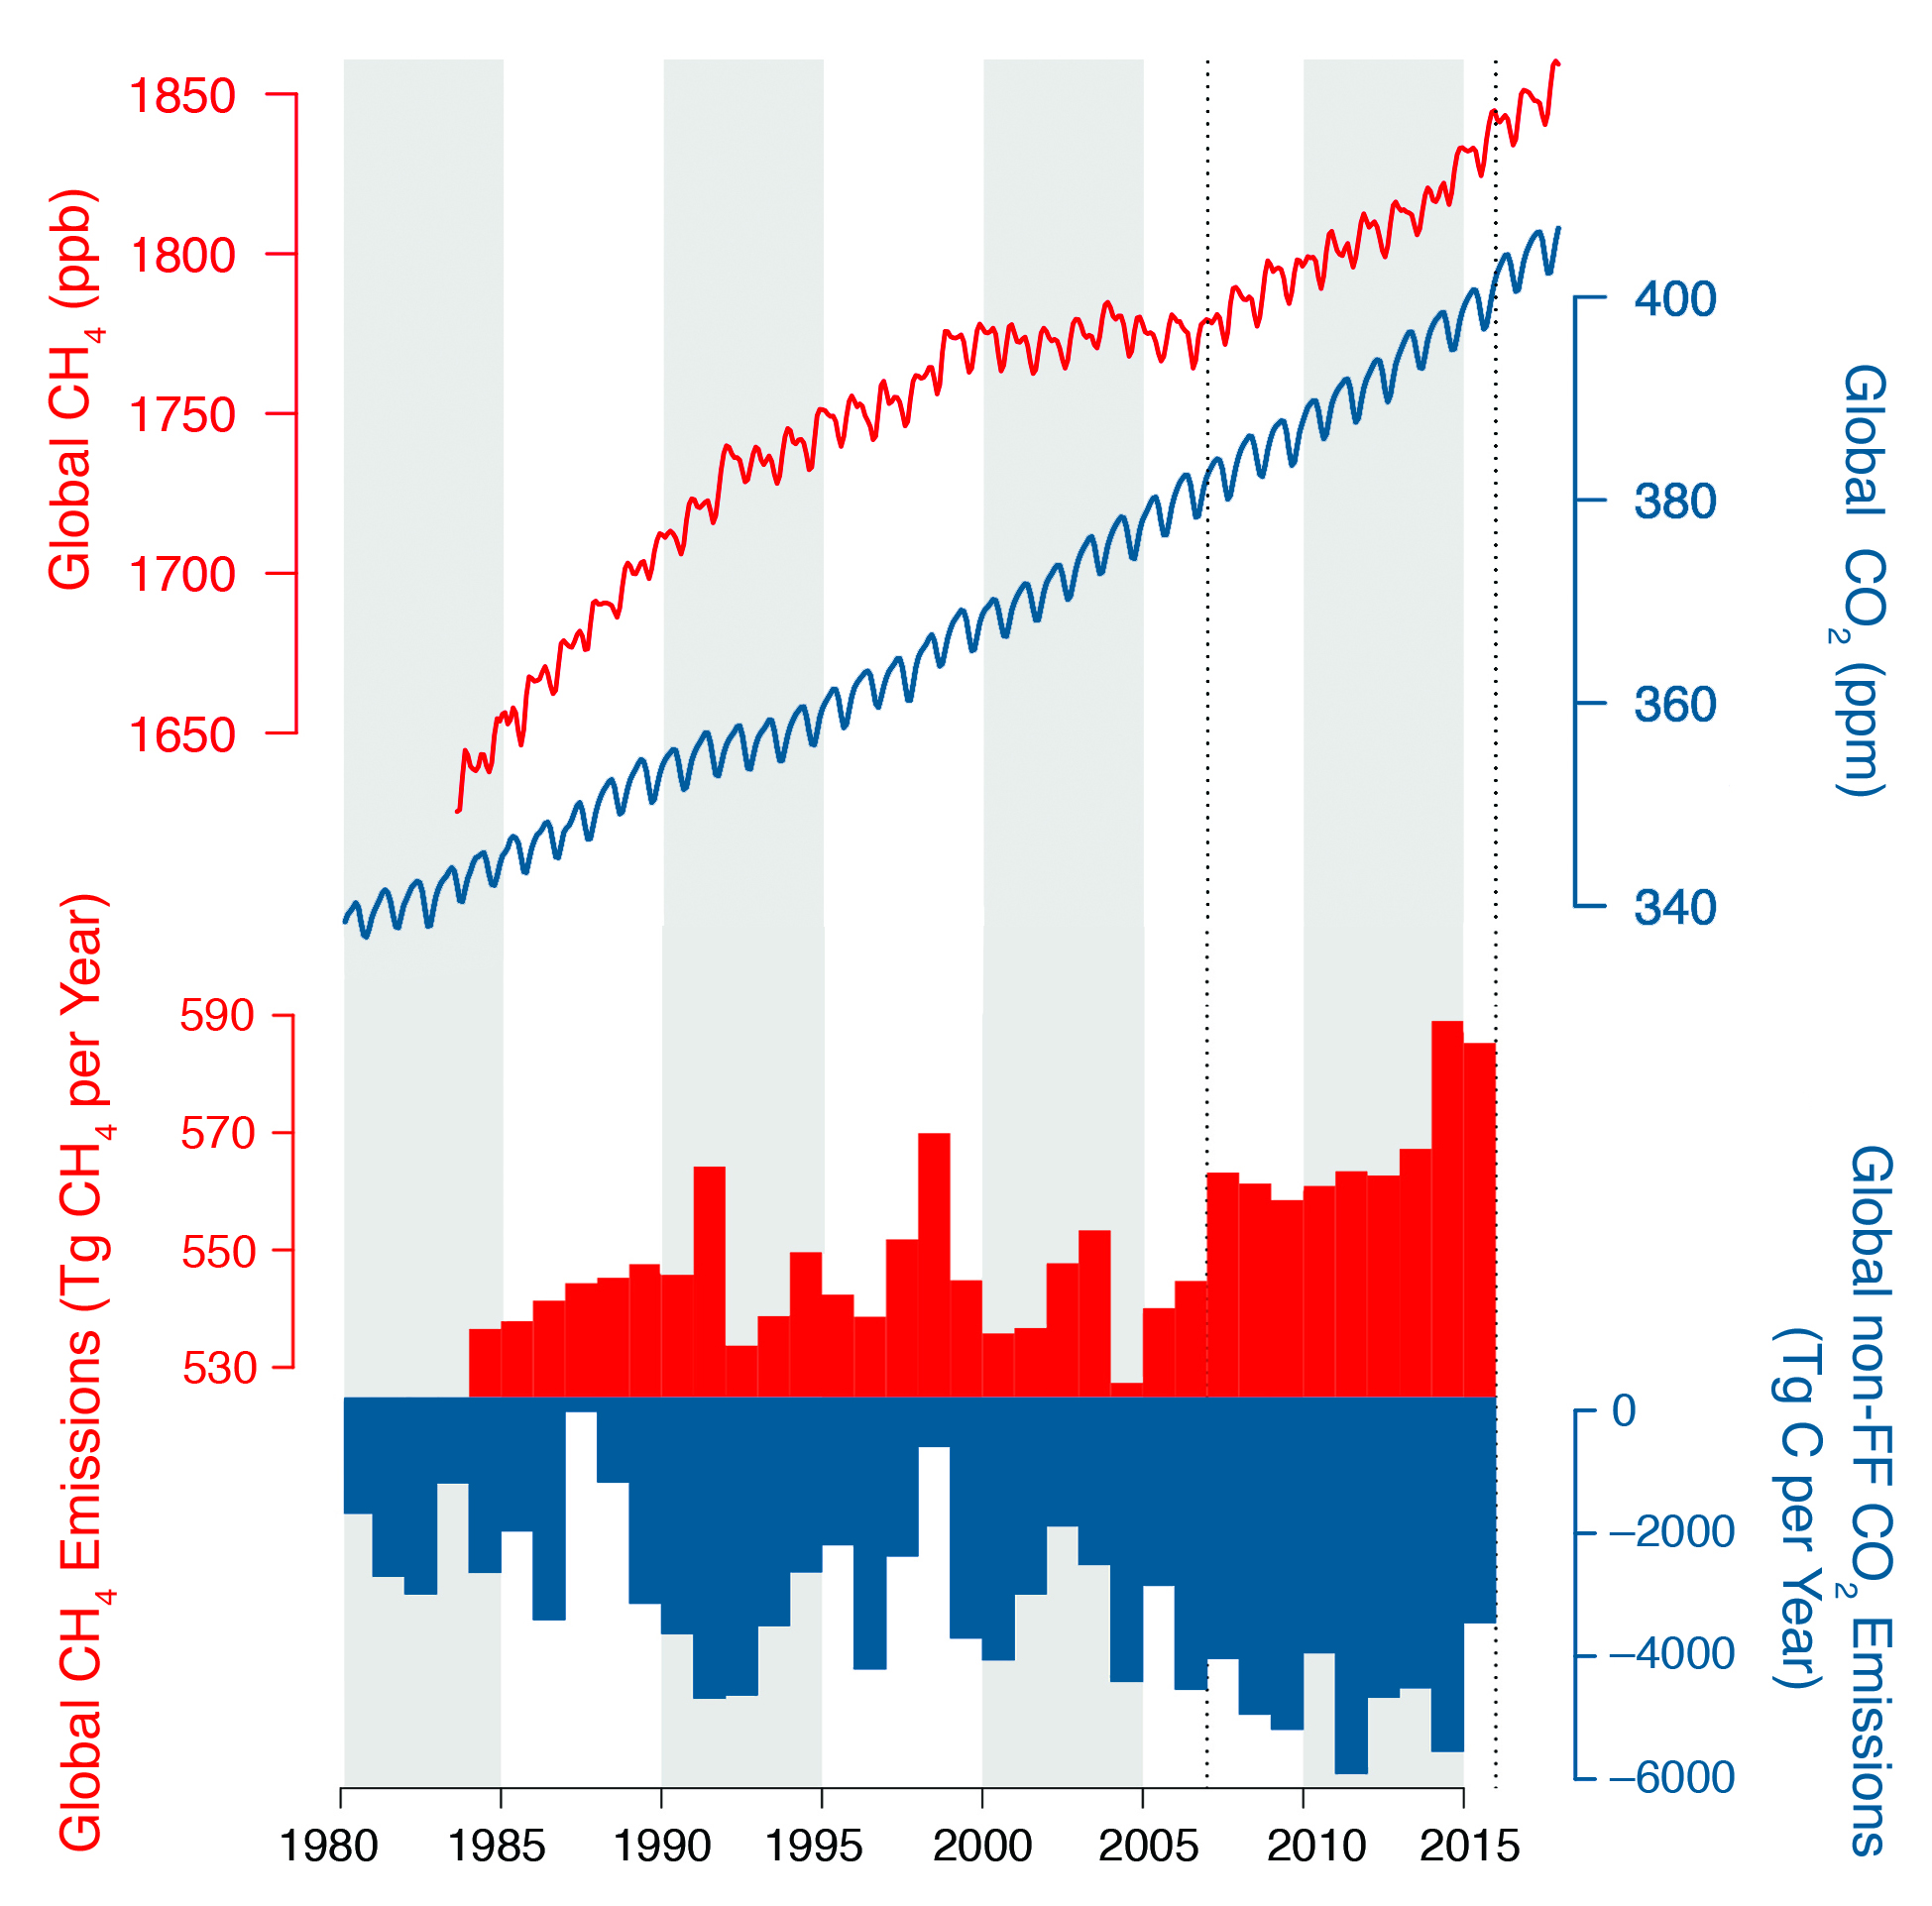
The global abundance of CH4 grew significantly from 1984 to 1996, but between 1997 and 2006 there was no significant change in global burden (see Figure 8.1). This quasi-asymptotic behavior can be explained as an approach to steady-state concentrations (Dlugokencky et al., 1998). The balance between surface sources and atmospheric chemical loss, which is mainly due to oxidation by hydroxyl radicals, can be explained by constant emissions and a constant atmospheric CH4 lifetime. For the emissions calculations reported in this chapter, a value of 9.1 years was used for this lifetime (Montzka et al., 2011). Indeed, global net emissions exhibited variability but no significant trend between 1984 and 2006 (Dlugokencky et al., 2011; see Figure 8.1). After 2007, however, global CH4 abundance began to rise rapidly (e.g., Dlugokencky et al., 2009; Nisbet et al., 2016), implying an increase in global emissions from 541 ± 8 Tg CH4 per year (1999 to 2006) to 569 ± 12 Tg CH4 per year (2008 to 2015). Emissions in 2014 and 2015 are particularly large, with a mean of 587 ± 3 Tg CH4 per year. Analysis of trends in the 13C:12C content of CH4 (δ13C) indicates that, at global scales, the rise since 2007 resulted predominantly from changes in microbial emissions (e.g., wetlands, livestock, and agriculture) and not fossil fuel–related emissions (Schaefer et al., 2016; Schwietzke et al., 2016). Moreover, because the recent CH4 trend displays no significant meridional gradient, much of this new emissions increment likely originated in the tropics (Nisbet et al., 2016) and not in the northern midlatitudes.
Global total emissions of CO2 and CH4 are well constrained by available atmospheric measurements; however, using these measurements to attribute to sources and sinks (e.g., fossil emissions versus terrestrial biosphere uptake) or partitioning between land and ocean regions remains difficult. In fact, even at smaller scales (i.e., continental regions as large as North America), substantial uncertainty remains about net contributions by terrestrial and aquatic ecosystems. The ability to use CO2 and CH4 time and space gradients to constrain North American sources and sinks is limited by current knowledge of atmospheric mixing and by the time and space density of calibrated observations (see Section 8.6).
See Full Chapter & References