<b>Hristov</b>, A. N., J. M. F. <b>Johnson</b>, C. W. Rice, M. E. Brown, R. T. Conant, S. J. Del Grosso, N. P. Gurwick, C. A. Rotz, U. M. Sainju, R. H. Skinner, T. O. West, B. R. K. Runkle, H. Janzen, S. C. Reed, N. Cavallaro, and G. Shrestha, 2018: Chapter 5: Agriculture. In Second State of the Carbon Cycle Report (SOCCR2): A Sustained Assessment Report [Cavallaro, N., G. Shrestha, R. Birdsey, M. A. Mayes, R. G. Najjar, S. C. Reed, P. Romero-Lankao, and Z. Zhu (eds.)]. U.S. Global Change Research Program, Washington, DC, USA, pp. 229-263, https://doi.org/10.7930/SOCCR2.2018.Ch5.
Agriculture
5.4.1 Trends in Acres Cultivated, Soil Carbon, and Overall Emissions
The First State of the Carbon Cycle Report (CCSP 2007) showed total agricultural and grazing lands in North America (e.g., cropland, pasture, rangeland, shrub lands, and arid lands) accounting for 17% of global terrestrial carbon stocks. Most of this carbon pool existed within soils; less than 5% resided in cropland vegetation. More recent data estimate that the annual U.S. soil carbon sequestration rate decreased between 1990 and 2013, primarily due to changes in land use and variability in weather patterns. Worth noting are the large interannual fluctuations in the size of the mineral soil CO2 sink (USDA 2016). The major non-CO2 emissions from U.S. agriculture in 2013 were N2O from cropped and grazed soils (44% of U.S N2O emissions) and enteric CH4 from livestock (28% of U.S. CH4 emissions). In 2015, the major non-CO2 emissions from U.S. agriculture were N2O from agricultural soil management (52% of all agricultural emissions, or 4.4% of all U.S. GHG emissions) and enteric CH4 from livestock (29% of agricultural emissions, or 2.5% of all U.S. GHG emissions). Combined with forestry, the agricultural sector contributed to a total net carbon sequestration of 270 Tg CO2e in 2013 (USDA 2016), while total agricultural GHG emissions (excluding land use, land-use change, and forestry activities) amounted to 567 Tg CO2e in 2015 (U.S. EPA 2018).
Agricultural GHG emissions in North America were 706 Tg CO2e in 2014 and 2015 (Table 5.1), including 567 Tg CO2e in the United States (excluding emissions from land use, land-use change, and forestry; U.S. EPA 2018), 59.0 Tg CO2e in Canada, and 79.9 Tg CO2e in Mexico (Table 5.1). Agricultural non-CO2 emissions were primarily N2O from cropped and grazed soils and CH4 from enteric fermentation in livestock. In 2014 and 2015, North America’s major sources and annual rates of GHG emissions (in CO2e) included: agricultural soil management (318.0 Tg), enteric fermentation (234.8 Tg), manure management (117.7 Tg), and rice cultivation (12.5 Tg; Table 5.1). Trends that drive North American GHG emissions from agriculture include changes in five areas: 1) the amount of nitrogen fertilizer applied, which correlates with land area planted in corn, cotton, and wheat (USDA 2016); 2) the number of ruminants, especially beef cattle and dairy cows because they produce large quantities of enteric and manure CH4; 3) trends in human diet choices, which drive changes in land use, numbers of livestock, and volumes of inputs like fertilizer; 4) area of agricultural land opened by clearing forest, which converts large amounts of carbon in plants and soils to CO2; and 5) the amount of food wasted, which leads to CH4 emissions from landfills and also drives additional production with associated GHG emissions (e.g., Hall et al., 2009). Overall, actively managed agricultural lands have a strong capacity to reduce GHG emissions to the atmosphere and take up and store carbon. Varying management options thus could lead to substantial reductions in emitted CO2 and CH4 and sequester significant amounts of carbon.
According to the U.S. 2012 Agricultural Census, 370 million ha were classified as farmland (see Table 5.3). Such lands declined by 3.1 million ha between 2007 and 2012 (USDA-NASS 2012). Out of the converted croplands, 18% changed to nonagricultural uses (e.g., urban growth and transportation); another 3% reverted to forest; and the remaining 79% were used for other types of agricultural land, primarily pastures (USDA-NRCS 2015). The conversion of farmland to other uses appears to have slowed compared with the period from 2002 to 2007, when greater than 9.6 million ha of farmland were converted to other uses (USDA-NASS 2012). In 2012, 19% of the total 786.8 million ha in the contiguous 48 states, Hawaiʻi, Puerto Rico, and the U.S. Virgin Islands was classified as cropland, 1% as CRP, 6% as pastureland, and 21% as rangeland (USDA-NRCS 2015).
Table 5.3. United States Agricultural Lands by Sector and Percentage of Cropland Reportedly Managed with Conservation Practice and Distribution of Crops and Managementsa
| Land | Acreage (Million Hectares) | No Till (%)b | Other Conservation Tillage (%) | Cover Crop | Conservation Easement |
|---|---|---|---|---|---|
| Total Agricultural Lands 2012 | 370.1 | ||||
| Croplandc | 157.7 | 24 | 19.67 | 2.41 | 3.38 |
| Pastures | 49 | NAd | |||
| Rangeland (Includes Federal and Nonfederal Lands) | 246.7 | ||||
| Conservation Reserve Program | 1.5 | ||||
| Crop | Acreage (Million Hectares) | Percentage of Cropland | Managed Under No Till or Strip Till (%)e | ||
| Corn | 38.3 | 24.3 | 31 | ||
| Soybeans | 30.8 | 19.5 | 46 | ||
| Wheat | 19.8 | 12.6 | 33 | ||
| Cotton | 3.8 | 2.4 | 43 | ||
| Sorghum | 1.1 | 1.6 | NA | ||
| Rice | 1.1 | 0.7 | NA | ||
| Hayf | 22.8 | 14.4 | NA | ||
Notes
a The percentage of no-tilled land does not imply that these lands are managed in a long-term, no-till system.
b Duration of no-till practice is not available; this value does not necessarily reflect a continuous practice.
c USDA-NASS (2012).
d Not applicable.
e Wade et al. (2015).
f USDA-NRCS (2015).
Similar to these trends in North America, global GHG emissions from large ruminants, such as beef and dairy cattle, are about seven times greater than emissions from swine or poultry (Gerber et al., 2012). Dairy production systems, however, are considerably more efficient than beef systems. As an example, Eshel et al. (2014) estimated, using a full life cycle assessment, that GHG emissions per human-edible megacalorie (MCal) were 9.6 kg CO2e for beef versus 2 for pork, 1.71 for poultry, and 1.85 for dairy. Similarly, GHG emissions per kg of human-edible protein were 214 kg CO2e for beef, 42 for pork, 20 for poultry, and 32 for dairy (Eshel et al., 2014).
U.S. cattle inventories have fluctuated during the last several decades from a peak of over 130 million heads (both beef and dairy) in the 1970s to a low of 88.5 million in 2014. Cattle numbers increased to 89 million in 2015 and an estimated 92 million in 2016 (USDA-NASS 2016). According to the 2016 inventory, there were 30.3 million beef cows, 9.3 million dairy cows, 19.8 million heifers weighing 227 kg or more, 16.3 million steers at 227 kg or more, 14 million calves under 227 kg, and 2.1 million bulls. Beef and dairy cows, because of their high feed consumption and higher-fiber diets, are the largest emitters of enteric CH4, producing about 95 and 146 kg CH4 per head per year, respectively; emissions from feedlot cattle fed high-grain diets are considerably less at 43 kg per year per head (U.S. EPA 2018). Increased cattle productivity has resulted in increased feed efficiency and decreased enteric CH4 emission intensity (i.e., CH4 emitted per unit of milk or meat). As an example, the estimated CH4 emission intensity for the U.S. dairy herd has decreased from 31 g per kg milk in 1924 to 14 g per kg in 2015 (Global Research Alliance on Agricultural Greenhouse Gases 2015).
Cattle inventories in Canada have fluctuated annually, but long-term trends are relatively stable—about 12 million heads in January 2016, down slightly from a peak in 2005 (Statistics Canada 2016). Beef cattle account for more than 80% of these animals. In recent decades, improvements in management efficiency have led to a decline in GHG emissions per unit of livestock product. For example, estimated emissions per kilogram of liveweight beef leaving the farm declined from 14 kg CO2e in 1981 to 12 kg CO2e in 2011 (Legesse et al., 2016).
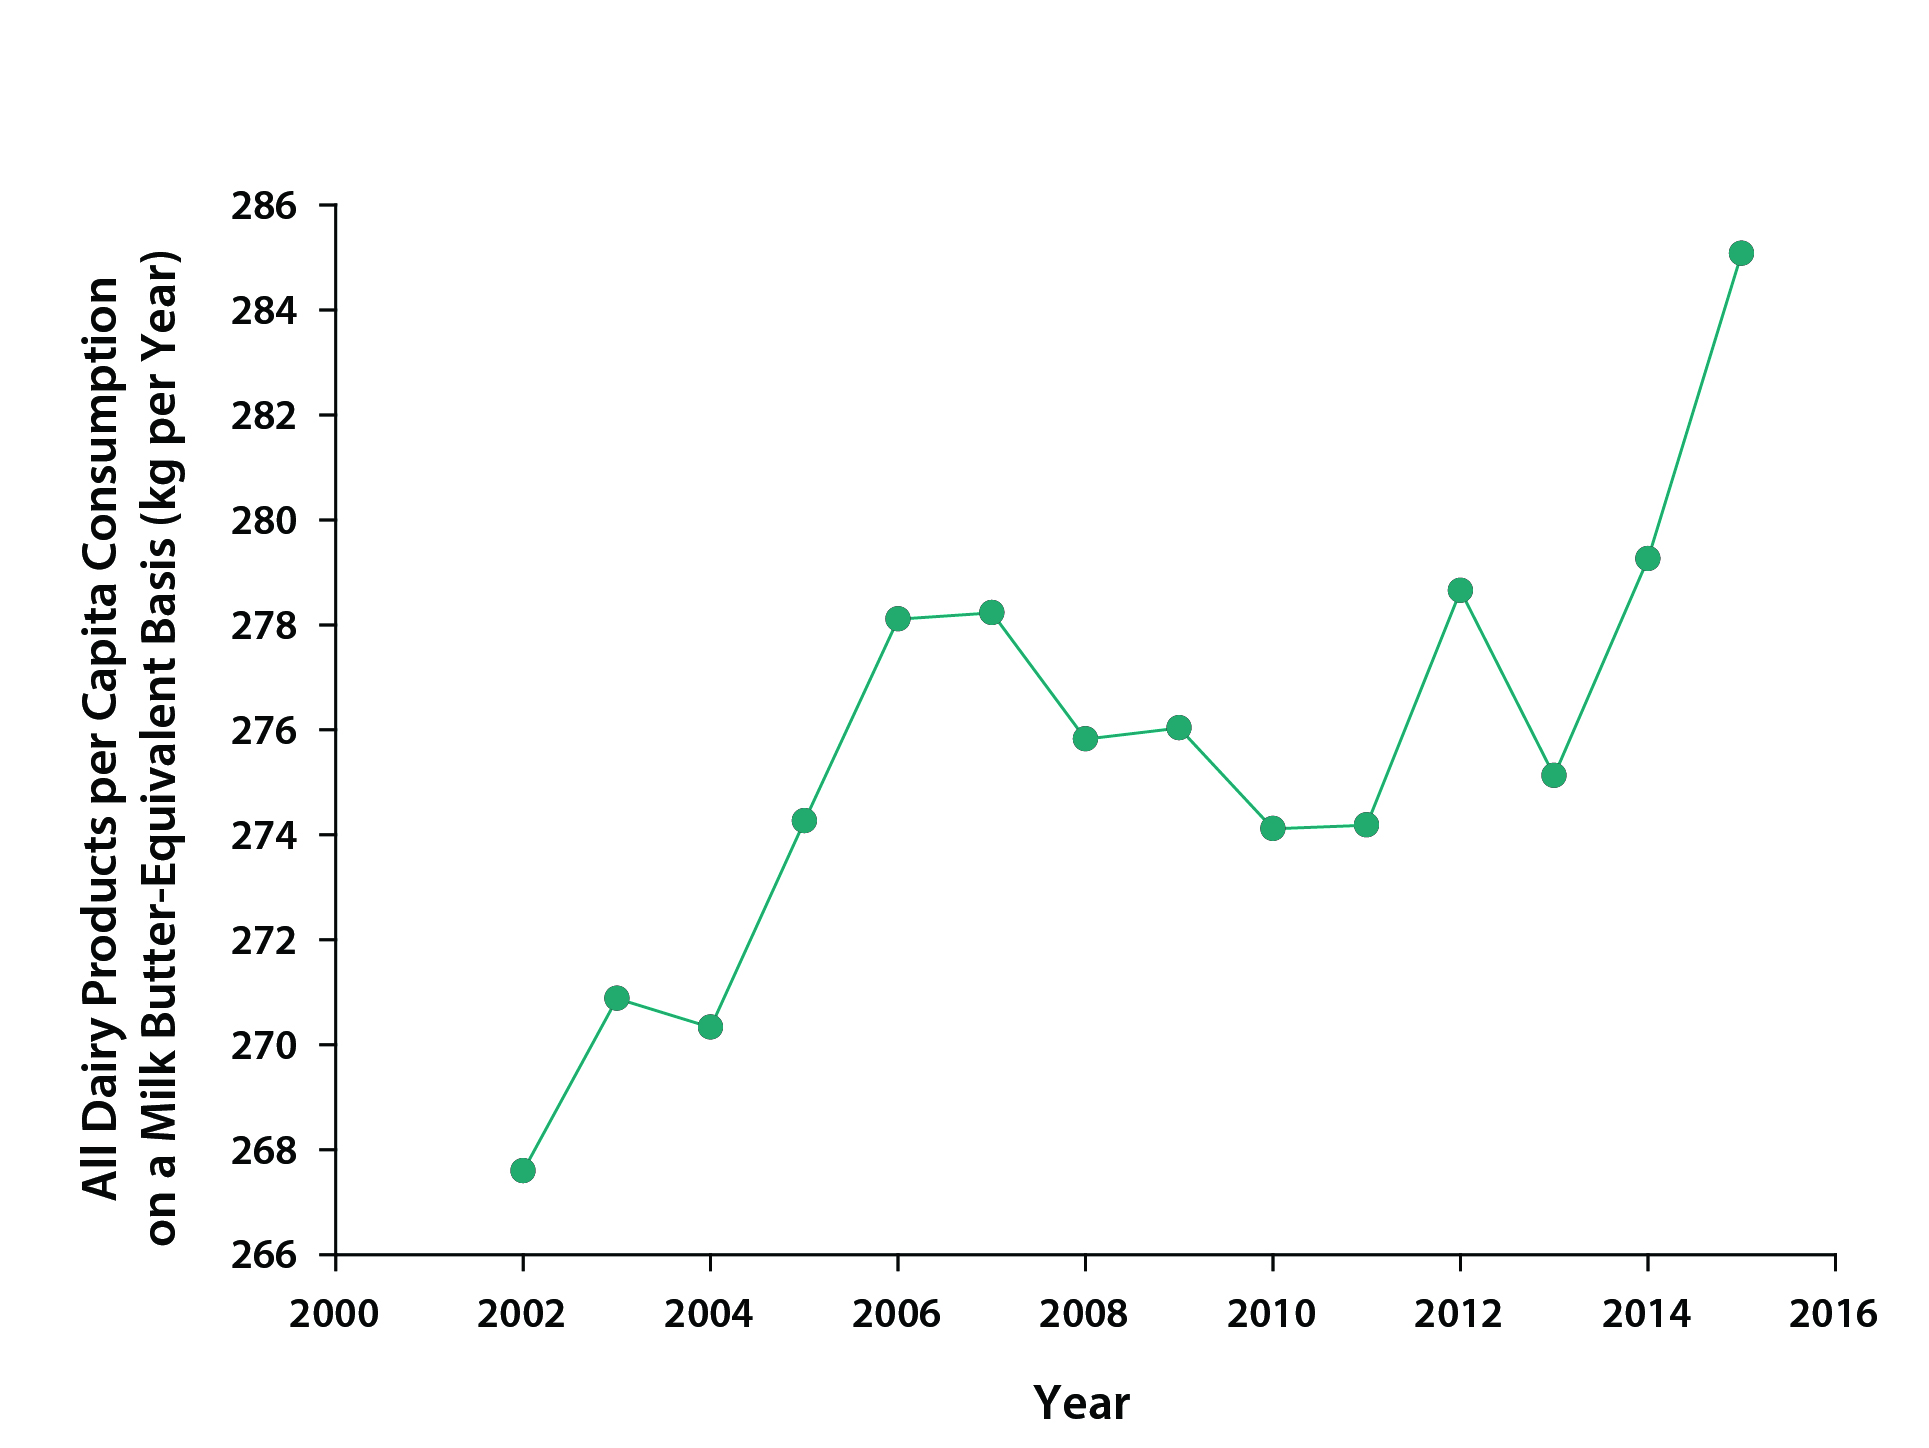
U.S. beef consumption has been declining steadily over the past decade (see Figure 5.3) while consumption of dairy products has been increasing (see Figure 5.4). The previously mentioned life cycle assessment analyses that found greater carbon efficiency of dairy versus beef suggest that this trend should translate to lower emissions from the livestock sector. Most of the beef and veal consumed in the United States was domestically produced (about 86% in 2015; 18.6% of imported beef was from Canada), while about 9.6% of beef produced in the United States in 2015 was exported to other countries. Fluid milk consumption per capita has been decreasing—from about 89 kg per year in 2000 to 71 kg per year in 2015, while consumption of cheese, butter, and yogurt, most of which is domestically produced, has been steadily increasing. As in the United States, per capita consumption of livestock products in Canada also has declined in recent decades. For example, beef and fluid milk consumption decreased from 39 kg of beef per capita in 1980 to 24 kg in 2015 (Agriculture and Agri-Food Canada 2016) and from 90 liters of fluid milk per capita in 1996 to 71 liters in 2015 (Government of Canada 2016).
Figure 5.3: U.S. per Capita Beef Consumption
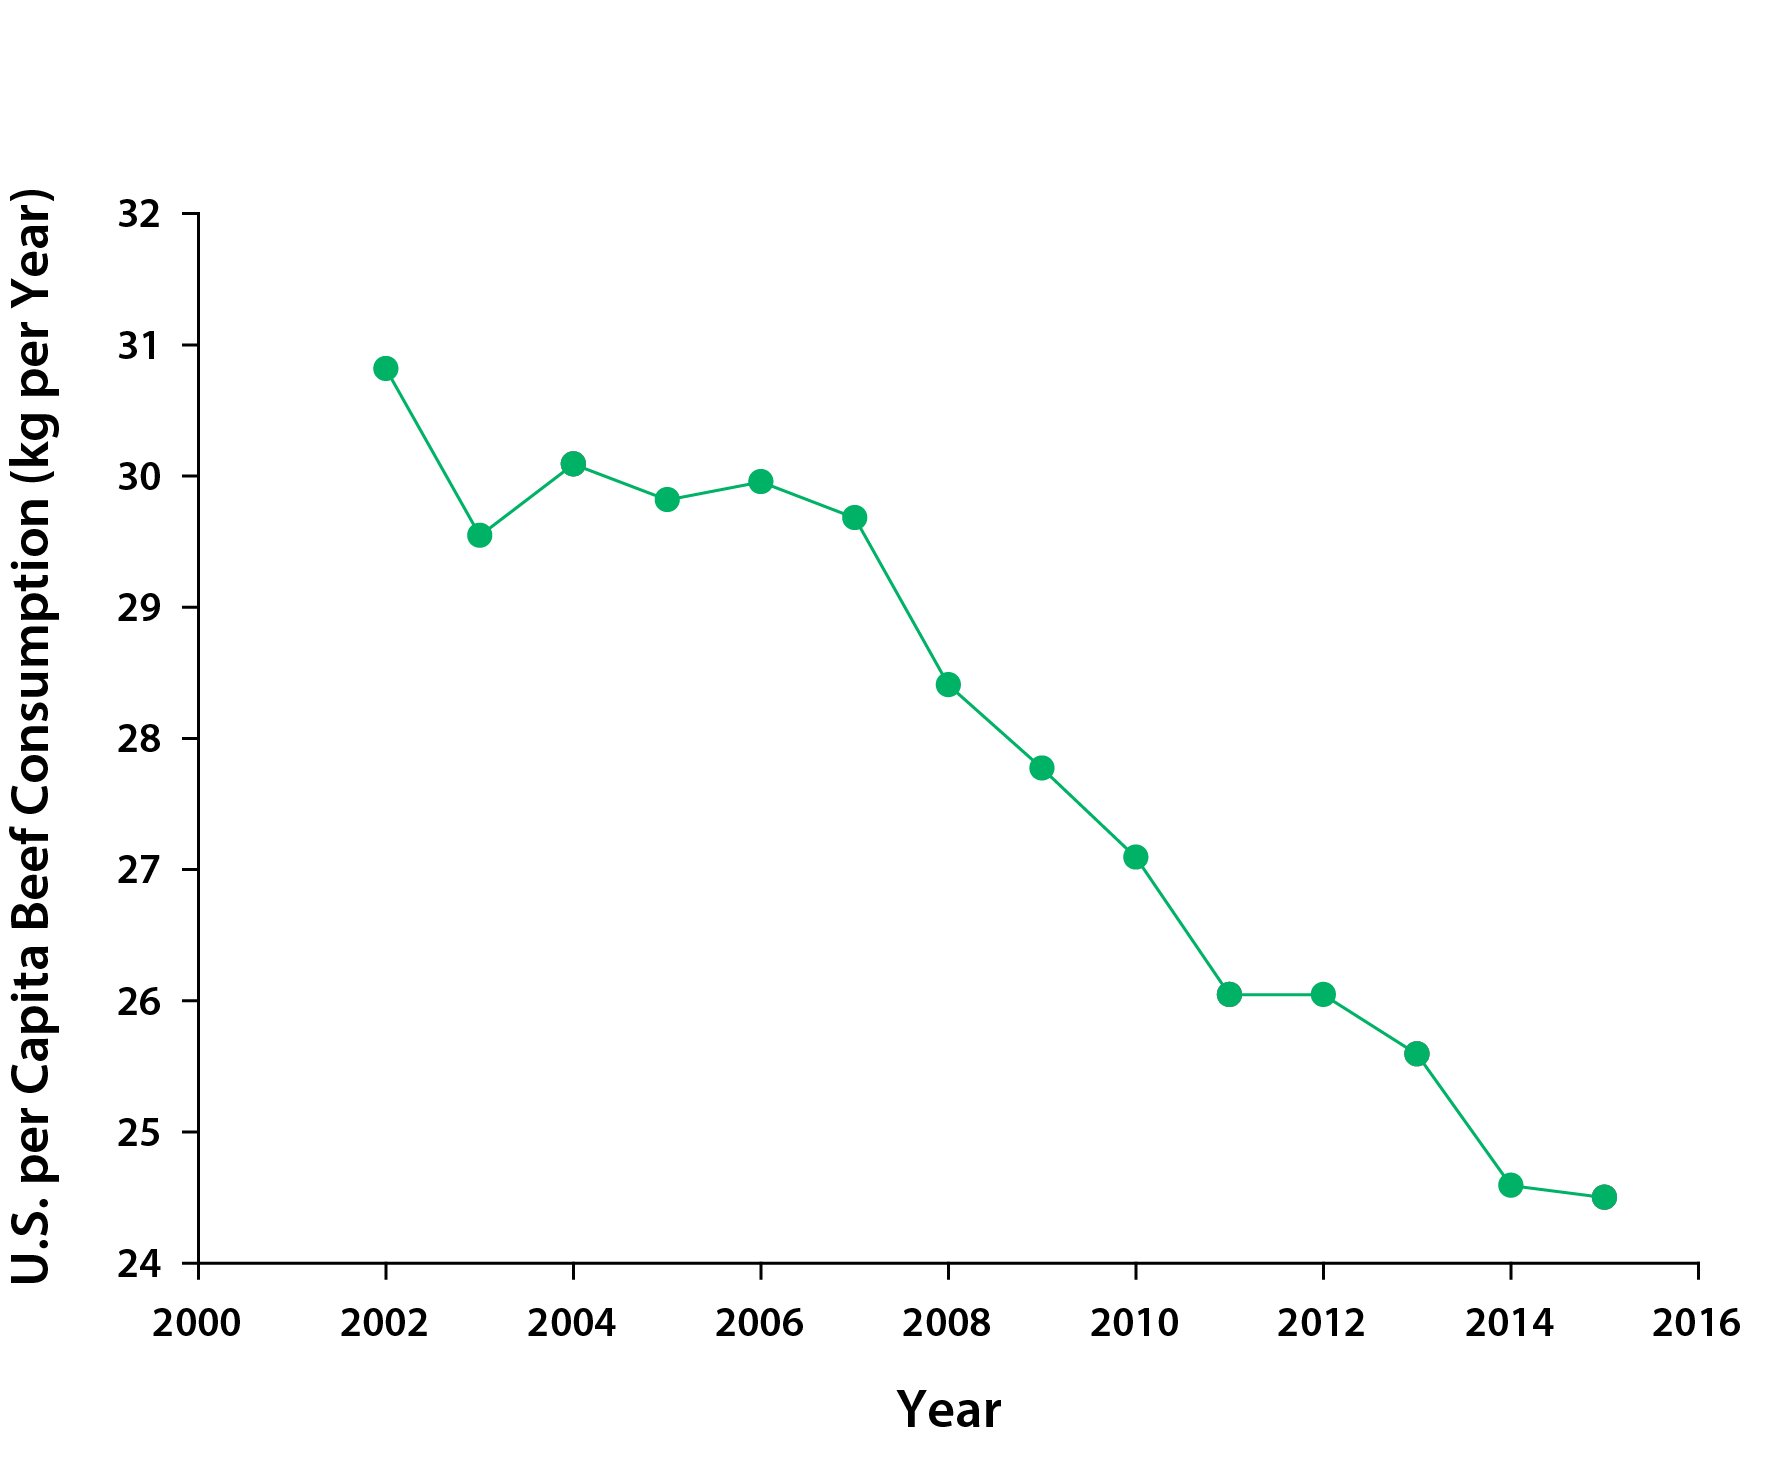
Figure 5.4: U.S. per Capita Total Consumption of Dairy Products
The strong influence of these carbon-intensive food consumption patterns on the global carbon cycle highlights the challenge of assigning emissions to a particular country. As mentioned previously, 2.5% of beef consumed in the United States is imported from Canada. Most inventories assign these emissions to the country where production occurs, but a main lever that could influence GHG emissions associated with this production rests, in this case, with the United States, because demand is a strong driver of supply and production.
5.4.2 Climate Change Effects and Feedbacks on Carbon
Climate change, including changes in temperature, precipitation, and the frequency of extreme events, could alter the productivity of agricultural systems through its effects on plant and animal growth as well as carbon sequestration and storage by influencing soil respiration and plant allocation to soil carbon. Climate change also could have an indirect effect on enteric CH4 emissions (i.e., from ruminant animals) and directly influence manure and soil-derived CH4 emissions through temperature increases. The effect on enteric emissions is through increased or decreased feed (i.e., dry matter) intake; projected increased ambient temperatures can decrease dry matter intake and thus proportionally reduce enteric CH4 emissions. As an example, the average maximum temperature for the northeastern United States is projected to increase 6.5°C by 2100 (projected by Representative Concentration Pathway 8.5, a high-emissions scenario). This temperature increase is expected to decrease dry matter intake of dairy cows in the region by an additional 0.9 kg per day due to heat stress (Hristov et al., 2017a). This decreased intake will amount to a reduction in daily enteric CH4 emissions of about 17 g per cow. If this reduction is extrapolated over 365 days and 1.4 million cows in the northeastern United States, the increased temperature will lead to a decrease in enteric CH4 emissions from dairy cows of about 8.7 metric tons per year, but the net effect on CO2e per kg of product depends on the effect of temperature on productivity. In contrast, increased temperatures are expected to increase manure CH4 emissions. The microbial decomposition of manure, producing CH4, is sensitive to temperature, so the projected climate changes suggest an increase in emissions of about 4% by midcentury and 8% by 2100 (Rotz et al., 2016).
Climate change effects on soil carbon sequestration will involve a balancing act between the impacts of elevated CO2, higher temperatures, and either increasing or decreasing precipitation depending on the region under consideration. Elevated CO2 and increased precipitation are expected to increase carbon inputs into systems and increase their potential to sequester carbon, whereas higher temperatures are expected to increase ecosystem respiration. Also, yields of major crops (corn, soybeans, wheat, and rice) are predicted to decline as global temperature increases (Zhao et al., 2017). Reduced precipitation or soil moisture along with the drying effects of warming would be expected to decrease plant production and carbon inputs in most upland systems. In unmanaged ecosystems, limited nitrogen availability could constrain the positive effects of elevated CO2 on plant growth (Norby et al., 2010; Thornton et al., 2007), although in managed pasture and hayland systems, fertilization would be expected to overcome such constraints. Tubiello et al. (2007) suggested that the balance between competing pressures would result in greater crop yields in temperate regions compared with those in semiarid and tropical regions. However, several analyses suggest that increased atmospheric CO2 will increase soil CO2 respiration by almost as much as the stimulation of inputs, resulting in little net change in soil carbon pools (Dieleman et al., 2012; Todd-Brown et al., 2014; van Groenigen et al., 2014). Because the potential effects of climate on soil carbon sequestration could be relatively small in most North American agricultural systems, at least compared with the large changes expected in the Arctic (Todd-Brown et al., 2014; see Ch. 11: Arctic and Boreal Carbon), management is projected to have a greater effect on carbon sequestration than will changes in climate (Álvaro-Fuentes and Paustian 2011; Lugato and Berti 2008).
See Full Chapter & References