<b>Hristov</b>, A. N., J. M. F. <b>Johnson</b>, C. W. Rice, M. E. Brown, R. T. Conant, S. J. Del Grosso, N. P. Gurwick, C. A. Rotz, U. M. Sainju, R. H. Skinner, T. O. West, B. R. K. Runkle, H. Janzen, S. C. Reed, N. Cavallaro, and G. Shrestha, 2018: Chapter 5: Agriculture. In Second State of the Carbon Cycle Report (SOCCR2): A Sustained Assessment Report [Cavallaro, N., G. Shrestha, R. Birdsey, M. A. Mayes, R. G. Najjar, S. C. Reed, P. Romero-Lankao, and Z. Zhu (eds.)]. U.S. Global Change Research Program, Washington, DC, USA, pp. 229-263, https://doi.org/10.7930/SOCCR2.2018.Ch5.
Agriculture
Agricultural land carbon storage and loss are the net result of multiple fluxes including plant photosynthetic uptake (i.e., atmospheric CO2 capture by plants), ecosystem respiratory loss (i.e., carbon released as CO2 from plants and soil organisms), harvested biomass removal either by grazing or cutting, input from additional feeds, enteric methane (CH4) production by livestock, and the return of manure by grazing animals or addition of manure or other carbon-rich fertilizer amendments to agricultural lands.
5.3.1 Perennial Systems
The most extensive perennial systems in North America are grasslands, pasture, and hayed lands (see Ch. 10: Grasslands). Other perennial crops (i.e., crops growing and harvested over multiple years) of regional importance include tree crops (mostly fruit and nuts) and vineyards. Because many perennial fruit, nut, and vegetable systems generally are intensively managed, the type of management—such as cover crops and intercropping, irrigation and tillage, fertilizer use, and intensity of cultural activities—largely determines the carbon balance of these production systems. Additionally, biofuel feedstock crops, including perennial grasses and short-rotation woody crops, occupy a very small percentage of agricultural land area, but they have the potential to either sequester carbon or create a carbon debt, depending on the system and land use that the system replaced (e.g., Adler et al., 2007, 2012; Mladenoff et al., 2016). Although differences in net carbon and GHG balance do exist, perennial bioenergy crops generally increase soil carbon in lands converted from annual crops because belowground carbon allocation (to roots) increases once the crops are established, even though the biomass is harvested for energy (Anderson-Teixeira et al., 2013; Valdez et al., 2017). However, managing perennials as biofuel crops often requires additional nitrogenous fertilizer, which can increase nitrous oxide (N2O) emissions and reduce the associated mitigation potential (Johnson and Barbour 2016; see Ch. 3: Energy Systems).
Perennial systems avoid the 4- to 8-month fallow period common among many annual row-crop systems (Drinkwater and Snapp 2007); therefore, perennial plants can use the sun’s energy to drive photosynthesis outside the typical growing season (Baker and Griffis 2005), contributing to increased soil carbon sequestration as compared to annual systems (Sainju et al., 2014). In agricultural systems dominated by perennial plants, photosynthesis generally, but not always, exceeds ecosystem respiration, so on balance these ecosystems remove more CO2 from the atmosphere than they contribute each year (Gilmanov et al., 2010). The total net amount of CO2 exchanged between perennial systems and the atmosphere varies among regions, with net carbon loss occurring most often in drought-prone and desert systems (Liebig et al., 2012). In grazed ecosystems, better management practices, such as prescribed grazing, adaptive multipaddock grazing, improved grass species and introduction of legumes, fertilization, and irrigation, generally will increase soil carbon sequestration (Conant et al., 2001; Teague et al., 2013). Estimates of the potential for U.S. pasture and hayed lands to sequester carbon (with improved management) vary, ranging from near 0 to 3 or more megagrams of carbon (Mg C) per hectare per year, with reasonable mean values of up to about 0.5 Mg C per hectare per year (Conant et al., 2001).
When productivity increases in agricultural systems, land managers frequently remove more aboveground biomass. In some cases, this increase in carbon removal by harvesting offsets the amount of carbon that would otherwise be sequestered, but the main driver of soil carbon sequestration is the production of belowground biomass that is not removed from the field. As a result, increased forage productivity often is associated with increased soil carbon sequestration (Allard et al., 2007; Ammann et al., 2007; Cong et al., 2014; Skinner and Dell 2016) because increased aboveground biomass normally is associated with increased belowground biomass. Initial conditions and ecosystem characteristics influence carbon sequestration potential. Depleted soils likely will accumulate additional carbon, whereas soils in which carbon inputs and outputs are roughly equal will show no change or perhaps a net loss of carbon over time (Smith 2004). Grazed pastures typically sequester more soil carbon than hayed land (Franzluebbers and Stuedemann 2009; Franzluebbers et al., 2000; Senapati et al., 2014) because cutting can cause a greater initial reduction and slower recovery in photosynthetic uptake of carbon than grazing (Skinner and Goslee 2016). Perennial root systems also become active early and remain active late in the growing season and thus can take up and use reactive nitrogen before it is lost from the system. The capture and efficient use of nitrogen (e.g., nitrate and ammonia applied at the correct time and rates) can avoid nitrogen losses. As a result, N2O emissions for perennial systems are typically much lower than those for annual systems (Ma et al., 2000; Qin et al., 2004; Robertson and Vitousek 2009).
5.3.2 Annual Systems
As with perennial systems, carbon storage or loss in annually cropped lands is the net result of inputs from unharvested plant residue (especially below ground); root exudation and turnover; organic matter deposition; soil amendments such as manure; and losses from respiration, residue, leaching, soil organic matter mineralization (decomposition), and harvested biomass removal. In turn, these input and output pathways respond to previous and current land use, soil properties (e.g., soil type and depth), climate, and other environmental factors. Typically, annual cropping systems are managed intensively; as such, their associated carbon stocks are closely related to land management choices (e.g., tillage, crop and crop rotation, residue management, fertilizer and nutrient inputs, extent and efficiency of drainage, and irrigation and use of cover crops) and the duration of those practices.
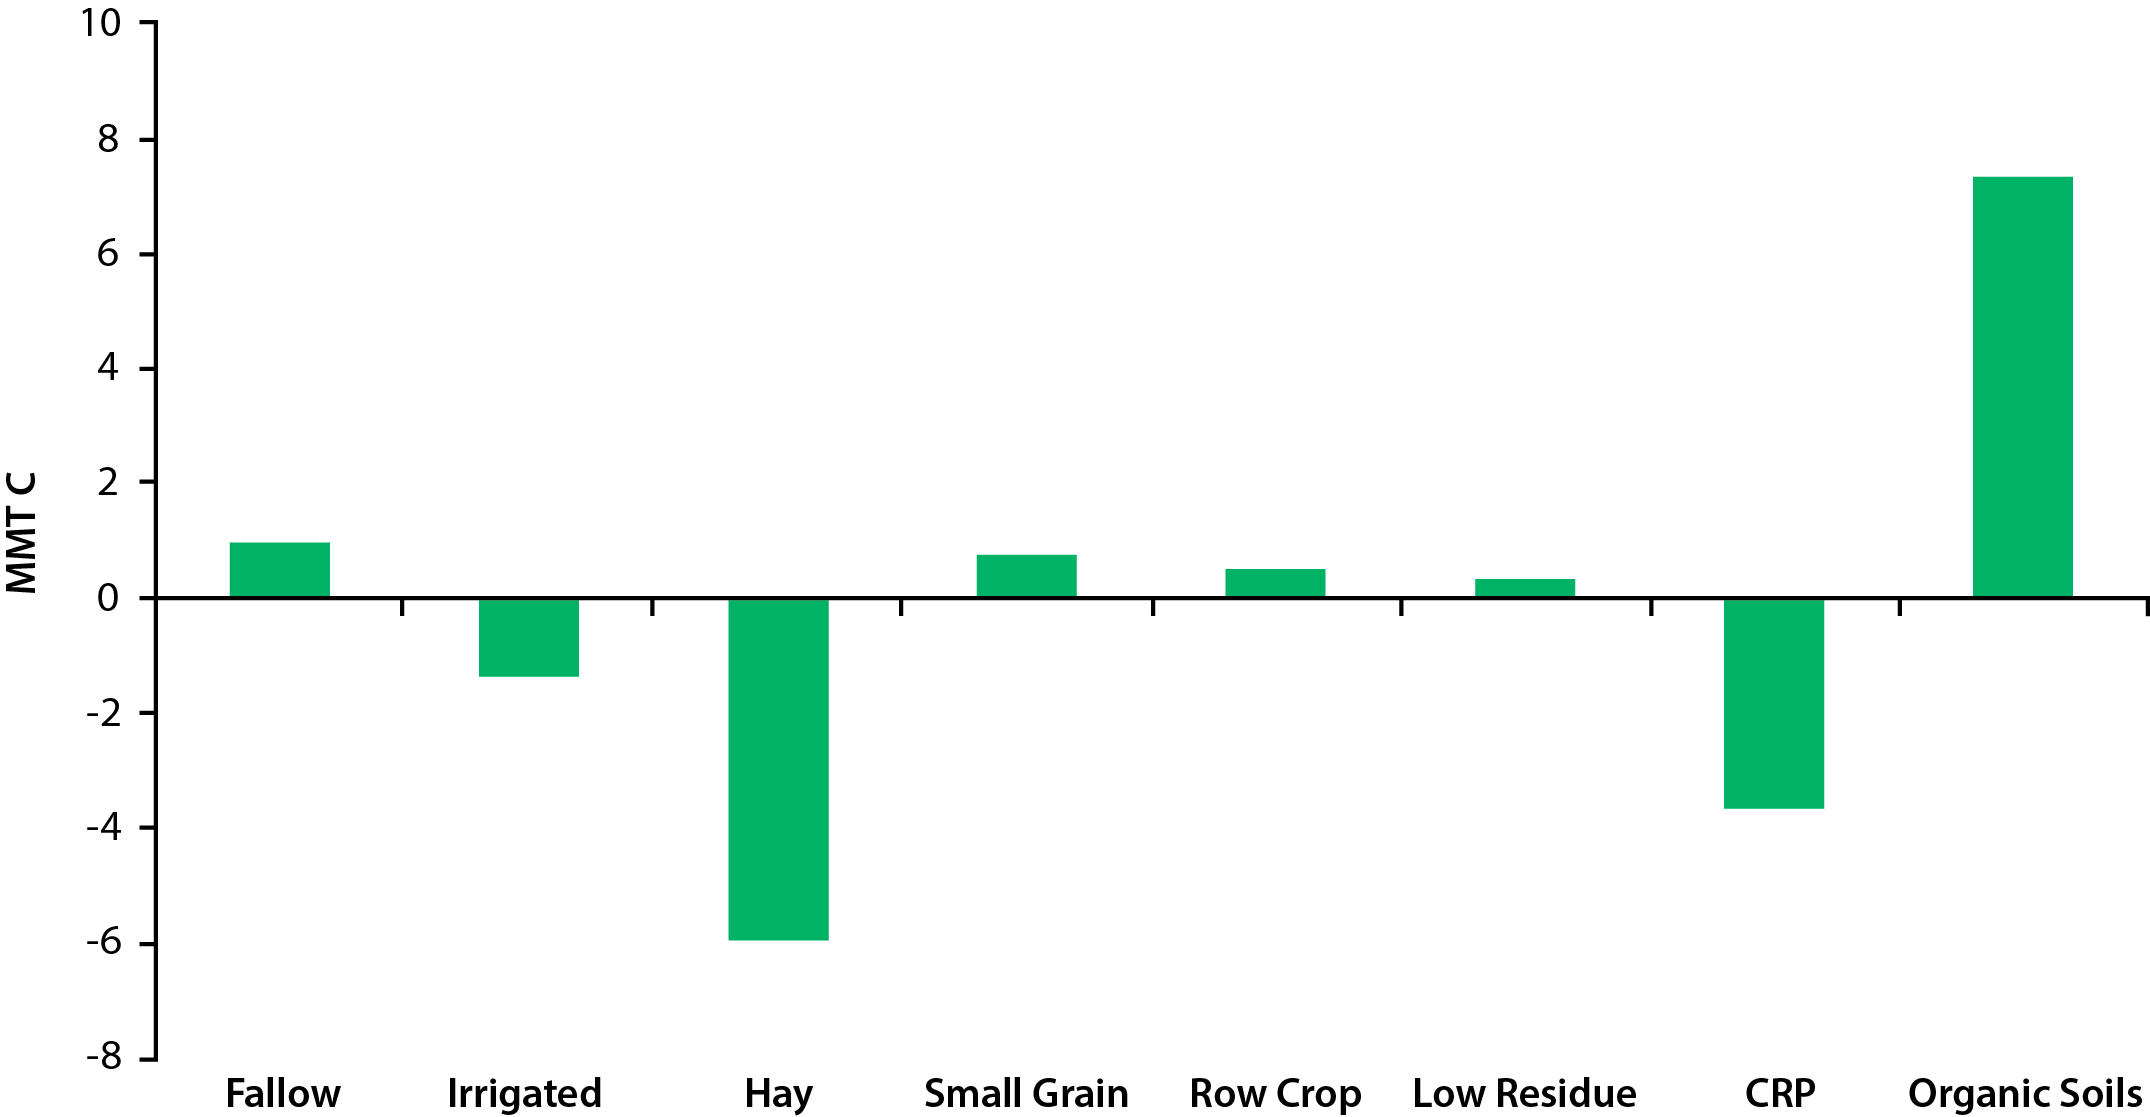
Studies to date suggest that annually cropped mineral soils in the United States sequester a small amount of carbon, but carbon emissions from cropped organic soils and a number of other farm management practices largely offset this benefit (Del Grosso and Baranski 2016; U.S. EPA 2016; see Figure 5.2). Cropped organic soils (e.g., Histosols) comprise only a small portion (<1%) of overall U.S. cropland, but these organic soils can be a large source of atmospheric carbon on a per area basis. This carbon loss occurs because cropped organic soils commonly result from draining wetlands, which greatly enhances decomposition rates in these high-carbon soils that, historically, have been under water and relatively safe from decomposition. Reversion of these drained and cropped organic soils to wetlands or flooded rice production slows the soil carbon losses but also can result in increased CH4 and N2O emissions, implying that water management can play a key role in the net carbon and GHG balances (Bird et al., 2003; Deverel et al., 2016; Oikawa et al., 2017). However, N2O does not necessarily increase with land-use conversion to paddy rice because there is evidence of N2O uptake by recently converted upland crops to flooded rice (Ye and Horwath 2016). Other practices that tend to lead to carbon loss include leaving land fallow without vegetation, growing low-residue crops (e.g., cotton), and plowing intensively (USDA 2014). Conversely, several practices may increase soil carbon stocks, such as including hay and grass in annual crop rotations, growing cover crops, maintaining plant cover, reducing the fallow (vegetation-free) period by increasing cropping intensity especially on marginal land as encouraged by CRP, and possibly reducing tillage intensity (USDA 2014). This increase in soil carbon stocks can vary by ecosystem but is particularly prevalent where these practices are used on soils previously depleted of their original carbon stores.
Figure 5.2: Soil Carbon Fluxes for Major Cropping Systems in the United States
Compared to perennial crops, annual crop systems tend to have higher nitrogen losses, including N2O emissions. In addition, nitrogen fertilizer additions generally lead to increased CH4 emissions and decreased CH4 oxidation from soils, particularly under anoxic conditions or flooded soil systems such as rice (Liu and Greaver 2009).
5.3.3 Livestock Systems
The North American livestock sector currently represents a significant source of GHG emissions, generating CO2, CH4, and N2O throughout the production process. Livestock contributions to GHG emissions occur either directly (e.g., from enteric fermentation and manure management) or indirectly (e.g., from feed-production activities and conversion of forest into pasture or feed crops).
Enteric Fermentation
Methane and CO2 are natural end-products of microbial fermentation of carbohydrates and, to a lesser extent, amino acids in the rumen of ruminant animals and the hindgut of all farm animals. Methane is produced in strictly anaerobic conditions by highly specialized methanogenic microbes. In ruminants, the vast majority of enteric CH4 production occurs in the rumen (i.e., the largest compartment of the ruminants’ complex stomach); rectal emissions account for about 3% of total enteric CH4 emissions (Hristov et al., 2013b). Methanogenic microbes inhabit the digestive system of many monogastric and nonruminant herbivore animals (Jensen 1996). In these species, CH4 is formed by processes like those occurring in the rumen and is similarly increased by intake of fibrous feeds. Summarizing published data, Jensen (1996) estimated that a 100-kg pig produces about 4.3% of the daily CH4 emissions of a 500-kg cow. Nonruminant herbivore animals such as horses consume primarily fibrous feeds and emit greater amounts of CH4 than nonruminant species that consume primarily nonfibrous diets, but a horse’s CH4 production per unit of body weight is still significantly less than that of ruminants. Wild animals, specifically ruminants (e.g., bison, elk, and deer), also emit CH4 from enteric fermentation in their complex stomachs or the lower gut. The current contribution of wild ruminants to global GHG emissions is relatively low (Hristov 2012).
The U.S. Environmental Protection Agency (EPA) reports that CH4 emissions from enteric fermentation and manure management amounted to about 232.8 teragrams (Tg) per year CO2e (functionally equivalent to 63.5 Tg C) in 2015, with an additional 17.7 Tg per year CO2e (4.8 Tg C) as N2O emitted from manure management (U.S. EPA 2018). Combined, these emissions represented 3.8% of total U.S. GHG emissions. About 97% of the enteric fermentation and 57% of the CH4 emissions from manure management were from beef and dairy cattle; 78% of the N2O emissions from manure management also were attributed to beef and dairy cattle. These estimates are derived from a “bottom-up” approach that begins with estimates of emissions on a per-animal basis and multiplies those estimates over total relevant numbers of animals. “Top-down” approaches, based on measurements of changes in GHG concentrations over large areas and inferences about the sources of those changes, yield different estimates for CH4 emissions. Combining satellite data and modeling, several studies proposed that livestock emissions may range from 40% to 90% greater than EPA estimates (Miller et al., 2013; Wecht et al., 2014). There is more uncertainty in predicting CH4 emissions from manure, partially because these emissions depend heavily on the particular manure handling system and temperature. The sources of discrepancy between the top-down and bottom-up approaches need to be identified to derive accurate estimates for both total and livestock CH4 emissions in North America (NASEM 2018).
There is no disagreement, however, that cattle are a significant source of CH4 emissions. Based on U.S. EPA (2018) estimates, CH4 emissions from cattle make up 25.9% of total U.S. CH4 emissions if only enteric emissions are counted, or 36.2% if emissions from manure management are included. In a national life cycle assessment of fluid milk, 72% of GHG emissions associated with milk production occurred on the farm, with 25% being from enteric CH4 fermentation. The remaining 28% was associated with processing, packaging, distribution, retail, and consumers (Thoma et al., 2013). A similar life cycle assessment of beef indicates that 87% of GHG emissions associated with beef are from cattle production, with only 13% resulting from post-farm processes (Asem-Hiablie et al., 2018). Similar to ruminants, animal production is the main contributor of GHG emissions in the swine industry. A life cycle assessment of the U.S. pork industry (Thoma et al., 2011) reported the following breakdown of emission contributions for each stage of the production cycle: 9.6%, sow barn (including feed and manure management); 52.5%, nursery-to-finish (including feed and manure handling); 6.9%, processing (including 5.6% for processing and 1.3% for packaging); 7.5%, retail (e.g., electricity and refrigerants); and 23.5%, the consumer (e.g., refrigeration, cooking, and CH4 from food waste in landfills). Major sources of GHG emissions in the poultry industry differ depending on the type of production. For broilers (i.e., meat-producing birds), feed production contributes 78% of the emissions; direct on-farm energy use, 8%; post-farm processing and transport of meat, 7%; and manure storage and processing, 6%. For layers (i.e., egg-producing birds), feed production contributes 69% of emissions; direct on-farm energy use, 4%; post-farm processing and transport, 6%; and manure storage and processing, 20% (MacLeod et al., 2013).
Manure Management
Manure can be a major source of GHG emissions, depending on the type of livestock. For ruminants, manure emissions normally are less than those from enteric production, but for nonruminants, manure is the major source of GHG emissions. Microbial activity breaks down organic carbon in manure, releasing both CH4 and CO2, and the amount of each produced is related to oxygen availability. Much of the carbon in manure eventually ends up in the atmosphere in one of these two forms, and because CH4 is a more powerful GHG than CO2, converting this biogenic carbon to CO2 would be beneficial.
Methane emissions from all manure produced and handled in the United States were estimated to be 66.3 Tg CO2e in 2015 (U.S. EPA 2018). These emissions occur in the housing facility, during long-term storage, and during field application (see Table 5.2). The housing facility usually is a relatively small source. Manure lying on a barn floor or open-lot surface is exposed to aerobic conditions where CH4 emissions are low (IPCC 2006; USDA-ARS 2016). Manure deposited by grazing animals also is exposed to aerobic conditions, with CH4 emissions similar to those from a barn floor or open lot. When manure in the housing facility is allowed to accumulate in a bedded pack up to a meter deep, anaerobic conditions develop, leading to greater CH4 emissions (IPCC 2006).
Table 5.2. Estimated Methane Emissions from Livestock Manure Sources in the United States
| Species | Portion Lost from Each Farm Source (%)a | Total Emissionsb (Teragrams of Carbon Dioxide Equivalent) |
||
|---|---|---|---|---|
| Housing Facility | Long-Term Storage | Field Application and Grazing | ||
| Dairy Cattle | 15 to 20 | 70 to 80 | 5 to 10 | 34.8 |
| Swine | 10 to 15 | 80 to 90 | 1 | 24.6 |
| Poultry | 45 to 55 | 45 to 55 | 1 | 3.4 |
| Beef Cattle | 10 to 15 | 15 to 20 | 60 to 70 | 3.1 |
| Horses | 5 | 35 | 60 | 0.2 |
| All Other | 5 | 35 | 60 | 0.1 |
| Total | 15 to 18 | 70 to 80 | 5 to 10 | 66.3 |
Notes
a Estimated from emissions factors (IPCC 2006) and experience with the Integrated Farm System Model (USDA-ARS 2016)
and assumed common manure management practices for each species.
b From U.S. EPA (2018); 2015 emissions data.
Long-term storage normally is the major source of carbon emissions from manure (see Table 5.2). Liquid or slurry manure typically is stored for 4 to 6 months prior to cropland application. During storage, anaerobic conditions are maintained in which CH4 formation and emission rates are largely controlled by manure temperature (IPCC 2006; USDA-ARS 2016). Longer storage periods will produce greater emissions. Manure solids can float to the surface, particularly in slurry manure, where a crust is formed. This natural crust can reduce storage CH4 emissions by 30% to 40% (IPCC 2006; USDA-ARS 2016). Solid manure may be stored up to several months in a stack with or without active composting. This type of storage maintains more aerobic conditions, which reduce CH4 emissions.
Following storage, manure typically is applied to cropland as a nutrient source for plant growth. During unloading from storage and field application, any CH4 remaining in the manure is released. These emissions are small compared to those from other sources. Following application of the manure spread onto the soil in a thin layer, aerobic conditions suppress further CH4 production. Manure also may be incorporated into the soil so that any CH4 produced is oxidized and consumed (Le Mer and Roger 2001). Thus, optimizing the timing, quantity, and incorporation of manure applications with plant productivity and growth patterns and needs can reduce the associated CH4 and N2O emissions.
See Full Chapter & References