<b>Gurney</b>, K. R., P. <b>Romero-Lankao</b>, S. <b>Pincetl</b>, M. Betsill, M. Chester, F. Creutzig, K. Davis, R. Duren, G. Franco, S. Hughes, L. R. Hutyra, C. Kennedy, R. Krueger, P. J. Marcotullio, D. Pataki, D. Sailor, and K. V. R. Schäfer, 2018: Chapter 4: Understanding urban carbon fluxes. In Second State of the Carbon Cycle Report (SOCCR2): A Sustained Assessment Report [Cavallaro, N., G. Shrestha, R. Birdsey, M. A. Mayes, R. G. Najjar, S. C. Reed, P. Romero-Lankao, and Z. Zhu (eds.)]. U.S. Global Change Research Program, Washington, DC, USA, pp. 189-228, https://doi.org/10.7930/SOCCR2.2018.Ch4.
Understanding Urban Carbon Fluxes
Investigations across a variety of research disciplines (e.g., urban economics, urban planning, urban geography, and urban physics) have tried to discern the driving factors of per capita urban carbon fluxes. International comparisons have demonstrated that economic factors such as available income and energy price levels play crucial roles, but so do urban density profiles, building age and construction, climate, and technology (Creutzig et al., 2015a).
4.3.1 Consumption
Manufacturing of goods such as clothing emits carbon if energy consumption is satisfied by fossil fuels, but consumption of goods and services, production systems, and supply chains are the fundamental drivers of emissions. As mentioned in Section 4.2.1 accounting frameworks that reflect a consumption perspective will allocate to the importing consumer the carbon fluxes associated with the production of goods and services. In particular, urban populations in wealthier nations that are nominally decarbonizing or stabilizing their carbon emissions often have total emissions that are increasing once traded carbon is considered in this way (Baiocchi and Minx 2010; Peters et al., 2011). Movement of goods among nations often is a result of trade policy, labor, and land costs that drive production location choices (Hertwich and Peters 2009). In U.K. cities, for example, a large carbon footprint is embedded in trade with large import partners such as China (Baiocchi and Minx 2010; Minx et al., 2013). Trade agreements, such as the North American Free Trade Agreement, have shifted automobile production and clothing manufacturing, along with their associated carbon emissions, from the United States to Canada and Mexico (Shui and Harriss 2005).
4.3.2 Economics—Wealth and Energy Prices
Economic development and urbanization reinforce each other through co-location of activities and investments (Fujita et al., 1999). In a global typology of cities, per capita gross domestic product (GDP) is identified as the most relevant sorting variable; transportation fuel prices also are relevant, distinguishing emissions among richer cities (Creutzig et al., 2015a). Urban development theories suggest that factors such as the clustering of investment and production, land development and transportation policies, and fuel prices shape urban form over the long run. For instance, incentives for dense urbanization exist when fuel prices are high and for sprawled suburbanization when prices are low, though legacy land uses—initiated during low fuel prices—continue to drive private automobile transportation use (Creutzig 2014; Fujita 1989). More recent urbanization patterns in mature cities have trended toward rehabitation or gentrification of urban cores. However, more time is needed to know the long-term impact of these patterns and whether they represent a shift toward lower GHG emissions due to less reliance on automobiles (Florida 2010). Cities also create new public transportation systems to reduce automobile dependence, but carbon fluxes from infrastructure creation remain significant in the short term (Chester et al., 2013). In an international comparison, the United States belongs to a grouping of countries with high incomes but low fuel prices. A nationwide study estimating U.S. household flux at the zip code level found that the number of vehicles per household and annual household income were the most relevant variables explaining estimated household carbon emissions (Jones and Kammen 2014). This finding illustrates the difficulties of meeting multiple policy objectives in most North American cities; when priority is given to development and urbanization, there are implications for the carbon cycle (Romero-Lankao et al., 2015, 2017).
4.3.3 Behavior—Lifestyles and Norms
Urban mobility in North America is dominated by personal automobile use, shaping and reconfiguring daily urban life (Sheller and Urry 2000). Lifestyles and norms clearly play a powerful role in explaining everyday decisions about urban mobility and energy use, but their importance as drivers for carbon emissions generally has not been studied quantitatively (Axsen and Kurani 2012; Mattauch et al., 2016; Wilson and Dowlatabadi 2007). In the United Kingdom, lifestyle changes could contribute as much to climate mitigation in the transport sector as technological changes (Anable et al., 2012). A typology of residential carbon emissions reveals that infrastructure patterns are mirrored in lifestyle classes. For example, low-emitting households in the dense urban cores of London and some U.S. cities typically are either “young professionals” or “multicultural inner city” communities of young people seeking inner-city living with downsizing or elimination of personal automobiles. Households in peri-urban London having higher emissions mostly identify as “affluent urban commuters” living in relatively inefficient houses (Baiocchi et al., 2015). However, whether these patterns are indicative of a long-term shift or merely a short-term adjustment is unclear. Another example from the Los Angeles Energy Atlas finds that wealthy neighborhoods have higher per capita energy consumption than low-income residents who have higher consumption per unit area (Porse et al., 2016). In Salt Lake City, Utah, increments of wealth among high-income residents were found to lead to greater residential CO2 emissions than those of low-income residents (Patarasuk et al., 2016). A systematic investigation of lifestyles, especially in interaction with urban infrastructures, has been identified as a major priority for further research (Creutzig et al., 2016). Social norms and behavior patterns in terms of energy use and consumption also exhibit carbon “lock-in,” whereby norms act in isolation and in concert with institutional and technological constraints to add inertia to existing patterns of consumption and carbon emissions (see further details in Section 4.3.5).
4.3.4 Urban Form and Density
Research has identified urban form and the density of cities as key drivers of urban carbon emissions (Baiocchi et al., 2015; Creutzig et al., 2015a; Karathodorou et al., 2010; Mindali et al., 2004; Newman and Kenworthy 1989, 1999). In theory, dense settlement affords energy efficiencies by encouraging multidwelling living, reduced travel distances, public transit use, and walking and cycling (Boyko and Cooper 2011; Oleson et al., 2008). In the United States, analysis has shown declines in per capita carbon emissions with increasing population density at densities greater than 1,158 persons per km2 (Jones and Kammen 2014). At lower densities, typical of suburban areas, carbon emissions rise with increases in density (Glaeser and Kahn 2010; Jones and Kammen 2014). These results are supported by recent research on transportation energy consumption (Liddle 2014), electricity consumption in buildings (Lariviere and Lafrance 1999), and overall urban carbon emissions (Marcotullio et al., 2013). A recent study found that the high correlation between per capita electricity use and urbanized area per person can be explained by the higher per capita building floor area in less-dense cities (Kennedy et al., 2015).
Urban form and density are determined by local plans, existing infrastructure, land costs, and public attitudes (Ewing and Rong 2008). These factors often are determined by local actions and constrained by national, state, or other regulations, such as the Federal Emergency Management Agency’s 100-Year Flood Maps, insurance policies, and perceived costs of existing infrastructure and land. Change in land-use patterns, as well as services such as public transportation, require long-term commitment, public support, and funding. Once a pattern has been set, it tends toward obduracy, making change difficult (Unruh 2000). Zoning codes that segregate land uses contribute to urban sprawl and a car-dependent road infrastructure that, in turn, influences carbon emissions (Fischel 2015; Hamin and Gurran 2009). These rules vary across states, provinces, and cities because of different relationships of autonomy between cities and other governmental scales. Policy drivers may be generated at the different scales, including national (e.g., transportation infrastructure investments), state, provincial (e.g., requirements for cities to create general plans or set building codes), or city (e.g., specific zoning codes; Knaap et al., 2015). These rules, codes, and standards establish frameworks for cities, including facilitating sprawled urban form through road subsidies or land regulation or encouraging density and efficient building through strict building codes and tax policy that discourages automobile use and ownership (Grazi and van den Bergh 2008). Stricter land-use regulation can induce sprawl development in nearby suburban and peri-urban areas, an occurrence that may increase overall carbon emissions. That is, cities with stricter land-use regulations externalize development to adjacent communities with more lenient regulations, engendering higher rates of suburbanization in the region (Glaeser and Kahn 2010). Harmonization of land-use regulation or higher fuel taxes can reduce the likelihood of this outcome.
4.3.5 Technology
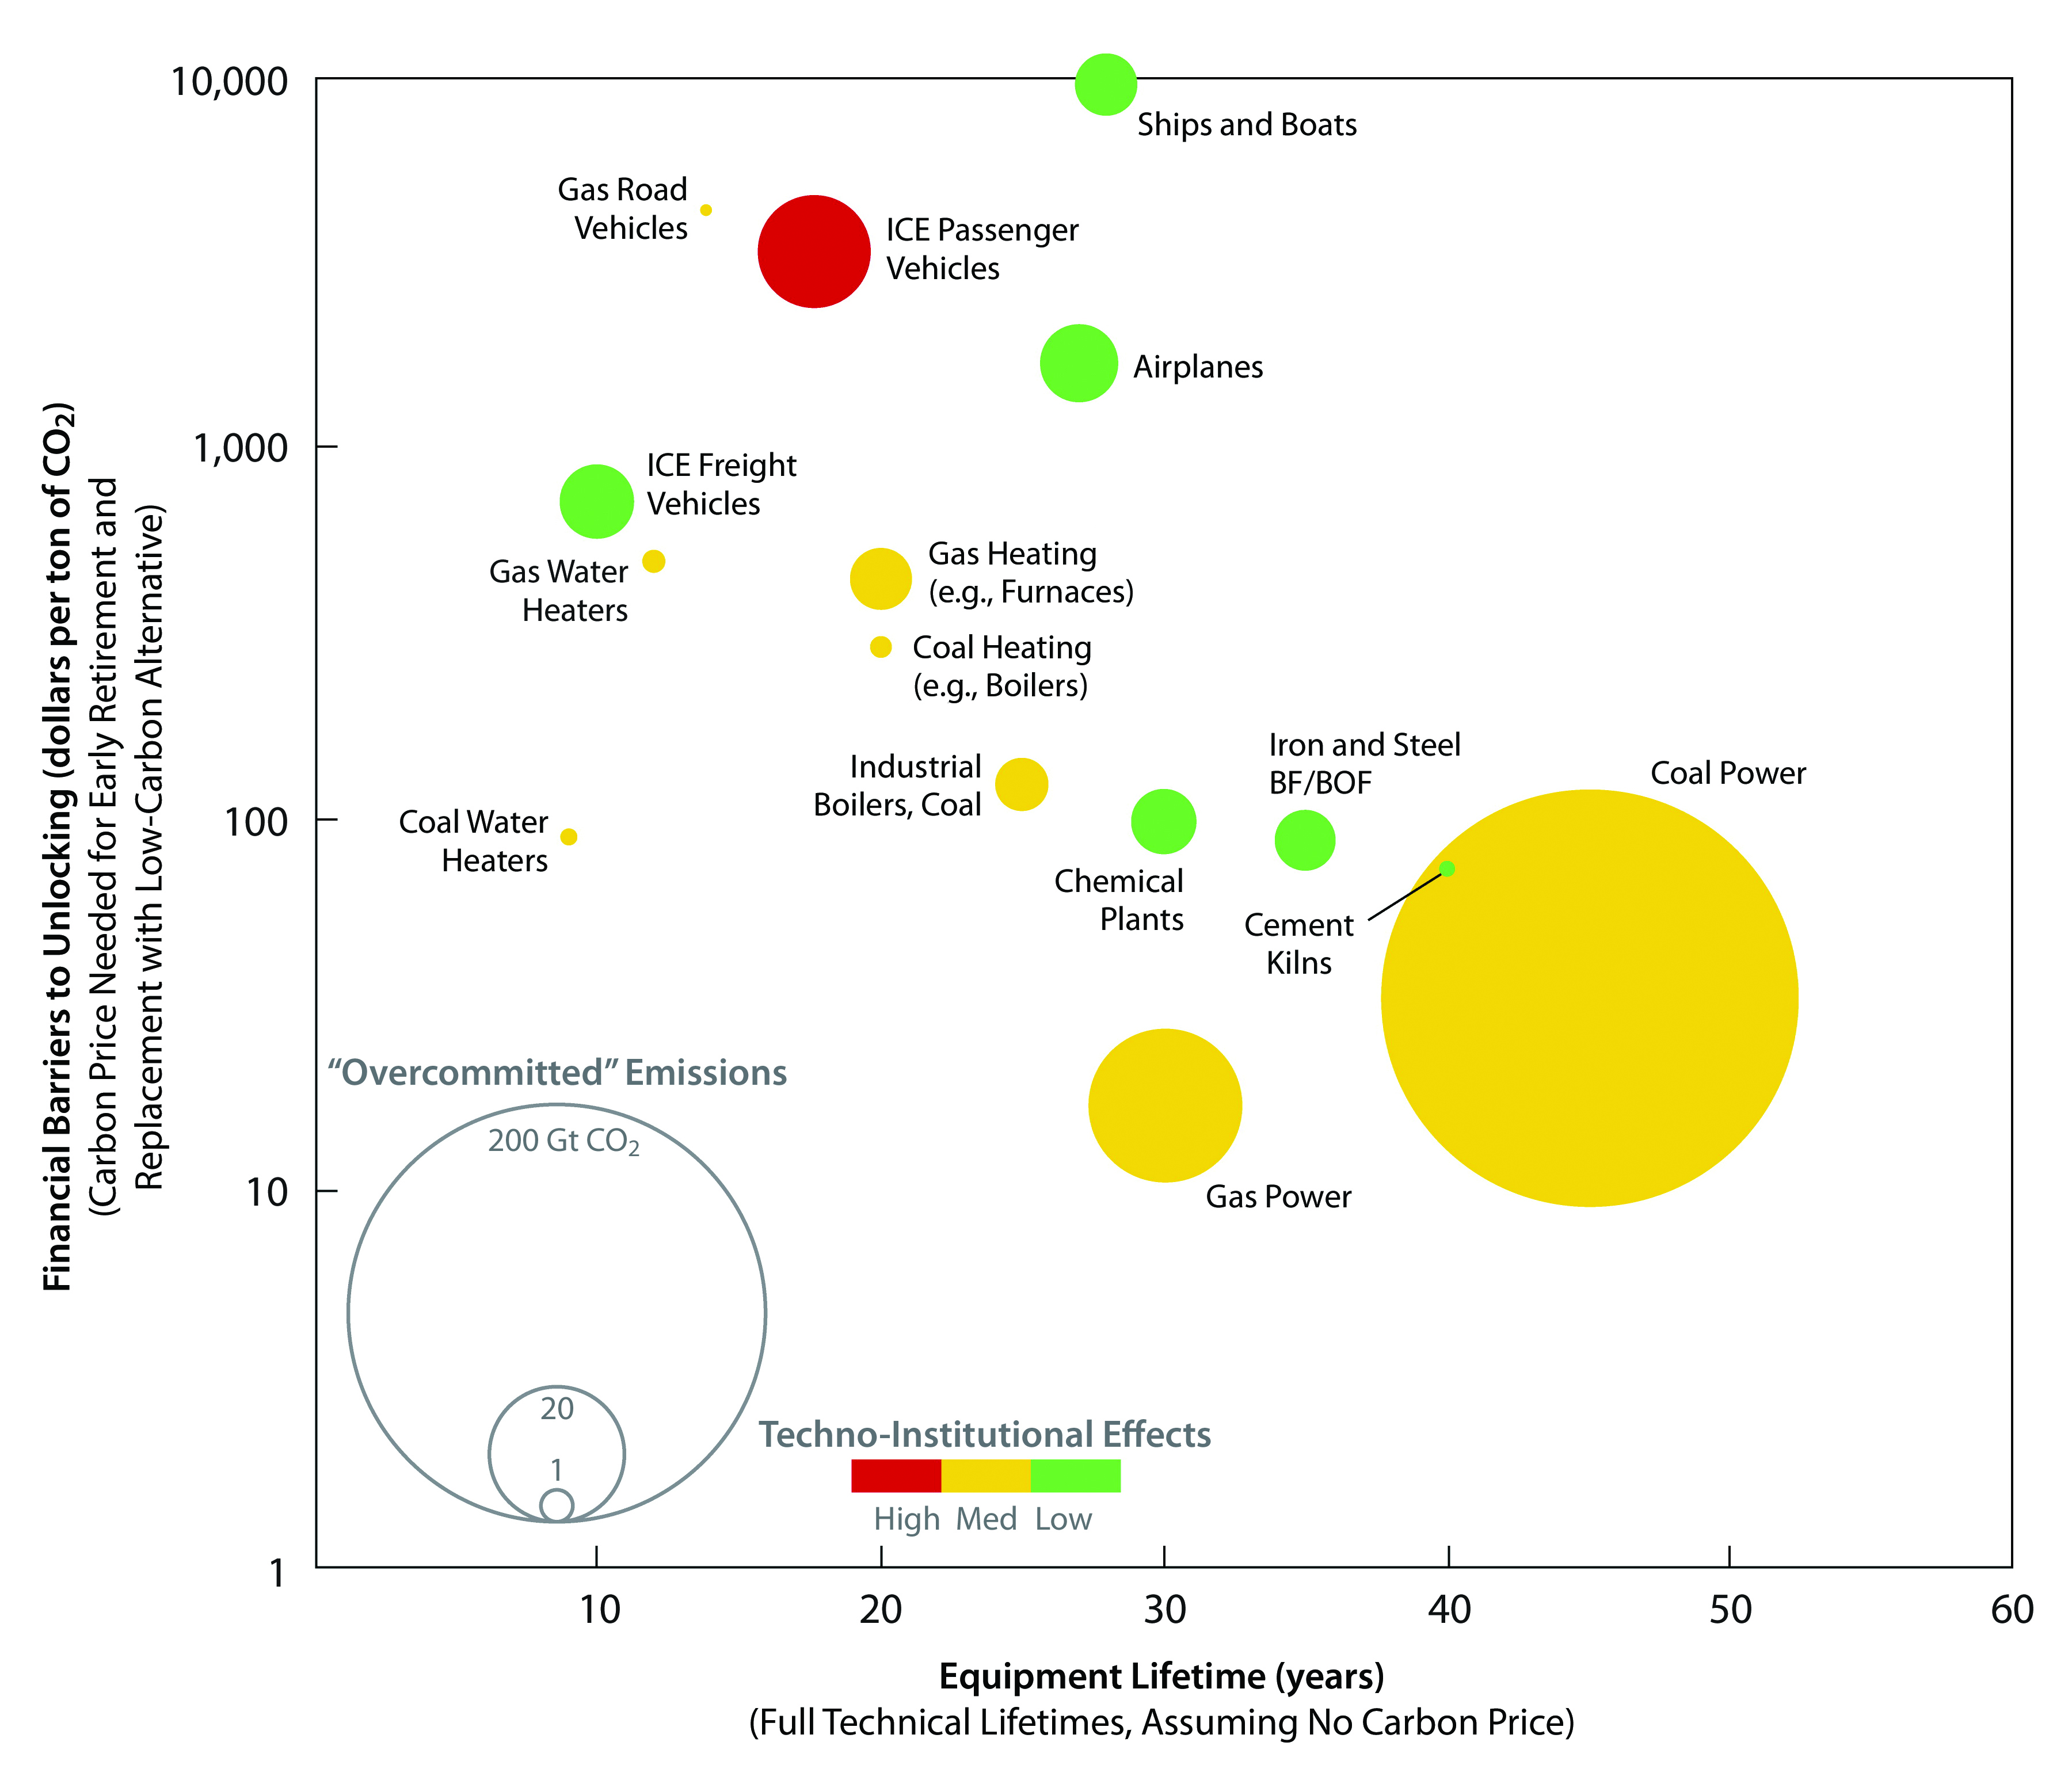
Technological attributes, such as power generation (see Ch. 3: Energy Systems), urban design, and waste processing, partly determine city profiles for carbon emissions (Kennedy et al., 2009). Availability of low-carbon technologies reduces urban per capita carbon emissions. For example, cities with carbon intensity of electricity below approximately 600 metric tons (t) CO2 equivalent2 (CO2e) per gigawatt hour (GWh), such as Los Angeles, New York City, and Toronto, can reduce life cycle carbon emissions through electrification of transportation and heating systems (Kennedy 2015; Kennedy et al., 2014). However, because of the relative permanence of large technological and infrastructural systems in urban areas, the notion of infrastructure lock-in is critical and often makes shifts to low-carbon technologies and systems costly or not feasible (Unruh 2000). Lock-in results from the high cost of the infrastructure; the expended energy in the infrastructure; and the social systems of regulation, codes, and conventions that reinforce existing systems (Pincetl et al., 2016; Reyna and Chester 2015; Seto et al., 2016). However, technology is influenced by institutions, individual behavior, and policy actions (Chester et al., 2014), and technology has replacement or turnover cost implications with fossil fuel–burning infrastructure having lifetimes of up to 50 years (Erickson et al., 2015; see Figure 4.5). The issue of carbon lock-in is another example of the interactions, constraints, and opportunities that involve multiple scales of governance beyond urban domains.
Figure 4.5: Assessments of Lock-In Related to Different Types of Infrastructure Emitting Carbon Dioxide (CO2)
In 16 U.S. states and Washington, D.C., regulatory changes, such as Incentives for Renewables and Efficiency, are both facilitating and requiring decarbonization of energy (URL). U.S. public utilities commissions (PUCs) regulate the large investor-owned utilities, and PUCs of states such as New York and California are creating new regulatory frameworks for increased renewable energy generation, purchase, and storage to decrease reliance on fossil fuel–generated energy. In 2015, California established a 50% renewable portfolio standard for the electricity system that is to be accomplished by 2030 (Senate Bill 350). The state also adopted a new legal mandate in September 2016 requiring statewide reductions of GHG emissions by 40% from 1990 levels by 2030 (Senate Bill 32).
4.3.6 Climate
Local climate is also a modifier of urban carbon emissions in conjunction with socioeconomic and urbanization characteristics (Baiocchi et al., 2015; Creutzig et al., 2015a; Glaeser and Kahn 2010; Kennedy et al., 2015). Global climate change typically modifies local energy use by reducing heating and increasing air conditioning demands (Huang and Gurney 2016). Local climate also can be partly influenced by human activity via the UHI effect (Boehme et al., 2015; Georgescu et al., 2014; Oke 1982), which, in turn, drives changes in energy consumption and carbon emissions (Lin et al., 2015; Wang et al., 2010).
See Full Chapter & References