<b>Marcotullio<b>, P. J., L. Bruhwiler, S. Davis, J. Engel-Cox, J. Field, C. Gately, K. R. Gurney, D. M. Kammen, E. McGlynn, J. McMahon, W. R. Morrow, III, I. B. Ocko, and R. Torrie, 2018: Chapter 3: Energy systems. In Second State of the Carbon Cycle Report (SOCCR2): A Sustained Assessment Report [Cavallaro, N., G. Shrestha, R. Birdsey, M. A. Mayes, R. G. Najjar, S. C. Reed, P. Romero-Lankao, and Z. Zhu (eds.)]. U.S. Global Change Research Program, Washington, DC, USA, pp. 110-188, https://doi.org/10.7930/SOCCR2.2018.Ch3.
Energy Systems
This section identifies the major trends over the past 10 years that have shaped North American energy system dynamics and current understanding of the relationship between the energy system and the carbon cycle (see Table 3.3). Importantly, the North American energy system is undergoing a transformation. How the system ultimately will emerge is unclear, but the outlines of change are already evident.
Table 3.3. Five Major Trends, Indicators, Drivers, and Impacts on the Carbon Cycle
| Trends | Indicators | Drivers | Impacts on Carbon Cycle |
|---|---|---|---|
| Decline in energy use and carbon dioxide equivalent (CO2e)a emissions | Decrease in total energy use with declines in demand for oil products and a slowed rate of increase in electricity demand | Economic recession, lower carbon intensities of fuels due to switching to natural gas and increases in renewables, lower energy intensities due to efficient new technologies, governmental policies, and ongoing structural changes leading to lower energy intensity | Lower emissions |
| Natural gas transition | Larger primary energy contribution from natural gas, increase in natural gas reserves, expansion of fracking, fuel switching in electricity generation and industry | New technologies, policies, and market forces (prices) | Lower emissions (potentially) offset by methane leakage |
| Increased renewable energy | Larger number and capacity of wind and solar power–generation plants, resulting in larger contributions of these sources to electricity generation | New technologies, governmental policies, and market forces (prices) | Lower emissions |
| Aging infrastructure | Age of infrastructure, higher costs of replacement, and increasing examples of infrastructure failure | Lack of public financing and political action | Potentially higher emissions |
| New understanding of biofuels and fugitive (e.g., leaked) natural gas emissions | Increasing number of studies demonstrating land-use emissions from biofuel production and potentially large unaccounted- for emissions levels from natural gas extraction, transmission, and distribution | Better understanding of 1) fuel life cycle and 2) indirect impacts of fuel production, transmission, and distribution | Revised estimates of emissions (impact may be positive or negative) |
Notes
a Carbon dioxide equivalent (CO2e): Amount of CO2 that would produce the same effect on the radiative balance of Earth’s climate system as another greenhouse gas, such as methane (CH4) or nitrous oxide (N2O), on a 100-year timescale. For comparison to units of carbon, each kg CO2e is equivalent to 0.273 kg C (0.273 = 1/3.67). See Box P.2, in the Preface for details.
At least five major trends and a number of associated indicators demonstrate a shift from patterns described in SOCCR1. These new trends are 1) a decrease in energy use (e.g., reduced oil use and stable or reduced electricity demand) and total CO2e emissions since 2007, 2) an energy transition based on increased shares of natural gas in North America’s primary fuel mix and in electricity generation, 3) increased renewable energy inputs into the electrical system, 4) increased concern about aging energy-related infrastructure, and 5) new understanding that has altered thinking on the role of biofuels and natural gas in the carbon cycle. Each of these dynamics is described herein, first for the region and then for each economy within the region. The descriptions include historical and nationally comparable data from 2004 to 2013, with more recent information for some energy subsectors in individual nations. The section ends with a discussion of feedbacks related to energy use and energy-related CO2e emissions that are immediately important or may become important for regional energy systems in the near future.
3.4.1 Decline in Energy Use and CO2e Emissions
North American energy demand has decreased from 2004 to 2013 at about 1% annually. The greatest decreases occurred from 2007 to 2009 (see Figure 3.4). In 2004, North American total primary energy demand was about 127 EJ, rising to 128 EJ in 2007. After that, energy consumption decreased to a low of 120 EJ in 2009. Over the past 4 years, average annual consumption has equaled about 124 EJ. The largest decreases in energy were experienced by the United States, which fell from a high of 107 EJ in 2007 to 103 EJ in 2013. However, energy consumption in both Canada and Mexico slightly increased. For example, Canada’s primary energy use was 13.6 EJ in 2007 and 14.9 EJ in 2013. Mexico’s energy use was 7.1 EJ in 2007 and 7.7 EJ in 2013 (EIA 2016c).
Figure 3.4: North American Primary Energy Consumption and Carbon Emissions, 2000 to 2015
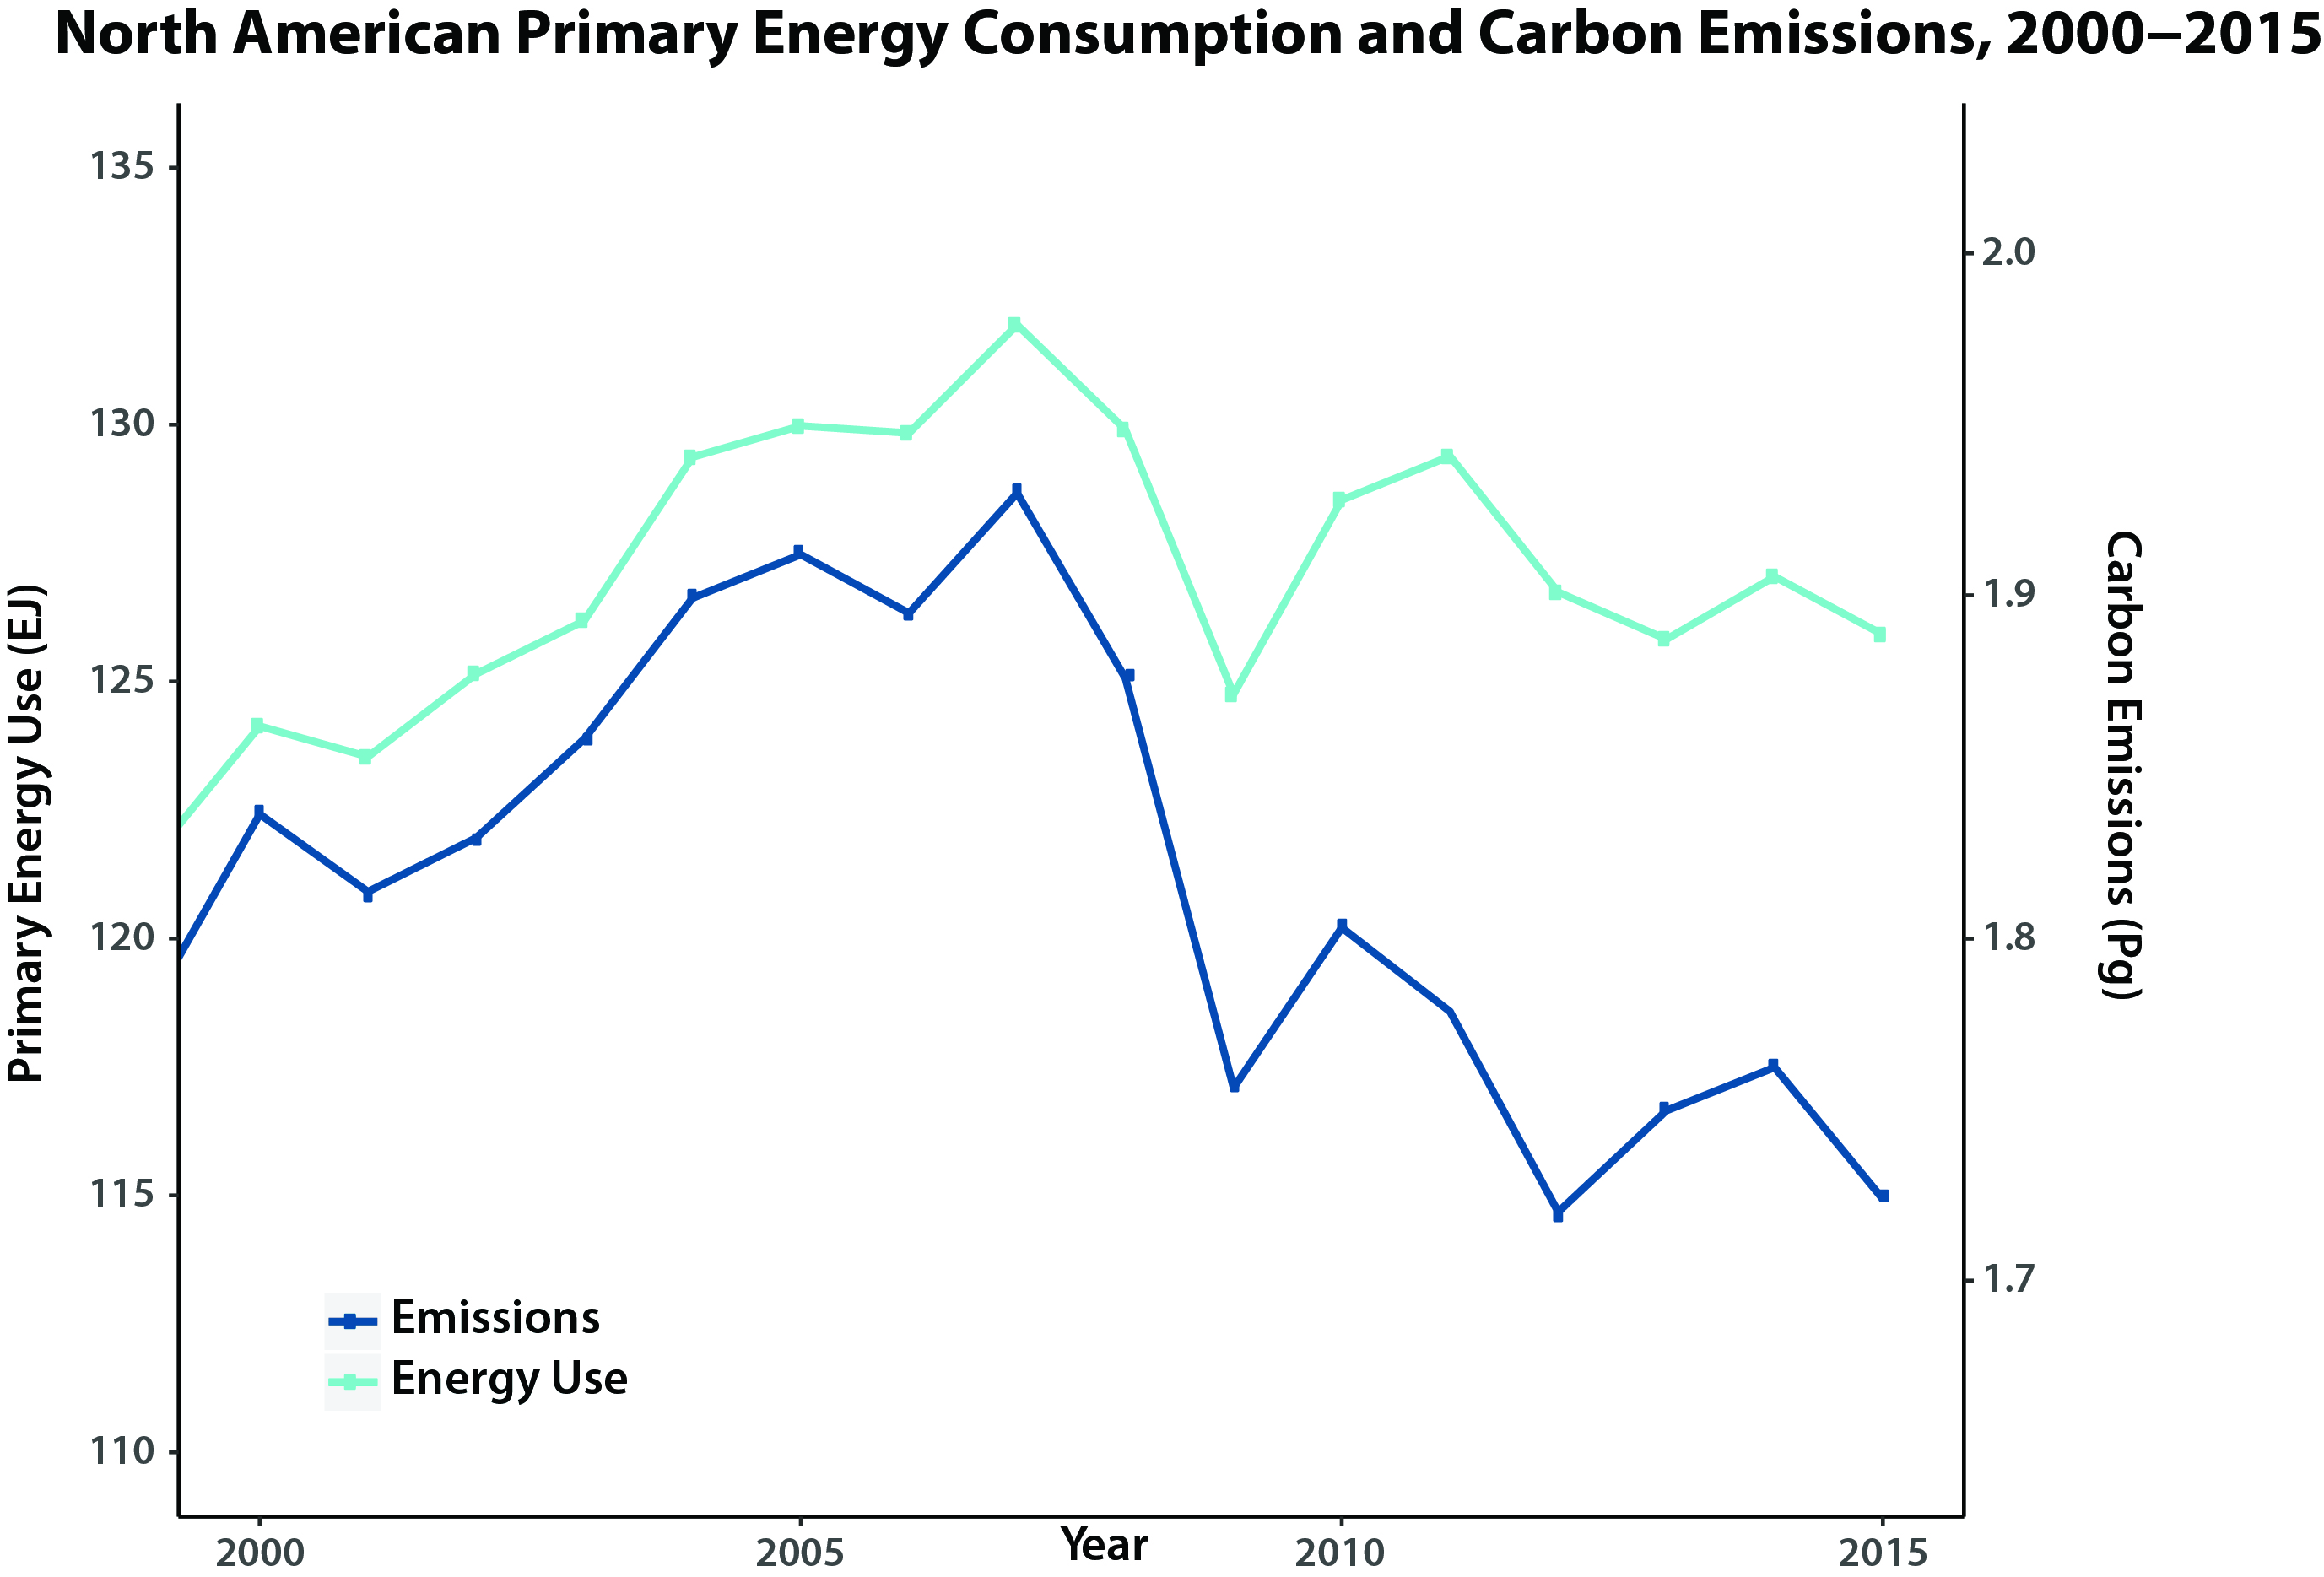
An important indicator of this trend has been reductions in oil consumption, particularly refined products. North American use of petroleum declined from 51.4 EJ in 2004 to 46.2 EJ in 2013. The trend was not monotonic, however. Between 2004 and 2007 consumption was stable before declining thereafter. The year with lowest consumption (45.6 EJ) was 2012. Similar to the trend in overall energy use among North American countries are decreases in oil consumption, which were experienced largely in the United States, while consumption in Canada increased from 4.6 EJ to 5.0 EJ and remained about the same in Mexico at 4.3 EJ to 4.2 EJ from 2004 to 2013 (EIA 2016c).
Total petroleum consumption per capita in the United States recently shifted as well. From 1990 to 2006, consumption was in the range of 142 GJ per capita. Since that time, petroleum consumption has dropped, reaching a low in 2012 of 116 GJ per capita. In 2013, consumption was 117 GJ per capita (EIA 2016b; Hobbs and Stoops 2002; U.S. Census 2016). Motor gasoline consumption per capita in the United States followed a similar trend. In 2006, gasoline consumption per capita was 63.2 GJ, but it fell thereafter, reaching a low of 56.1 GJ in 2012. Consumption levels were 56.5 GJ per capita in 2013 (EIA 2016b).
Another important indicator is the slow growth in U.S. grid–based electricity demand, which is now growing at its lowest level in decades. Since 2006, increases in electricity generation have slowed or stabilized (EIA 2016c, 2016f). Prior to 2007, electricity demand was on an increasing trend. For example, electricity generation was about 8.2 EJ in 1980; by 2007, it had reached 15 EJ. Electricity generation has since remained below 14.9 EJ and was 14.6 EJ in 2013 (including net imports). The trend has been similar in Canada where total electricity demand has hovered just below 1.8 EJ for the past 10 years. There are variations across states and provinces within the United States and Canada, but the overall trend in these large markets has resulted in flat or slightly declining demand for electricity. The U.S. and Canadian slowdown in electricity demand is characteristic of a trend observed in other mature, industrial economies where structural change, energy end-use market saturation, and technological efficiency improvements are offsetting upward pressure from growth in population, economic output, and energy service demand. In Mexico, because the factors pushing electricity demand growth have continued to prevail over efficiency gains and other moderating influences, total electricity generation has continued to grow, from 0.79 EJ in 2004 to more than 1.01 EJ in 2013, a 27% increase.
North American total energy-related carbon emissions from 2007 to 2013 have declined at a rate of just under 2% per year, translating into an annual reduction of about 0.11 Pg CO2e (30.6 Tg C). According to the U.S. Environmental Protection Agency (U.S. EPA; U.S. EPA 2016), U.S. energy-related fossil fuel emissions peaked in 2007 at 5.8 Pg CO2e (1.58 Pg C) and subsequently dropped to 5.16 Pg CO2e (1.47 Pg C) in 2013. Total emissions in Canada declined over the past few years. Between 2005 and 2013, its total GHG emissions decreased by 3.1%, falling from about 0.74 to 0.72 Pg CO2e (201 to 197 Tg C; ECCC 2017b). Mexico, however, experienced an increase in emissions, from 0.4 Pg CO2e (109 Tg C) in 2007 to 0.45 Pg CO2e (122.73 Tg C) in 2013 (IEA 2016d). Given the relatively small increases in Mexico compared with the declines in the United States and Canada, overall emissions in North America declined.
3.4.2 North American Natural Gas Energy Transition
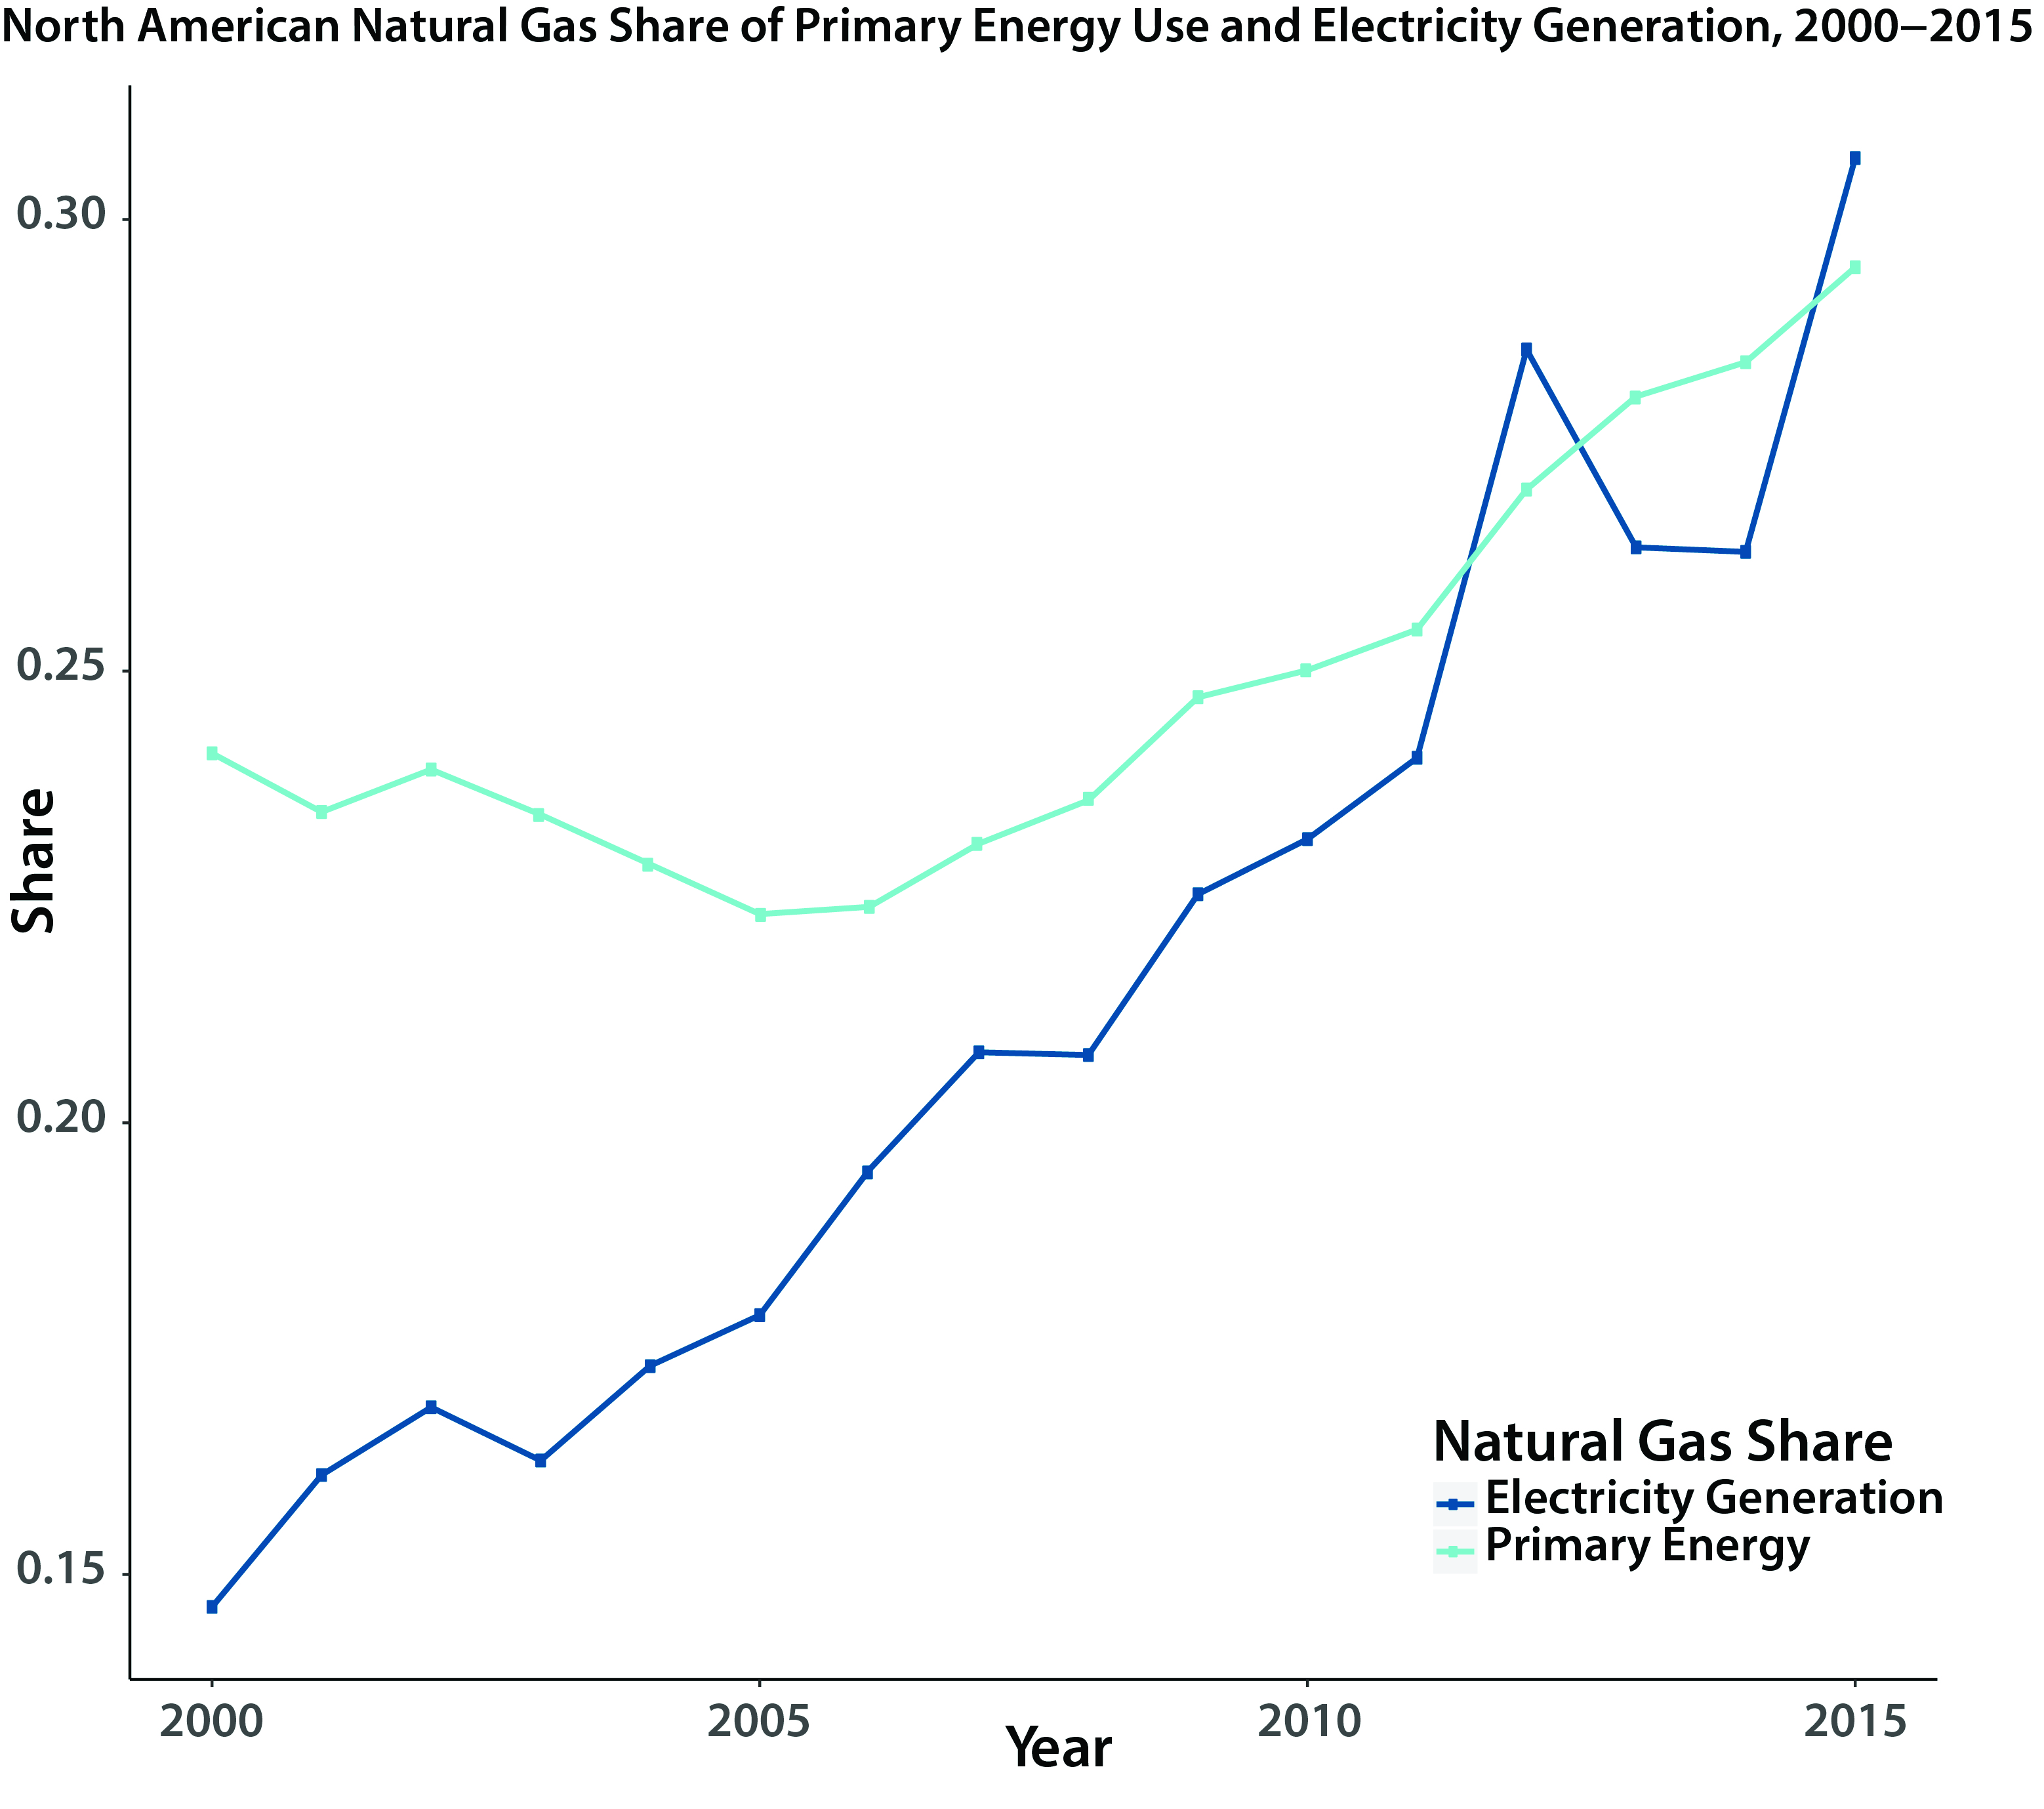
A natural gas boom is driving a transition in the North American energy system (EIA 2016d). This boom increased North American dry gas production from 28.5 EJ in 2004 to approximately 33.9 EJ in 2014, a 2% average annual increase over this period. Natural gas production from shale gas now makes up about half the U.S. total dry natural gas production. Canada’s dry natural gas production decreased by more than 21% during this period. In Mexico, during the same period, dry gas production increased by 24% to 1.8 EJ (EIA 2016b). For North America, the natural gas share of total primary energy and electricity generation has climbed dramatically since 2005 from 24% and 14%, respectively, to about 30% for each in 2015 (see Figure 3.5).
Figure 3.5: North American Natural Gas Share of Primary Energy and Electricity Generation, 2000 to 2015
Resources in low-permeability rock formations have supplemented U.S. natural gas reserves. For natural gas, formations include the Barnett, Fayetteville, Haynesville, Woodford, Bakken, Eagle Ford, and Marcellus shales. Recent access through horizontal drilling and hydraulic fracturing (i.e., “fracking”) has boosted both natural gas and oil production dramatically. In 2016, hydraulic fracturing accounted for about 48% of current U.S. crude oil production (EIA 2017d, 2017l) and 60% of total natural gas production.
Globally, unconventional gas production has the longest history in the United States. Commercial production of coalbed CH4 began in the 1980s, expanded in the 1990s, and leveled off in recent years. Shale gas production has occurred for several decades but started to expand rapidly only in the mid-2000s, growing at more than 45% per year from 2005 to 2010. The United States, Canada, China, and Argentina are the only four countries currently producing commercial shale gas, with U.S. and Canadian production accounting for virtually all of the global supply. North American success in shale gas production holds the prospect of a large-scale unconventional gas industry emerging in other parts of the world where sizeable resources are known to exist. Mexico and Algeria expect to develop operations after 2030.
In the United States, natural gas demand for electric power generation has increased dramatically in recent years. In 2002, the electric power industry used 16.8 petajoules (PJ) of natural gas a day, or 6.07 EJ a year, accounting for approximately 24.6% of all U.S. natural gas usage. Electric power industry demand for natural gas grew to 19.7 PJ a day in 2008 and then rapidly increased thereafter. By 2013, the electric power industry was using more than 24.3 PJ of natural gas a day; by 2015, levels had reached 28.6 PJ a day (EIA 2016e). Prior to 2016, natural gas had long been the second-most-prevalent fuel for electricity generation behind coal. However, in that year, natural gas–fired power plants accounted for about 34% of U.S. electricity generation, followed by coal (30%), nuclear (19%), and renewables (15%) (EIA 2016c). The electric power industry’s use of natural gas now exceeds that of the industrial sector (EIA 2012b).
In 2003, Canadian natural gas production made up only 6% of total net electricity generation, using approximately 1.08 PJ of natural gas per day. By 2014, 8.5% of the country’s electricity supply was generated from natural gas at a rate of about 1.3 PJ per day (Natural Resources Canada 2016c). Mexico increased natural gas production from 2009 to 2013, and the country has doubled imports from the United States through pipelines. According to Mexico’s national energy ministry, SENER, natural gas is Mexico’s largest source of electricity generation, accounting for 54% of the country’s generation in 2015, up from 34% in 2005 (EIA 2017c). SENER projects that natural gas–fired capacity will account for 24.9 GW of total capacity additions from 2016 to 2029 (SENER 2015). The rest of Mexico’s projected capacity additions consist of renewables (20.4 GW) and nuclear (3.9 GW) (EIA 2017c).
3.4.3 Increase in Renewable Energy
Globally, renewable-based power generation capacity increased by an estimated 165 GW in 2016, accounting for more than 66% of the additions to world power generation capacity for the year (IEA 2017d). Of the increased renewable generation capacity, 45% was from PV solar, 32% from wind, and 20% from hydropower. The growth in solar capacity was attributed largely to Chinese increases in solar installations, while the recent fall of wind installation capacity (20% from 2015) was due to cuts in China (IEA 2017d).
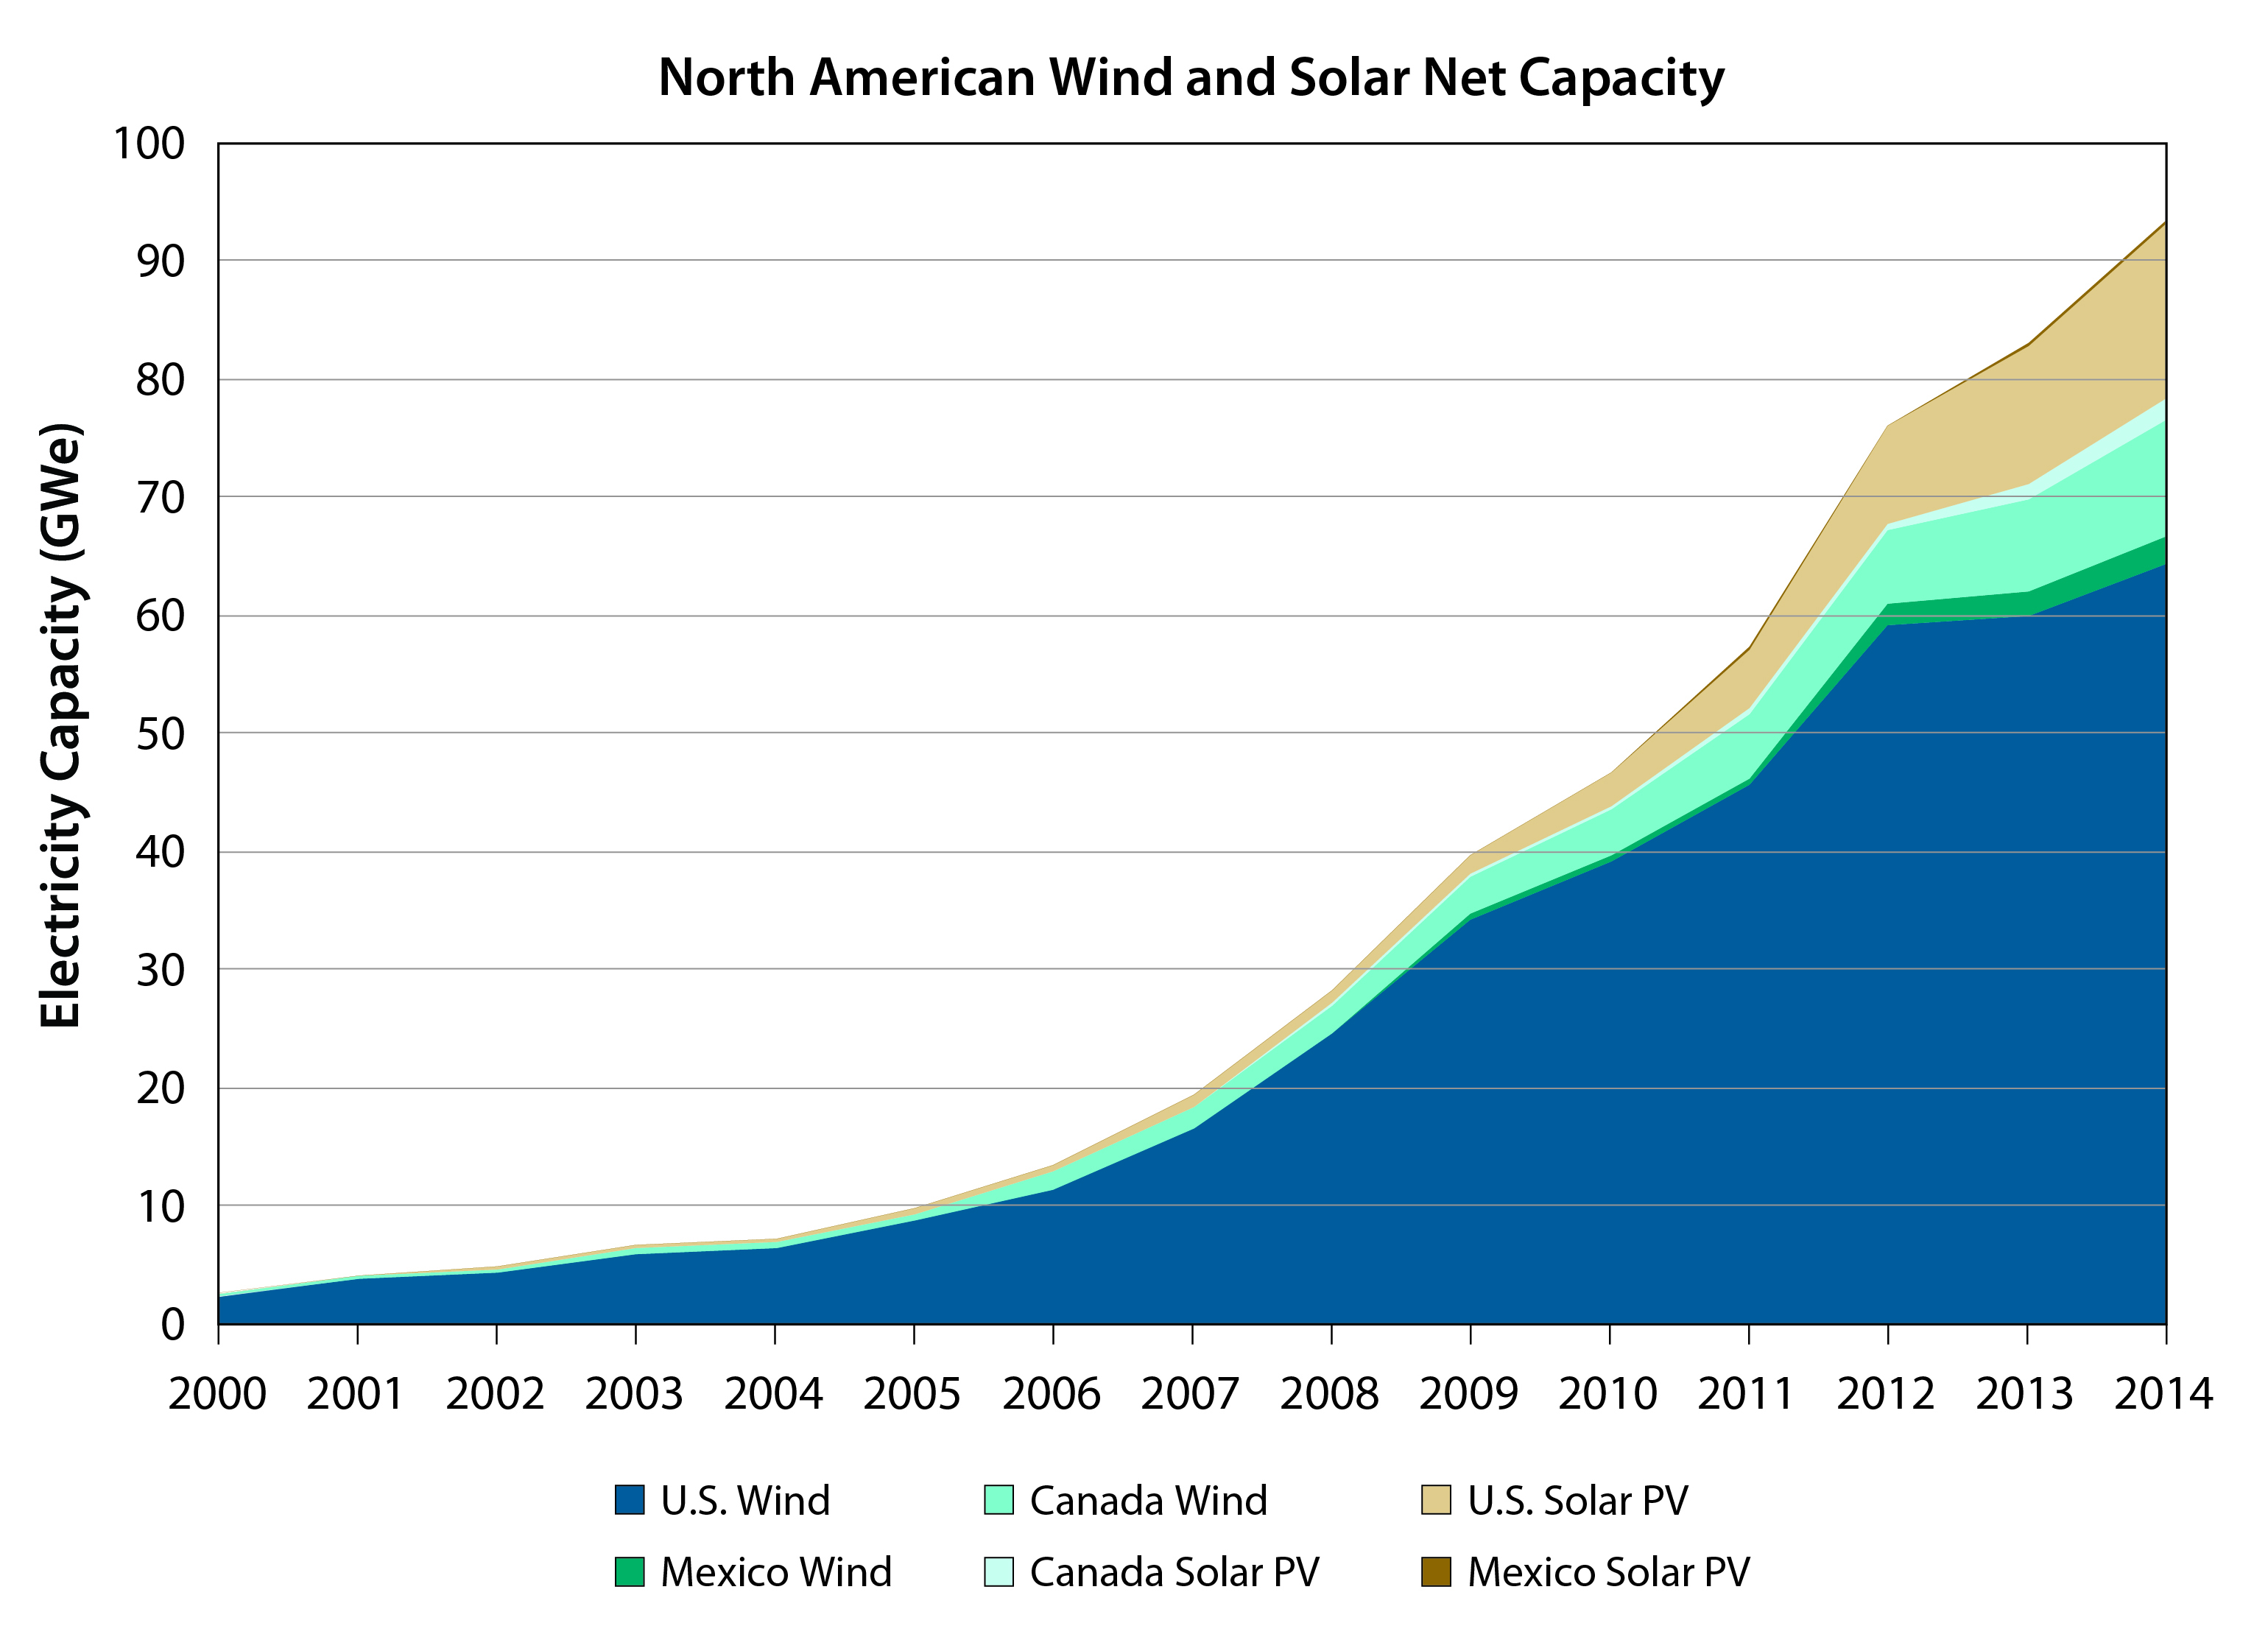
North America is increasing its renewable power capacity (see Figure 3.6). For electricity, the contribution of nonhydropower renewables (e.g., wind, solar, and biomass) to total power generation grew from 2.4% in 2004 to 6.1% in 2013, translating into a 10.6% annual average increase, or an additional 220 PJ of renewable energy into the North American electrical system annually. In 2016, about 10% of total U.S. energy use was from renewable sources (EIA 2018a). According to IEA (2017d), North America is the world’s second largest growth market for new renewable capacity, led by the United States.
Figure 3.6: North American Wind and Solar Net Capacity, 2000 to 2014
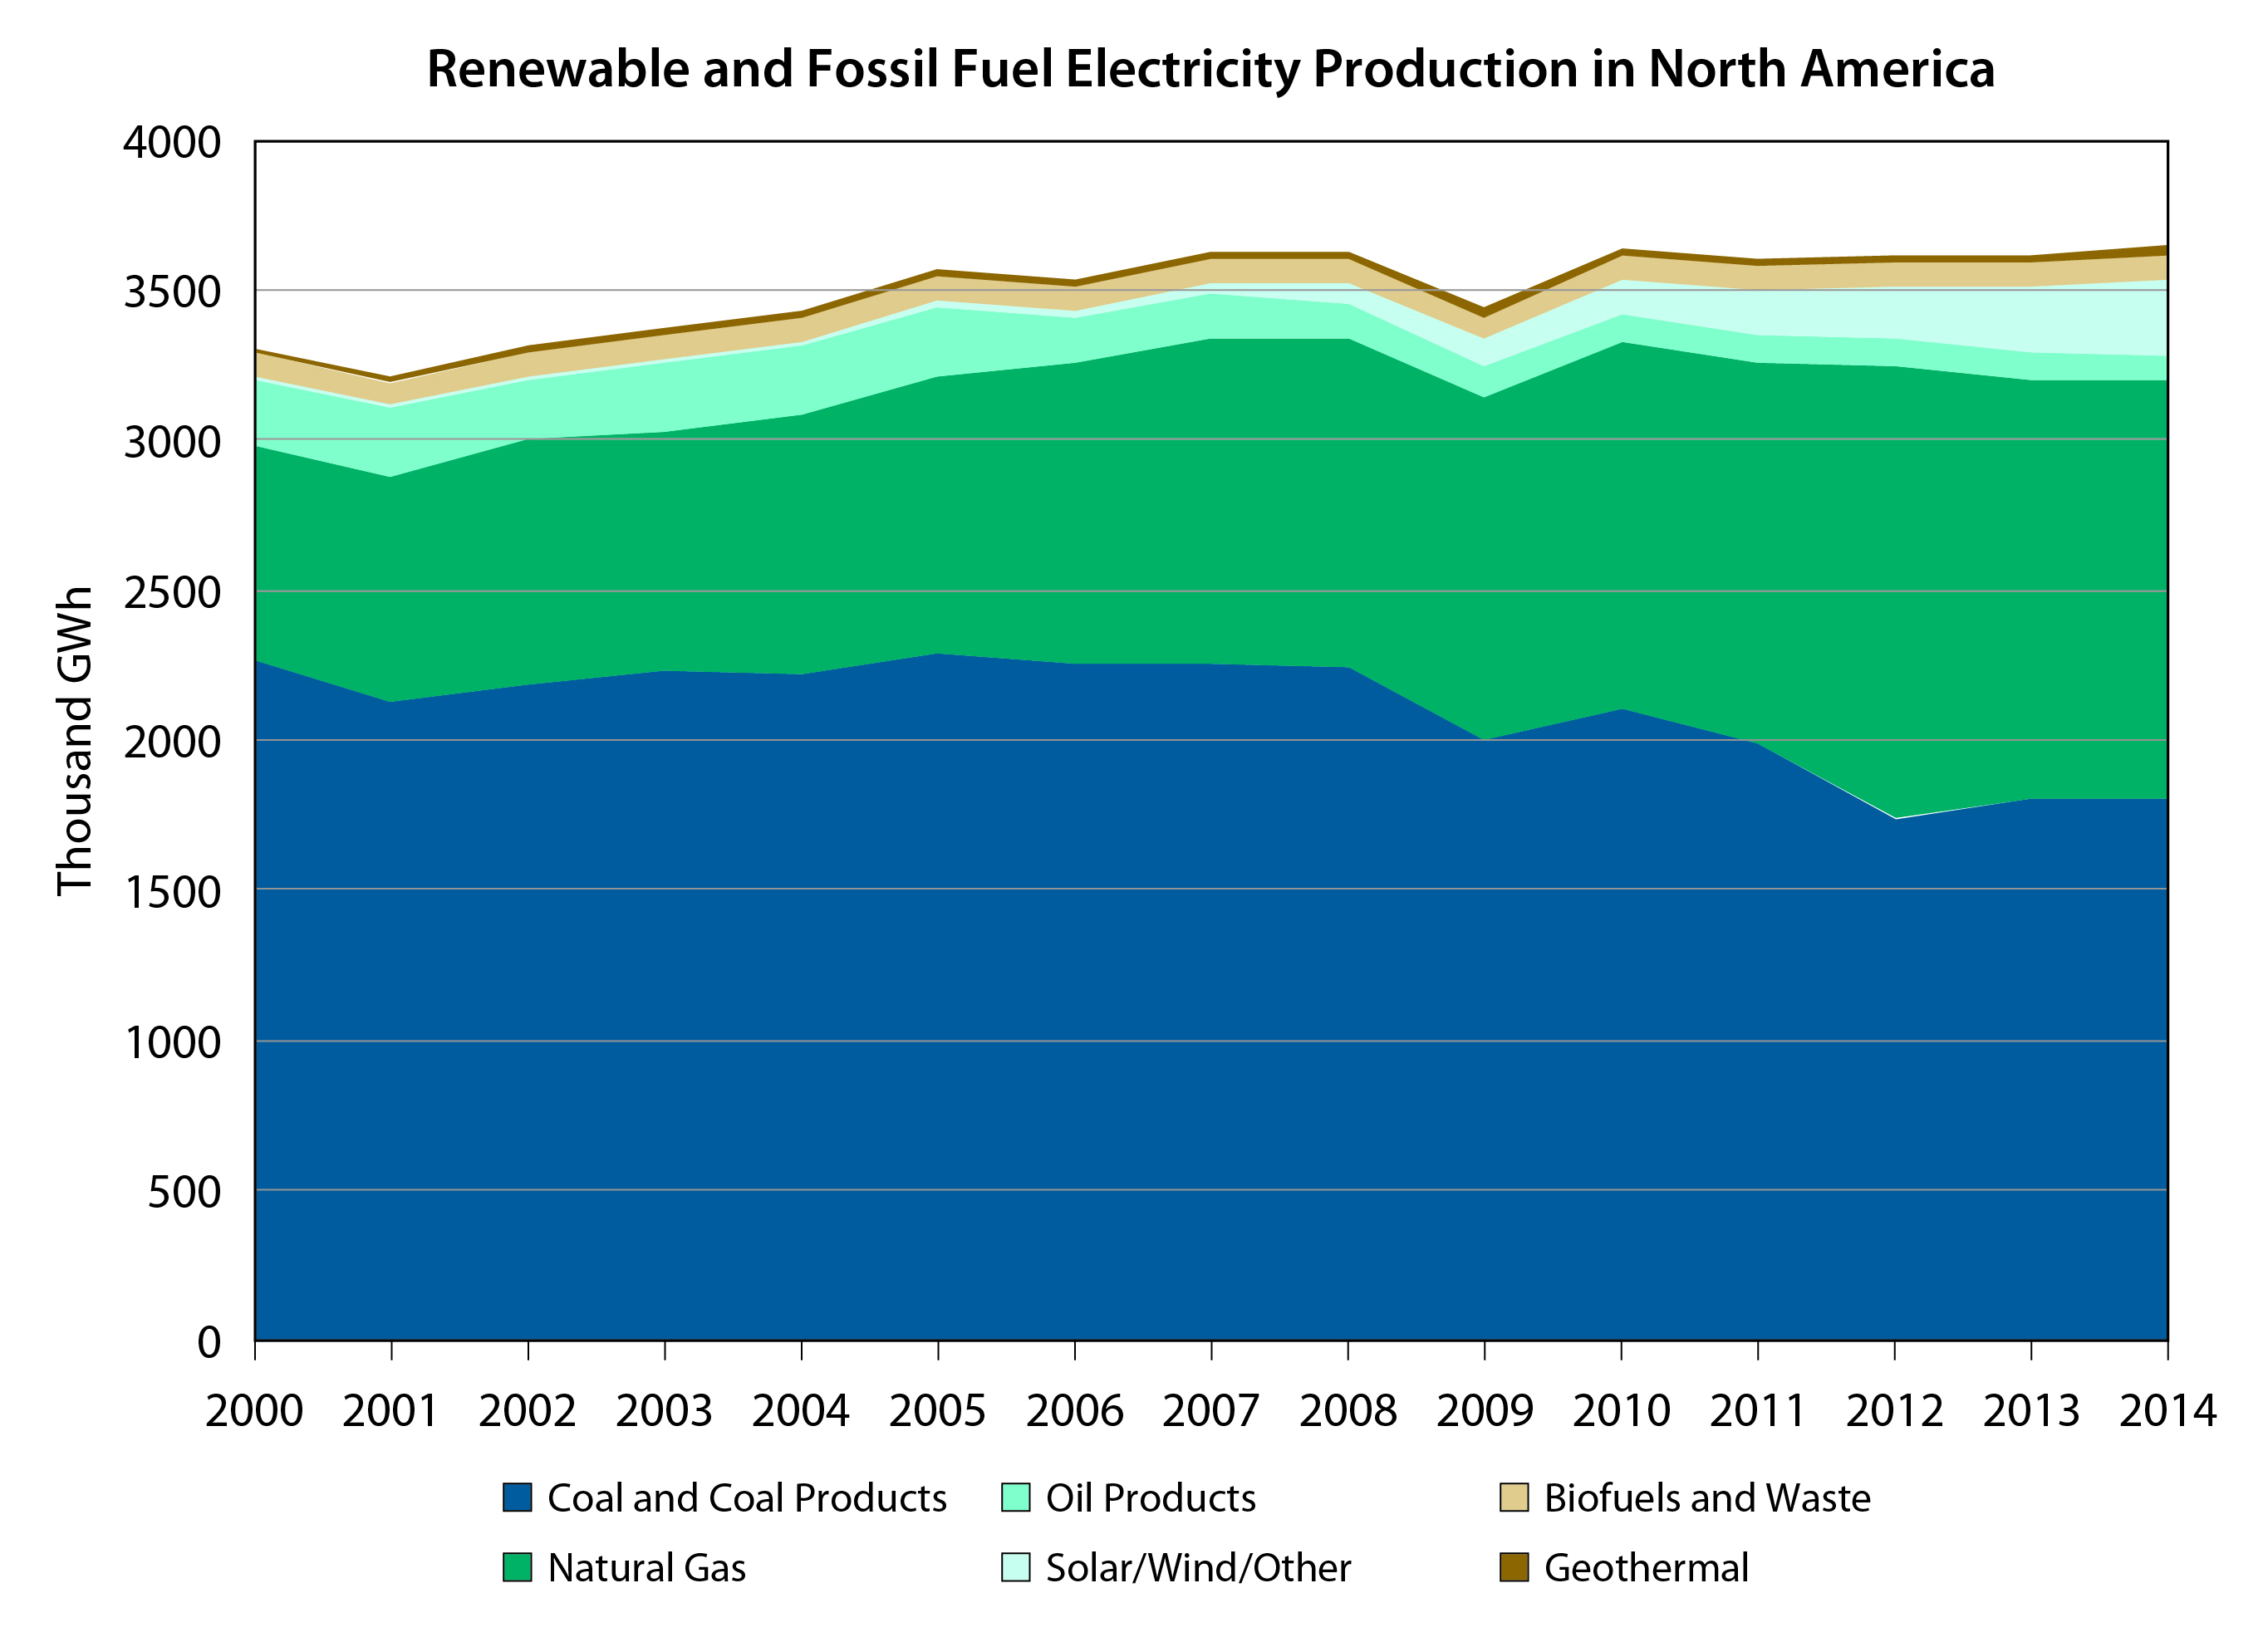
Although renewables are an increasingly important component of total generation capacity, renewable energy’s share of total primary and secondary energy supplies remains low (see Figure 3.7).8 For example, in 2013 the total supply of nonhydropower renewable energy (e.g., geothermal, wind, solar, tidal, wave, fuel cells, and biomass) for electricity generation in North America was 3.25 EJ. Yet, these sources together accounted for approximately 6.1% of total electricity generation, while hydropower accounted for 13.7%, nuclear 18%, and fossil fuels more than 62% (EIA 2016f, 2016g).
Figure 3.7: Renewable and Fossil Fuel Electricity Production in North America, 2000 to 2014
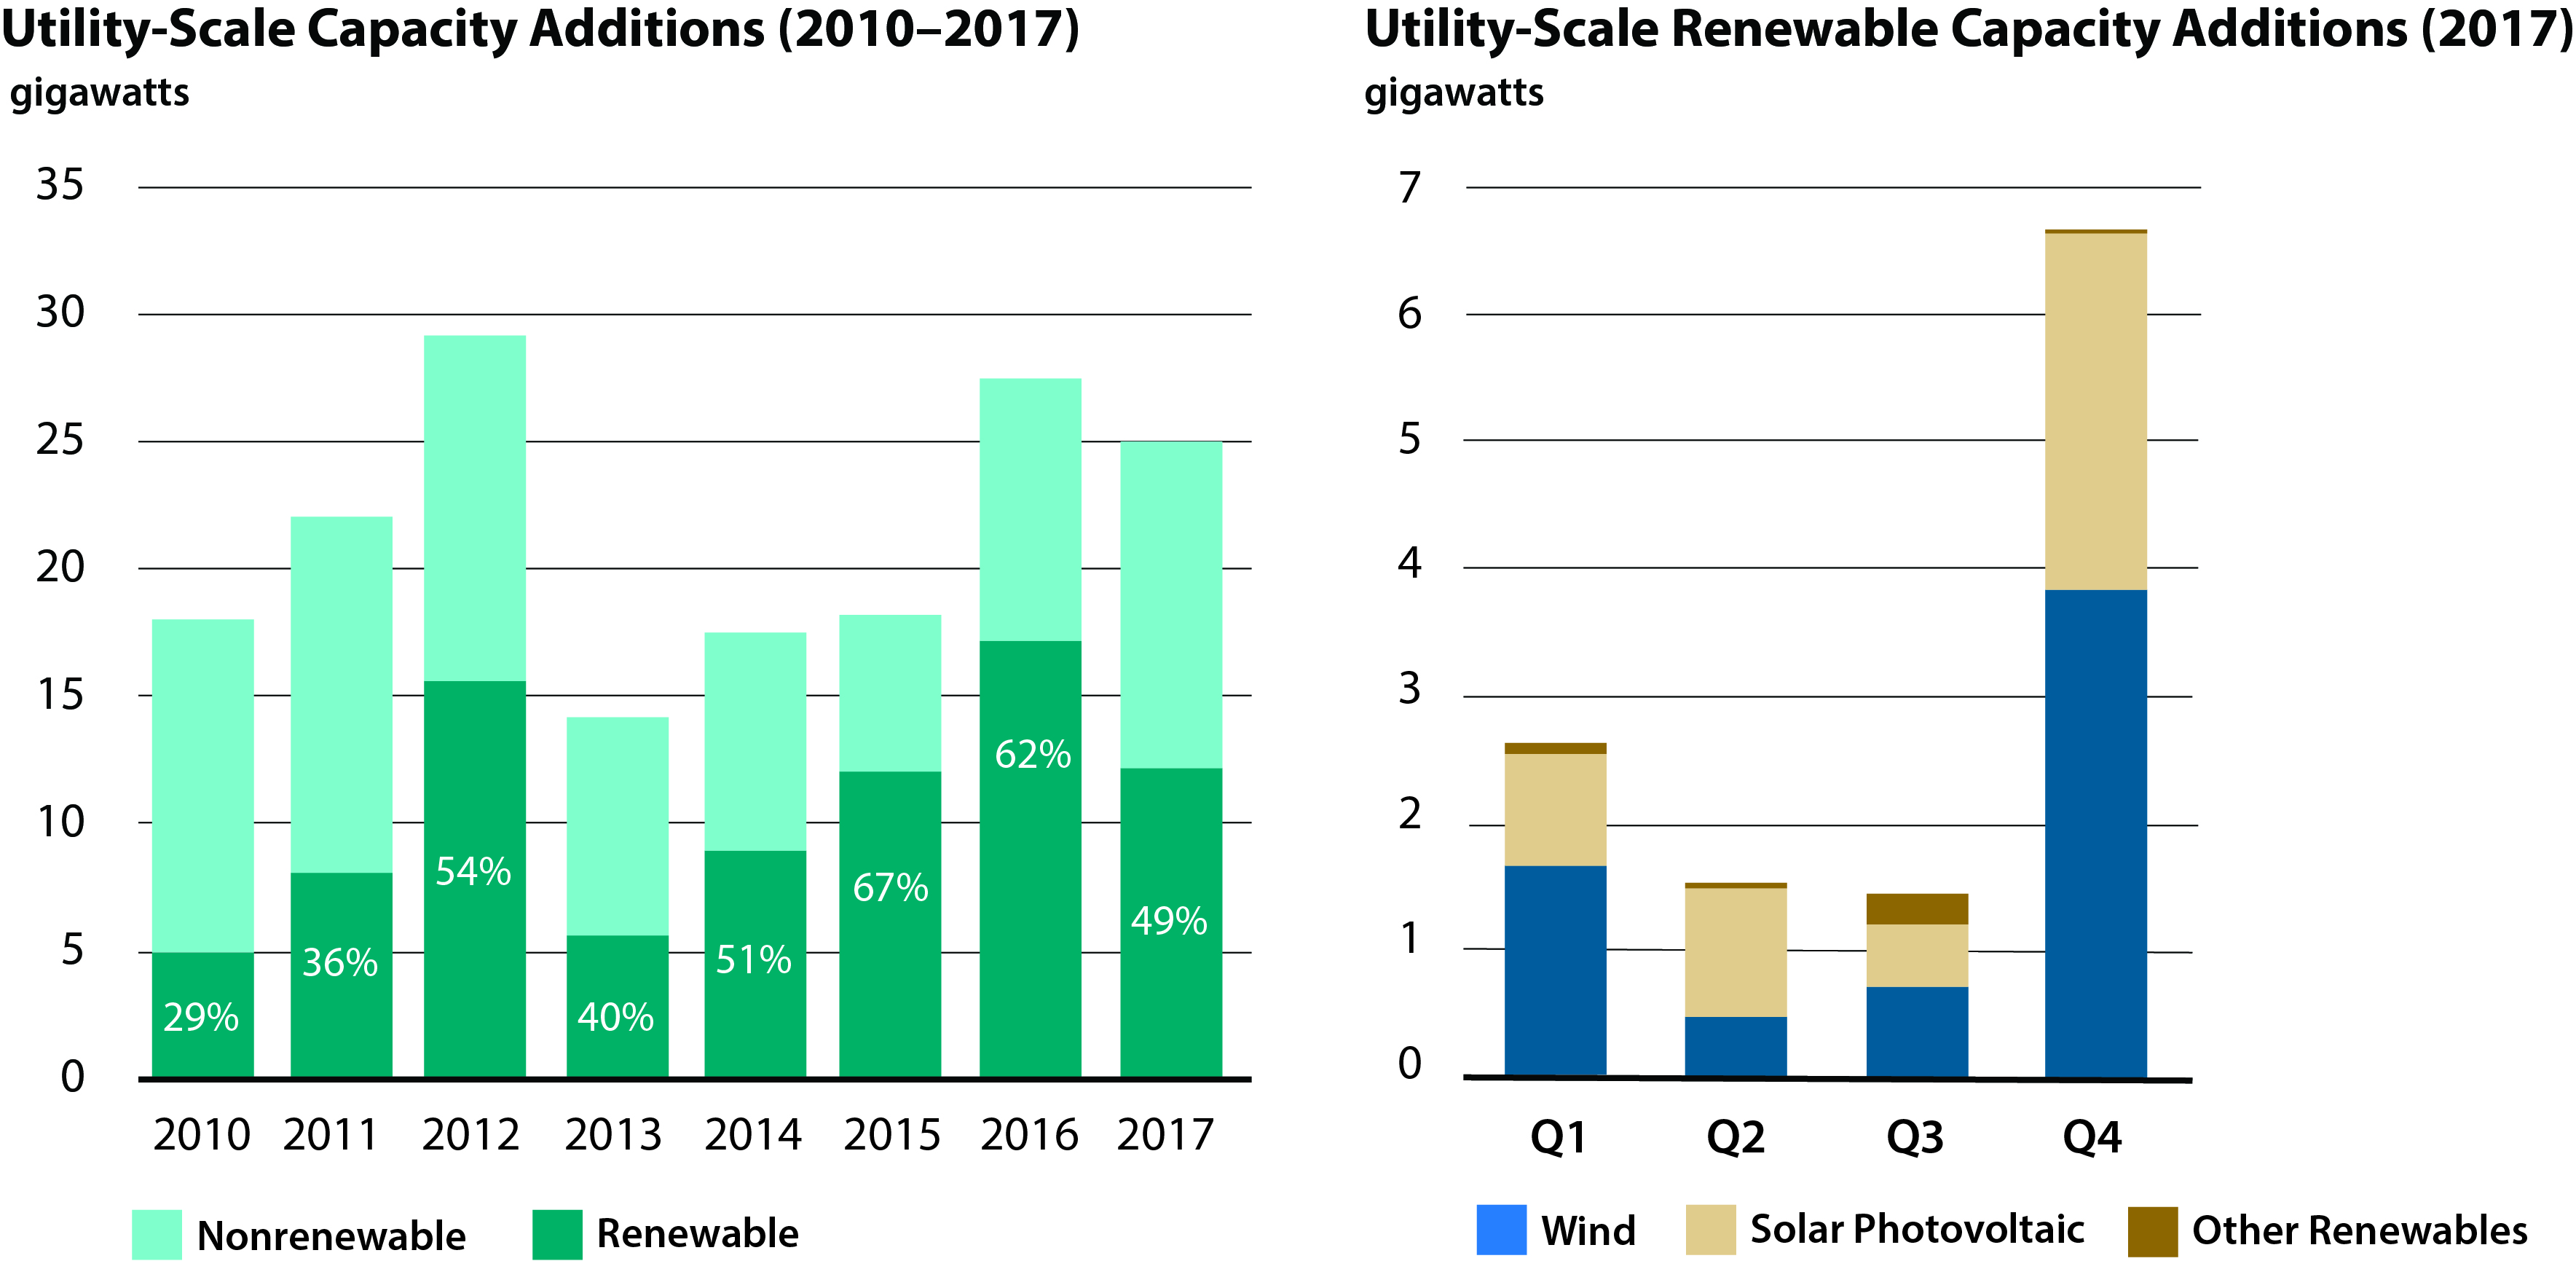
Nevertheless, renewable energy continues to make strides across North America. In the United States, solar electricity generation increased by 31 PJ in 2014—from 32.4 PJ to 63.4 PJ—or a 96% increase from the previous year. U.S. wind generation increased by 8%, from 604.1 PJ to 654.2 PJ (EIA 2016g). In 2015, wind’s share of total U.S. electricity generation reached approximately 655 PJ, accounting for 4.7% of net electric power generation (EIA 2017l). By 2016, about 8.4% of electricity generation was from nonhydropower renewable sources (EIA 2017a). During 2016, renewable generation capacity accounted for most of the electricity capacity additions (EIA 2017a; see Figure 3.8), and nearly half of utility-scale capacity in 2017 (EIA 2018b). By 2017, wind and solar renewable shares reached 10% of electricity generation for the first time (EIA 2017a). From 2008 to 2016, U.S. wind generation increased threefold, and solar generation expanded 40-fold (Houser et al., 2017). California and, most recently, North Carolina have added a significant portion of the increased U.S. solar capacity. Other states using policies to encourage PV installations include Nevada, Texas, Arizona, Georgia, and New Jersey (EIA 2016f, 2016g; World Energy Council 2016a). Wind development has advanced in Iowa, South Dakota, Kansas, Oklahoma, North Dakota, Minnesota, Idaho, Vermont, Colorado, Oregon, and Maine, where it exceeded 10% of total electricity generation in 2015 (EIA 2016h). Other states with significant wind programs include Texas and New Mexico (for a discussion of carbon-related subnational policies, see Section 3.7).
Figure 3.8: Renewable Generation Capacity (2010 to 2017) and Utility-Scale Additions, 2017
Canada also has built new renewable power capacity, most of which comes from hydroelectric sources. In fact, the country is the second largest producer of hydroelectricity in the world, generating more than 1.36 EJ in 2014, or 59% of total national supply. Hydropower remains Canada’s main source of electricity supply, but nonhydropower renewable electricity generation grew from 34.2 PJ in 2002 to 90 PJ in 2013, a more than 1.5-fold increase. By 2014, Canada had 9.6 GW of installed wind power capacity (Natural Resources Canada 2016c) and added another 1.55 GW of wind-generating capacity in 2015 alone, which now supplies about 5% of the country’s electricity demand (World Energy Council 2016a). Canada also has significant bioenergy electrical capacity, exceeding 2 GW in 2014 (Natural Resources Canada 2016a).
In Mexico, the largest source of renewable power generation is hydropower. Hydroelectricity supplied about 10% of the nation’s electricity in 2015 (EIA 2015a). Mexico has also increased its nonhydropower renewable energy but at a slower rate than that of the United States or Canada. In 2002, the country’s nonhydropower renewable energy generation was approximately 28.4 PJ and increased to 39.6 PJ in 2013 (EIA 2016d). Nonhydropower renewables represented 3% of Mexico’s electricity generation in 2013. Mexico also has 980 MW of geothermal capacity, making the country fifth in terms of global geothermal capacity. In 2015, 100 MW of geothermal projects are expected to supplement the decreased power generation at the 645-MW Cerro Pietro Geothermal field in Baja California, the key component of Mexican geothermal generation. Solar power has received significant attention in northern Mexico, where the first large-scale solar power project, Aura Solar I, began operations in 2013. This project increases Mexican solar capacity by 30 MW. Several wind projects under development in Baja California and in southern Mexico aim to boost Mexico’s wind-generation capacity from 2 to 12 GW by 2020. Mexico is hoping to achieve this goal by encouraging US$14 billion in investment between 2015 and 2018. In 2016, renewable capacity additions reached 0.7 GW, led by onshore wind (0.45 GW) and solar PV (0.2 GW). These additions were mostly from power purchase contracts with the Federal Electricity Commission before implementation of energy reform (IEA 2017d). Much of the current wind-generation capacity is in Oaxaca, where the Isthmus of Tehuantepec has especially favorable wind resources and has been a focus of governmental efforts to increase wind capacity. From 2010 to 2013, the Oaxaca region experienced an increase of nearly 667% in wind-generation capacity with the addition of five major projects (Oaxaca I, II, III, and IV and La Venta III), bringing the region’s total wind-generation capacity to 1.75 GW (EIA 2015a). Mexico’s first power auction (see Section 3.3.2) generated a further 1.7-GW commitment to solar and wind generation, which also may affect the country’s future fuel mix.
From 2003 to 2012, North American consumption of biofuels (i.e., liquid fuels such as ethanol and biodiesel derived from renewable plant sources) increased by almost 20% annually, and biofuels now constitute an important component of the continent’s fuel mix. In the United States, almost all gasoline contains 10% blended ethanol (E10), the maximum level approved for use in all cars and light trucks, although higher levels could be used with appropriate adjustments. The amount of fuel ethanol added to motor gasoline consumed for transportation in the United States increased from about 1.4 billion gallons in 1995 to about 14.4 billion gallons in 2016. Biodiesel consumption increased from 10 million gallons in 2001 to about 2.1 billion gallons in 2016 (EIA 2017b). Canada’s biofuel blend mandate is 5% renewable content (ethanol) in gasoline and 2% in distillate (diesel). Provincial blend mandates, however, reach as high as 8.5% for ethanol in Manitoba. Canada imports close to 20% of its domestic fuel ethanol consumption and nearly all of that from the United States (USDA Foreign Agricultural Service GAIN 2015). In 2016, Mexico released draft standard specifications for biofuels, including a proposed 5.8% ethanol blend nationwide. However, the final regulation was limited to the three largest major metropolitan areas (Mexico City, Guadalajara, and Monterrey), which represent one-third of Mexico’s population (U.S. DOC 2016).
3.4.4 Growing Concern over Aging Energy Infrastructure
North America is poised for significant investment to meet the challenges of its aging transportation and energy infrastructures, including energy generation, transmission, distribution, and storage systems. A number of studies have found that energy systems in the United States urgently need upgrading (ASCE 2013; U.S. DOE 2015a). In 2008, the Edison Electric Institute estimated that by 2030 the U.S. electric utility industry would need to invest $1.5 trillion to $2.0 trillion in infrastructure (Edison Electric Institute 2008). Harris Williams & Co. (2014) suggest that an estimated 70% of U.S. transformers are more than 25 years old, 60% of distribution poles are 30 to 50 years old (relative to useful lives of 20 and 50 years, respectively), and 70% of transmission lines are also approaching the end of their useful lives of 25 years or older. In Canada, infrastructure underinvestment since the 1980s has put a strain on existing facilities (Gaudreault and Lemire 2009). The World Economic Forum’s Global Competitiveness Report for 2012 to 2013 noted that energy infrastructure is a main area of needed improvement in Mexico (Goebel and Schwandt 2013; Schwab and Sala-i-Martín 2012).
Infrastructure needs extend to electricity-generation plants. In the United States, nearly 18 GW of generating capacity retired in 2015, 80% of which is coal-fired generation (EIA 2016l, 2018c). Although current nuclear-powered electricity generation in North America is stable, there are significant retirements slated in the midterm future. The United States currently has around 99 nuclear reactors in full operation, five under construction, 25 in the planning and permitting stage, and 32 in permanent shutdown or retirement. However, there are five fewer generators operating now than at the end of 2012, corresponding to a decrease in about 3 GW of nuclear capacity. Generation has remained relatively stable because output of the operating plants has been increasing. In 2014, U.S. nuclear power accounted for 8.76 EJ, approximately 8.5% of national total primary energy. Currently, the United States accounts for more than 30% of the worldwide nuclear generation of electricity (World Energy Council 2016a). For the entire continent, nuclear power generation since 2002 has been largely flat, accounting for about 850 to 900 billion kilowatt hours (kWh; 3.04 to 3.24 EJ; EIA 2016c). Nuclear plants continue to be decommissioned, but their potential replacement by new nuclear technologies, coal- or gas-fired thermoelectric plants, or renewable resources is unclear (see Box 3.2, Potential for Nuclear Power in North America).
ICF, on behalf of the Interstate Natural Gas Association of America (INGAA) Foundation, recently published a report estimating that necessary midstream energy infrastructure investments for the United States and Canada would be between $22.5 billion and $30 billion per year, or approximately $546 billion (US$ 2015) over the 20-year period from 2015 to 2035 (INGAA 2016). These investments include mainline pipelines; laterals; processing plants; gathering lines; compression equipment for gas transmission and gathering lines; and storage for natural gas, natural gas liquids, and oil. Nearly 50% of U.S. gas transmission and gathering pipelines were constructed in the 1950s and 1960s when the interstate pipeline network expanded in response to the thriving post–World War II economy. According to U.S. DOE (2015a), upgrading U.S. natural gas pipelines would cost an estimated US$2.6 billion to US$3.5 billion per year from 2015 to 2035, depending on the overall level of natural gas demand. Replacing cast iron and bare steel pipes in gas distribution systems would cost an estimated US$270 billion (U.S. DOE 2015a).
Studies suggest that infrastructure improvements could lower carbon emissions through reducing leaks from water supplies and natural gas transmissions, improved power plant efficiencies, increased connectivity throughout cities, improved transit, and upgraded transmission and distribution infrastructure, including biofuel refineries, liquid fuel pipelines, and vehicles that transport energy directly or indirectly (Barrett et al., 2014; U.S. DOE 2015a; World Resources Institute 2016).
3.4.5 New Understanding of Biofuel and Natural Gas Contributions to Carbon Cycle Dynamics
Biofuel mandates at both the U.S. federal and state levels target transportation fuels (Adler et al., 2012). Quantifying the degree to which the use of this energy source contributes to the global carbon cycle, however, requires a thorough accounting of both the upstream impacts of the various materials and activities required to produce the finished fuel and the emissions at the point of fuel use.
Accounting for the full life cycle of carbon emissions related to energy production and use is particularly challenging. An example is the case of biofuels, where impacts spill over into the agricultural sector via nonpoint source trace gas emissions from—and changes in carbon storage within—the agroecosystems from which feedstock biomass is sourced. Thus, those climate cycle impacts can be examined by supplementing traditional GHG inventories with consequential life cycle assessment studies that attempt to quantify direct impacts all along the supply chain, as well as indirect effects that could erode the direct GHG mitigation benefits of an agricultural system (Brander et al., 2009; Plevin et al., 2014). Nearly four decades have elapsed since scientists first analyzed fossil energy expenditures associated with corn ethanol production to determine whether it represents a viable strategy to improve domestic energy security (Silva et al., 1978), and such energy use and associated GHG emissions are increasingly quantified with greater certainty (Farrell et al., 2006).
Understanding of other biofuel life cycle GHG emissions impacts has expanded greatly over the last decade. The research community now widely recognizes that feedstock production often results in changes in above- and belowground carbon storage and emissions of nitrous oxide (N2O) and CH4 relative to current or alternate land management (Robertson et al., 2011). Such biogenic impacts vary widely depending on the crop cultivated, regional climate, and site-level factors including soil properties and land-use history, and they require spatially explicit models for accurate assessment (Field et al., 2016; Sheehan et al., 2003; Thomas et al., 2013). Researchers also have explored whether conversion of limited arable land to bioenergy crops might increase agricultural commodity prices and elicit land-use changes in other regions, resulting in a leakage effect (Searchinger et al., 2008), though estimates of the magnitude of leakage have been lowered sharply over time (Wang et al., 2011; Zilberman 2017). The leakage effect occurs when GHG emissions increase in one location as a result of decreases in another.9 Such effects might even run in the opposite direction in some scenarios; studies indicate that increased forest harvesting in response to higher demands for forest biomass is followed by expanding forest area (Galik and Abt 2016; Lubowski et al., 2008). According to U.S. EPA’s Science Advisory Board, “Carbon neutrality cannot be assumed for all biomass energy a priori. There are circumstances in which biomass is grown, harvested, and combusted in a carbon-neutral fashion, but carbon neutrality is not an appropriate a priori assumption; it is a conclusion that should be reached only after considering a particular feedstock’s production and consumption cycle. There is considerable heterogeneity in feedstock types, sources, and production methods, and thus net biogenic carbon emissions will vary considerably” (Khanna et al., 2012).
Taken together, these new insights reinforce the importance of accounting for land-use changes in assessing GHG profiles of biomass fuels. Studies have identified a range of sustainable cellulosic feedstock sources that likely could achieve robust GHG benefits via second-generation biofuel production (Tilman et al., 2009) and future “carbon-negative” bioenergy systems, which are predicted to play a significant role in climate stabilization scenarios (Fuss et al., 2014). U.S. EPA’s Science Advisory Board emphasizes that significant methodological challenges remain in bioenergy life cycle assessments, particularly with regard to the timing of ecosystem carbon storage changes relative to other life cycle emissions (Khanna et al., 2012).
Life cycle perspectives also have highlighted how “fugitive” CH4 emissions from natural gas production, transmission, and distribution can erode the GHG savings anticipated from the “natural gas transition” (for a detailed discussion, see Box 3.3, Methane Emissions from Oil and Gas Production). A growing body of literature indicates that official CH4 emissions underestimate true rates in the natural gas supply chain due to leakage (e.g., Brandt et al, 2014; Marchese et al., 2015). Leakage, in this sense, refers to direct emissions loss during production, delivery, and use of natural gas. Leakage is extremely diverse in its sources and magnitudes; less than 1% of equipment can be responsible for most facility and pipeline leaks (Frankenberg et al., 2016; U.S. EPA 2006b; Zavala-Araiza et al., 2015). The overall GHG intensity of natural gas electricity is highly dependent on fugitive CH4 emissions from leakage in the fuel supply chain. Methane, the principal component of natural gas, is a GHG that is between 28 and 86 times10 more potent than CO2 in 20- and 100-year time frames, respectively (Myhre et al., 2013; Stocker et al., 2013), leading to temporal accounting issues similar to those for bioenergy systems (Ocko et al., 2017).
3.4.6 Feedbacks
There are many different plausible feedback mechanisms (both positive and negative) that could affect the North American energy system’s ability to continually provide sufficient, reliable, and affordable energy. Three types of energy system–related feedbacks include those associated with changes in climate, other exogenous forces, and internal dynamics. This section provides illustrative examples of each.
A changing climate is likely to affect energy demand and production, although the scale and direction of this effect are debated (Wilbanks et al., 2007). For example, increasing temperatures may reduce heating demand in high latitudes while increasing cooling demands in areas with warmer climates (Hadley et al., 2006; Zhou et al., 2013, 2014). Research in the last decade has analyzed this relationship at fine spatial and temporal scales, highlighting differences with larger-scale assessments. For example, the difference between today’s annual total U.S. energy consumption and projected consumption from 2080 to 2099 is less than 2% under a changing climate, but changes per month at the scale of individual states are larger, with summer electricity demand increasing by more than 50% and nonelectric energy needs in springtime declining by 48% (Huang and Gurney 2016).
There also may be linkages between increased temperatures and thermoelectric capacity, as anticipated changes in the hydrological cycle likely will exert constraints on electricity generation. Warming is expected to lead to decreasing river discharge in some areas and increasing river temperatures (Huntington 2006; van Vliet et al., 2016). Elevated water temperatures, along with changes in urban water availability due to climate change and competing pressures on upstream water sources, are likely to make water cooling of thermoelectric power plants (both fossil and nuclear) less efficient. Furthermore, water shortages for urban residents (McDonald et al., 2011) may limit their ability to allocate water resources for other uses, including electricity generation.
An example of another potential exogenous feedback mechanism in the energy system is increased disease pressure on forests and increased forest vulnerability to fire, which could reduce wood availability for those depending on bioenergy (see Ch. 9: Forests). While these pressures may contribute to long-term bioenergy loss, they could contribute to increases in bioenergy feedstocks in the short term. However, relatively little is known, for example, about how mortality due to pine bark beetles affect important aspects of forest regeneration and hence future bioenergy resources (BANR 2017).
Finally, feedbacks created by changes in the energy system itself may become important. For example, growing fleets of plug-in electric vehicles could increase electricity demand in the transportation sector, which today is fueled mostly with petroleum. U.S. DOE (EIA 2018f) projects that combined sales of new electric, plug-in hybrid electric, and hybrid vehicles will grow in market share from 4% in 2017 to 19% in 2050, translating into a vehicle fleet of over 2 million. This increase in electric vehicle charging will be a significant new source of electricity demand and will change the dynamics and extent of peak demand. These shifts can be met with smart meters, time-based rates, and electric grid management techniques, or through costly additions to power capacity (U.S. DOE 2015b). Alternatively, if the trend toward microgrids and distributed energy increases, there could be lower levels of electricity carried throughout the national grid, leaving room for other uses. Both the forward trends and the implications of these feedback mechanisms are uncertain, and the subsequent impacts on the carbon cycle contributions from the North American energy system remain unknown. An incomplete understanding of the feedback mechanisms, therefore, poses concern for future energy planning. Follow-up studies (sensu Wilbanks et al., 2007), which report on the effects of climate change on energy production and use, could focus on the variety of potential feedbacks, the costs of their impact on energy systems, and subsequent potential trends in carbon contributions to the atmosphere. Furthermore, studies could explore how the outcomes of these feedbacks might affect the vulnerability of the energy system.
See Full Chapter & References