<b>Marcotullio<b>, P. J., L. Bruhwiler, S. Davis, J. Engel-Cox, J. Field, C. Gately, K. R. Gurney, D. M. Kammen, E. McGlynn, J. McMahon, W. R. Morrow, III, I. B. Ocko, and R. Torrie, 2018: Chapter 3: Energy systems. In Second State of the Carbon Cycle Report (SOCCR2): A Sustained Assessment Report [Cavallaro, N., G. Shrestha, R. Birdsey, M. A. Mayes, R. G. Najjar, S. C. Reed, P. Romero-Lankao, and Z. Zhu (eds.)]. U.S. Global Change Research Program, Washington, DC, USA, pp. 110-188, https://doi.org/10.7930/SOCCR2.2018.Ch3.
Energy Systems
Given the recent trends in the region’s energy use and CO2e emissions, examining past emissions fluctuations and their relationship to social and economic trajectories is useful for understanding the current situation as well as the range of plausible energy and CO2e emissions futures.4 Historically, North American energy use and carbon emissions fall for short periods of time after major societal shocks. For example, energy use and emissions levels peaked in North America around 1929, subsequently fell during the Great Depression, and did not exceed the 1929 peak until around 1941. From the late 1950s to the early 1970s, emissions from fossil fuel burning grew as energy demand rapidly increased. From 1960 to 1973, total final energy use5 for North America increased from 36 exajoules (EJ) to more than 62 EJ, or by 70% (IEA 2016d).6 During this period, CO2e emissions from energy increased from 859 teragrams of carbon (Tg C) to 1.45 Pg C, or by more than 68%. This was an exceptional period, in terms of both absolute increases and the energy–economic output relationship. Then, because of “oil shocks,” restructuring of the global economy, and other factors including an economic recession, total North American final energy use fluctuated, slowly increasing to reach a new high of about 66.3 EJ in 1979 before falling again in 1980. Thereafter, total final energy use remained below the 1979 record-high, increasing throughout the 1980s. Energy use and emissions increased over this period, falling again in the early 1990s during a short economic recession. Rebounding almost 14 years after the large fall in 1980, North American final energy use reached a new record-high in 1993. After that time, North American energy use started to increase monotonically again. From 1994 to 2007, both total final energy use and CO2e emissions followed an increasing trend. By 2007, total North American energy use had reached 128 EJ, and CO2e emissions approached 1.86 Pg C. The 2007 to 2008 GFC marked the beginning of another decreasing trend, as North American CO2e emissions, primary energy use, and total final energy use dropped below the 2007 peak and remained below it through 2015 (Boden et al., 2016; EIA 2016c; IEA 2016d).
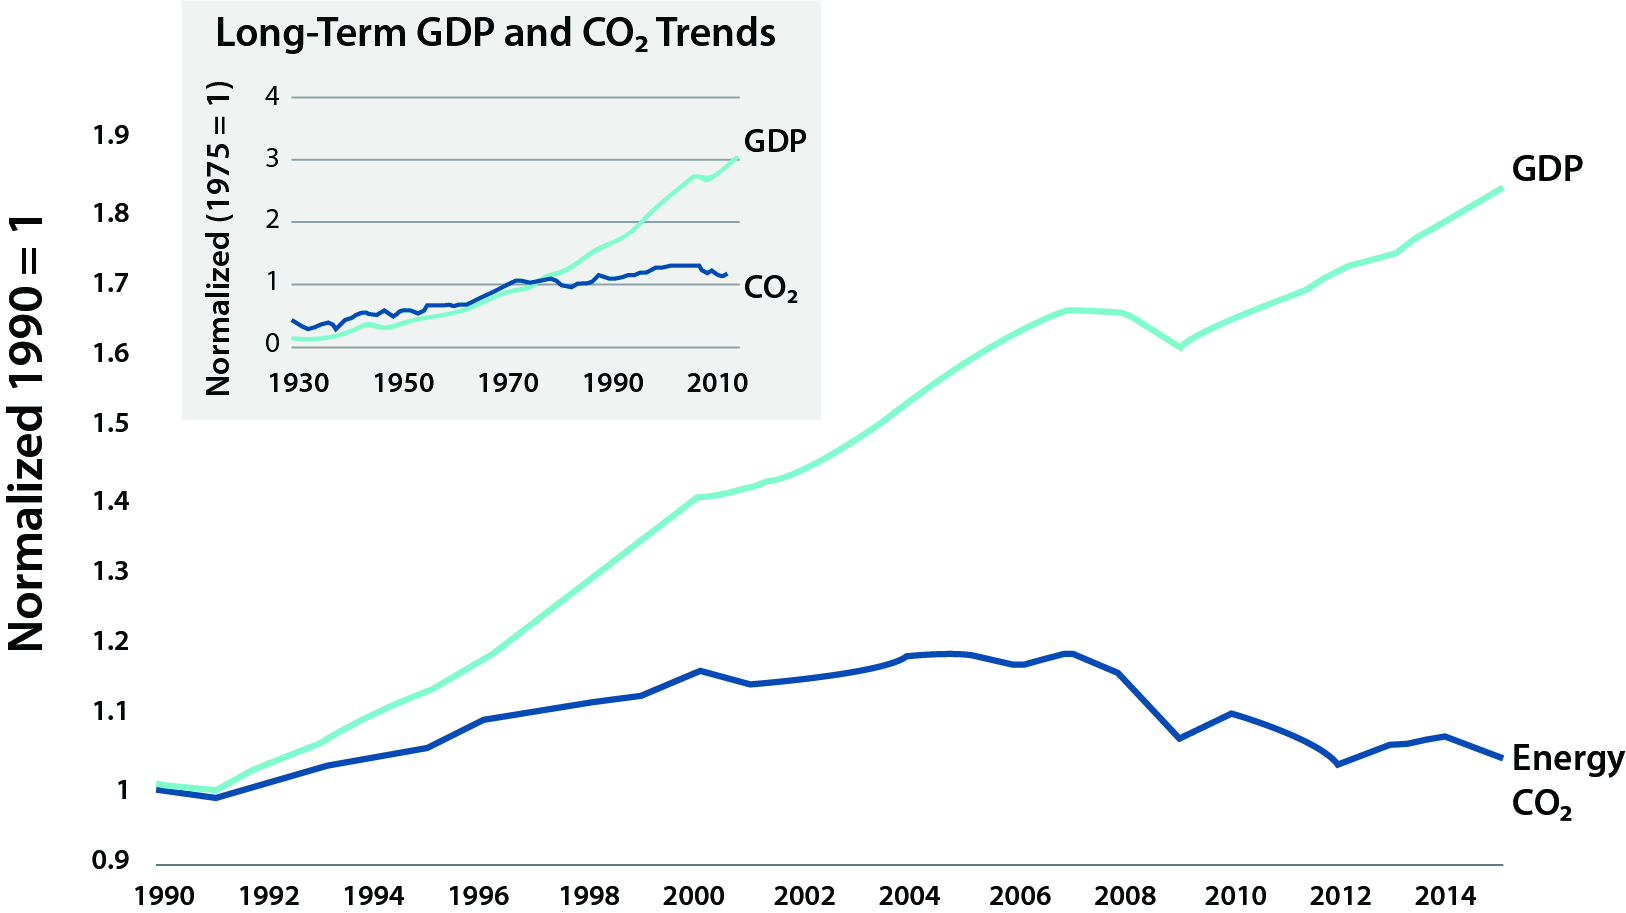
The historical trajectories of energy use, CO2e emissions, and economic fluctuations seem to move together, and, if previous average trends portend system response, North American energy use can be expected to rebound from its current trend and exceed the previous peak energy use and emissions levels by around 2020. Recent detailed examinations of the U.S. historical trends, however, suggest that since 1949, there appears to be a shift from a path that closely maps gross domestic product (GDP) with energy use and CO2e emissions to a divergence of these trends, and this divergence became particularly evident after 1972 (see Figure 3.1). Further research suggests that structural changes in the energy and economic systems are reducing the growth of emissions, such that emissions are contracting during recessions faster than they increase during economic expansions. Thus, the rate of increase of CO2e emissions during the expansion phase continues to be substantially reduced, and this has been particularly noticeable since the early 1990s contraction (Burke et al., 2015b; Shahiduzzaman and Layton 2015). The dynamics underpinning the most recent trends are examined in this chapter and may signal shifts in the energy–economic growth relationship, implying the potential for future new energy and emissions patterns.