<b>Huntzinger</b>, D. N., A. <b>Chatterjee</b>, D. J. P. Moore, S. Ohrel, T. O. West, B. Poulter, A. P. Walker, J. Dunne, S. R. Cooley, A. M. Michalak, M. Tzortziou, L. Bruhwiler, A. Rosenblatt, Y. Luo, P. J. Marcotullio, and J. Russell, 2018: Chapter 19: Future of the North American carbon cycle. In Second State of the Carbon Cycle Report (SOCCR2): A Sustained Assessment Report [Cavallaro, N., G. Shrestha, R. Birdsey, M. A. Mayes, R. G. Najjar, S. C. Reed, P. Romero-Lankao, and Z. Zhu (eds.)]. U.S. Global Change Research Program, Washington, DC, USA, pp. 760- 809, https://doi.org/10.7930/SOCCR2.2018.Ch19.
Future of the North American Carbon Cycle
The land carbon cycle is sensitive to atmospheric composition, temperature and precipitation changes, disturbances such as fire and disease outbreaks, and land-use and land-cover changes. Future projections of the North American land carbon sink were examined using simulations from a nine-member ensemble of coupled carbon-climate models, forced with the four different future scenarios (i.e., RCPs) as described in Section 19.3. These are the same models and RCPs that informed the Intergovernmental Panel on Climate Change Fifth Assessment Report (IPCC; Ciais et al., 2013).
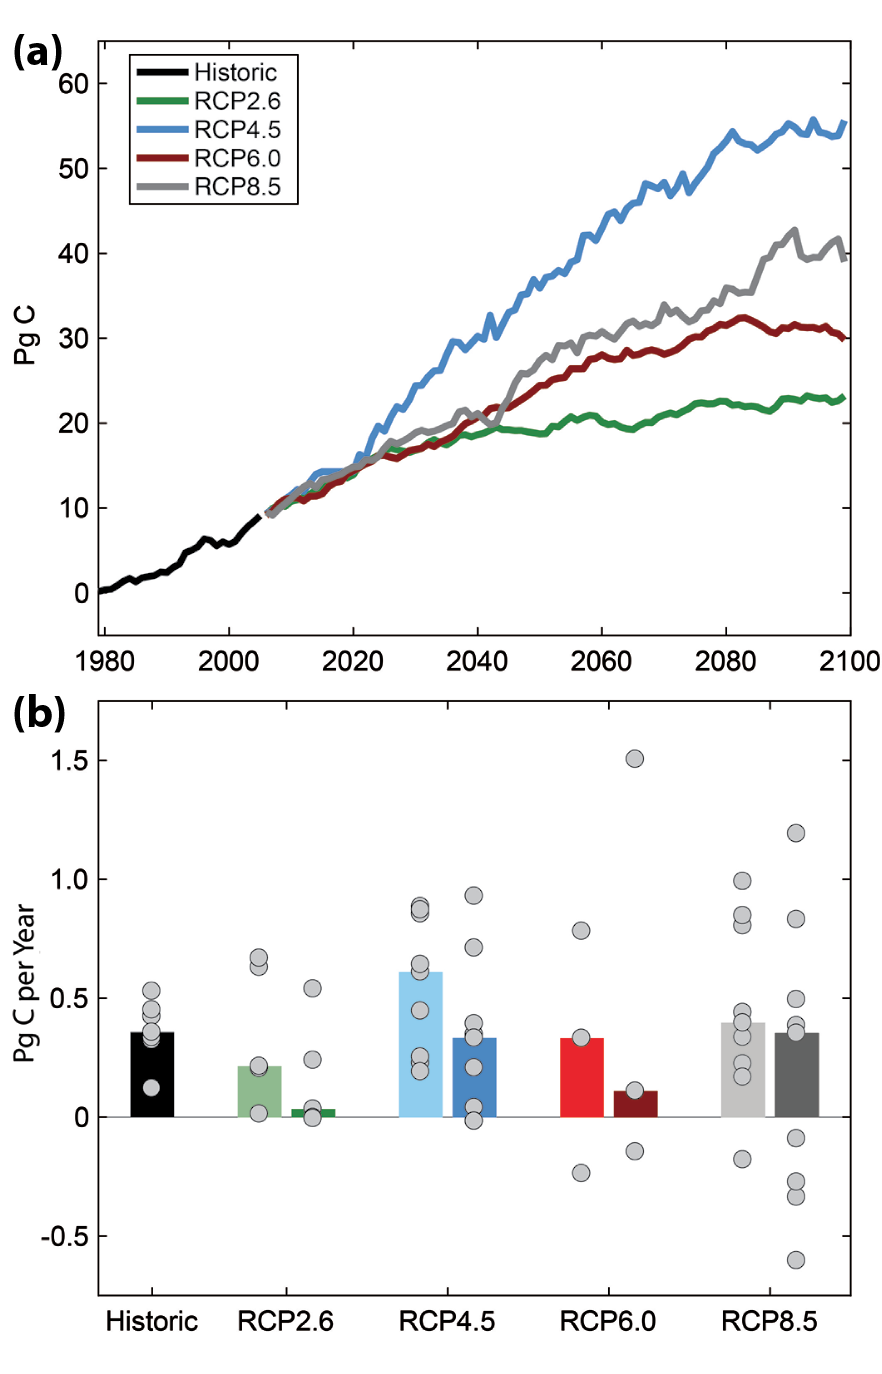
Models estimate the strength of the mean North American net land sink from 1990 to 1999 to be 0.36 ± 0.09 Pg C per year (median ± interquartile range), which is consistent with estimates from other methods (see Ch. 2: The North American Carbon Budget). Depending on the future scenario, model projections of net land carbon sink strength range from a slight decrease (0.21 ± 0.42 Pg C per year with RCP2.6) to a doubling (0.61 ± 0.60 Pg C per year with RCP4.5) of the current sink strength by midcentury. However, in all scenarios, the strength of the net land sink within North America is projected to either remain near current levels (e.g., RCP4.5 and RCP8.5) or decline significantly (e.g., RCP2.6 and RCP6.0) by the end of the century (see Figure 19.3). The higher human-driven emission scenarios and/or the longer the time horizon for the projections, the more uncertain the future of the North American carbon cycle. In fact, models project that the land could be either a net sink (of up to 1.5 Pg C per year) or a net source of carbon (of up to 0.6 Pg C per year) to the atmosphere by 2100 (see Figure 19.3).
Figure 19.3: Projected Cumulative and Net Land Carbon Sink for North America Based on Four Future Scenarios.
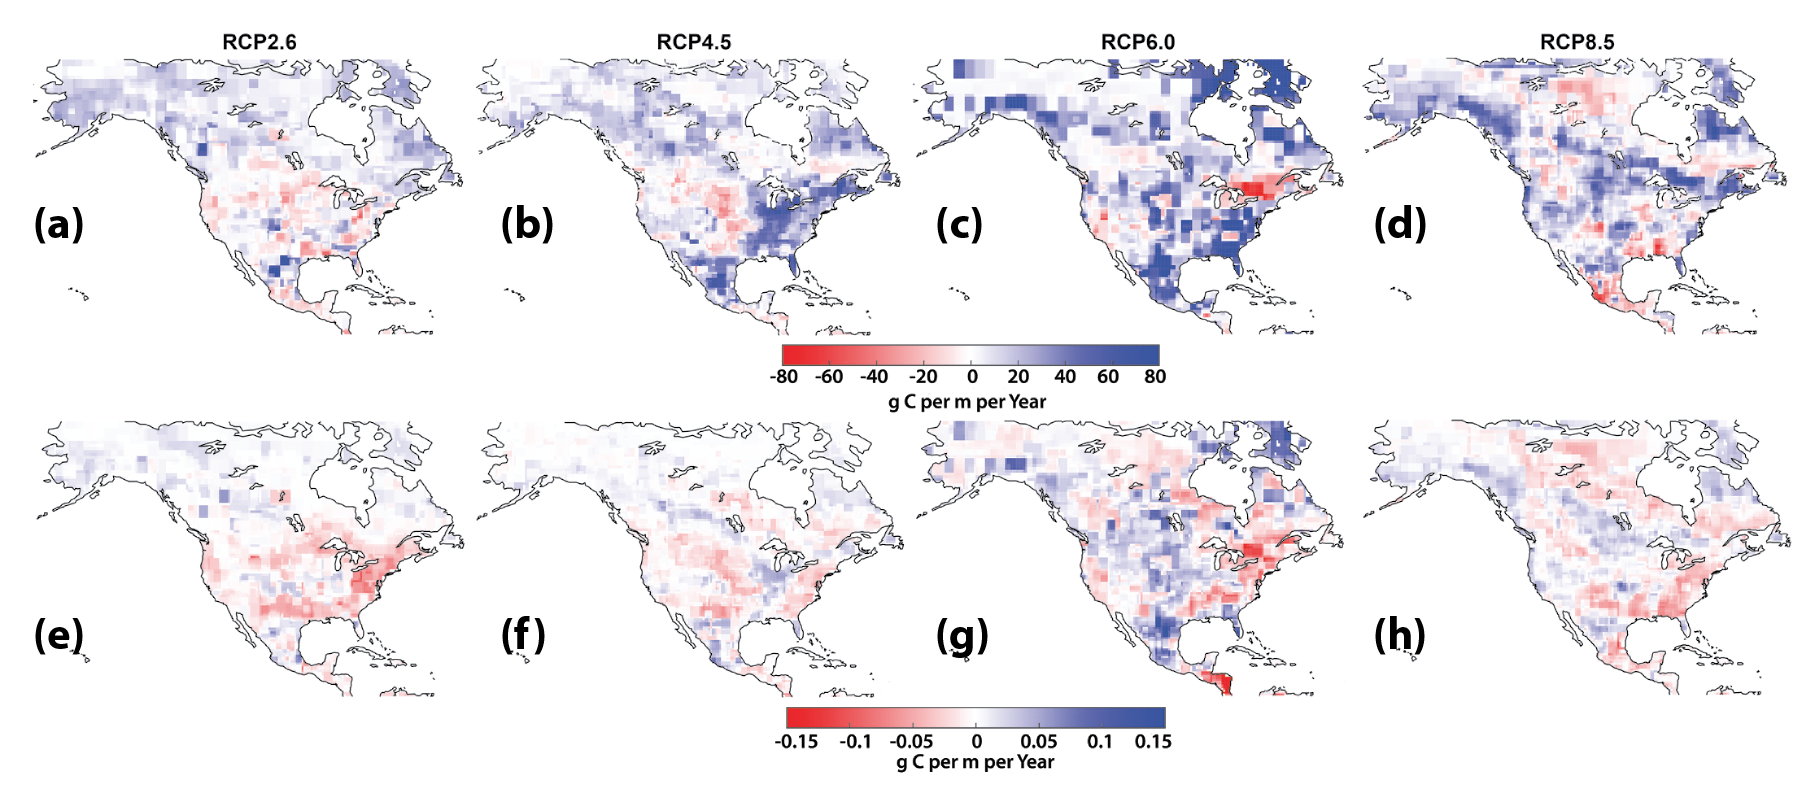
Geographically, under the two stabilization scenarios (i.e., RCP4.5 and RCP6.0), most of North America’s terrestrial biosphere is projected to remain a net sink for atmospheric CO2 through the end of the century (see Figure 19.4 However, the strength of carbon uptake could weaken in the East and parts of the U.S. Great Plains. Under both the low and high human-driven emissions scenarios (RCP2.6 and RCP8.5), the strength of terrestrial carbon uptake is projected to weaken in much of the southern United States and in parts of northern Canada, with some temperate and northern regions turning from a net sink to a net source of CO2 to the atmosphere (see Figure 19.4). With the exception of RCP6.0, under all scenarios, models project that both rising CO2 and climate warming will lead to a strengthening of net carbon uptake in Alaska (see Figure 19.4). This projected net increase in carbon sink strength is due to increased net primary production in upland alpine ecosystems (Zhu and McGuire 2016), which many models project will offset increased emissions from climate warming and more frequent wildfires. However, results from a synthesis of soil warming experiments (Crowther et al., 2016) contradict these model projections, adding to the already existing large uncertainty (see Section 19.5.2 for more details).
Figure 19.4: Projected Decadal Median Net Land Carbon Sink for North America Based on Four Future Scenarios. (a–d)
The combined and uncertain effects of rising CO2, climate change, and land-use management contribute to the large range of model projections (Arora et al., 2013; Ciais et al., 2013). As discussed in Section 19.3.2, land-use change is a key driver of carbon uptake and loss in the terrestrial biosphere. Globally, emissions related to land-use change are projected to decline with all RCPs (see Figure 19.2), but the spatial pattern and distribution of land-use changes and their projected impacts on the North American carbon sink are not clear. In addition, local and regional ecosystems will vary considerably in their responses to changes in climate and atmospheric composition. Discussed in the next sections are key factors that will influence the sensitivity of the land carbon sink to both a warming climate and rising CO2 and thus influence the future trajectory of North American land carbon stocks and flows.
19.4.1 Response of the Land Carbon Cycle to Rising Atmospheric CO2
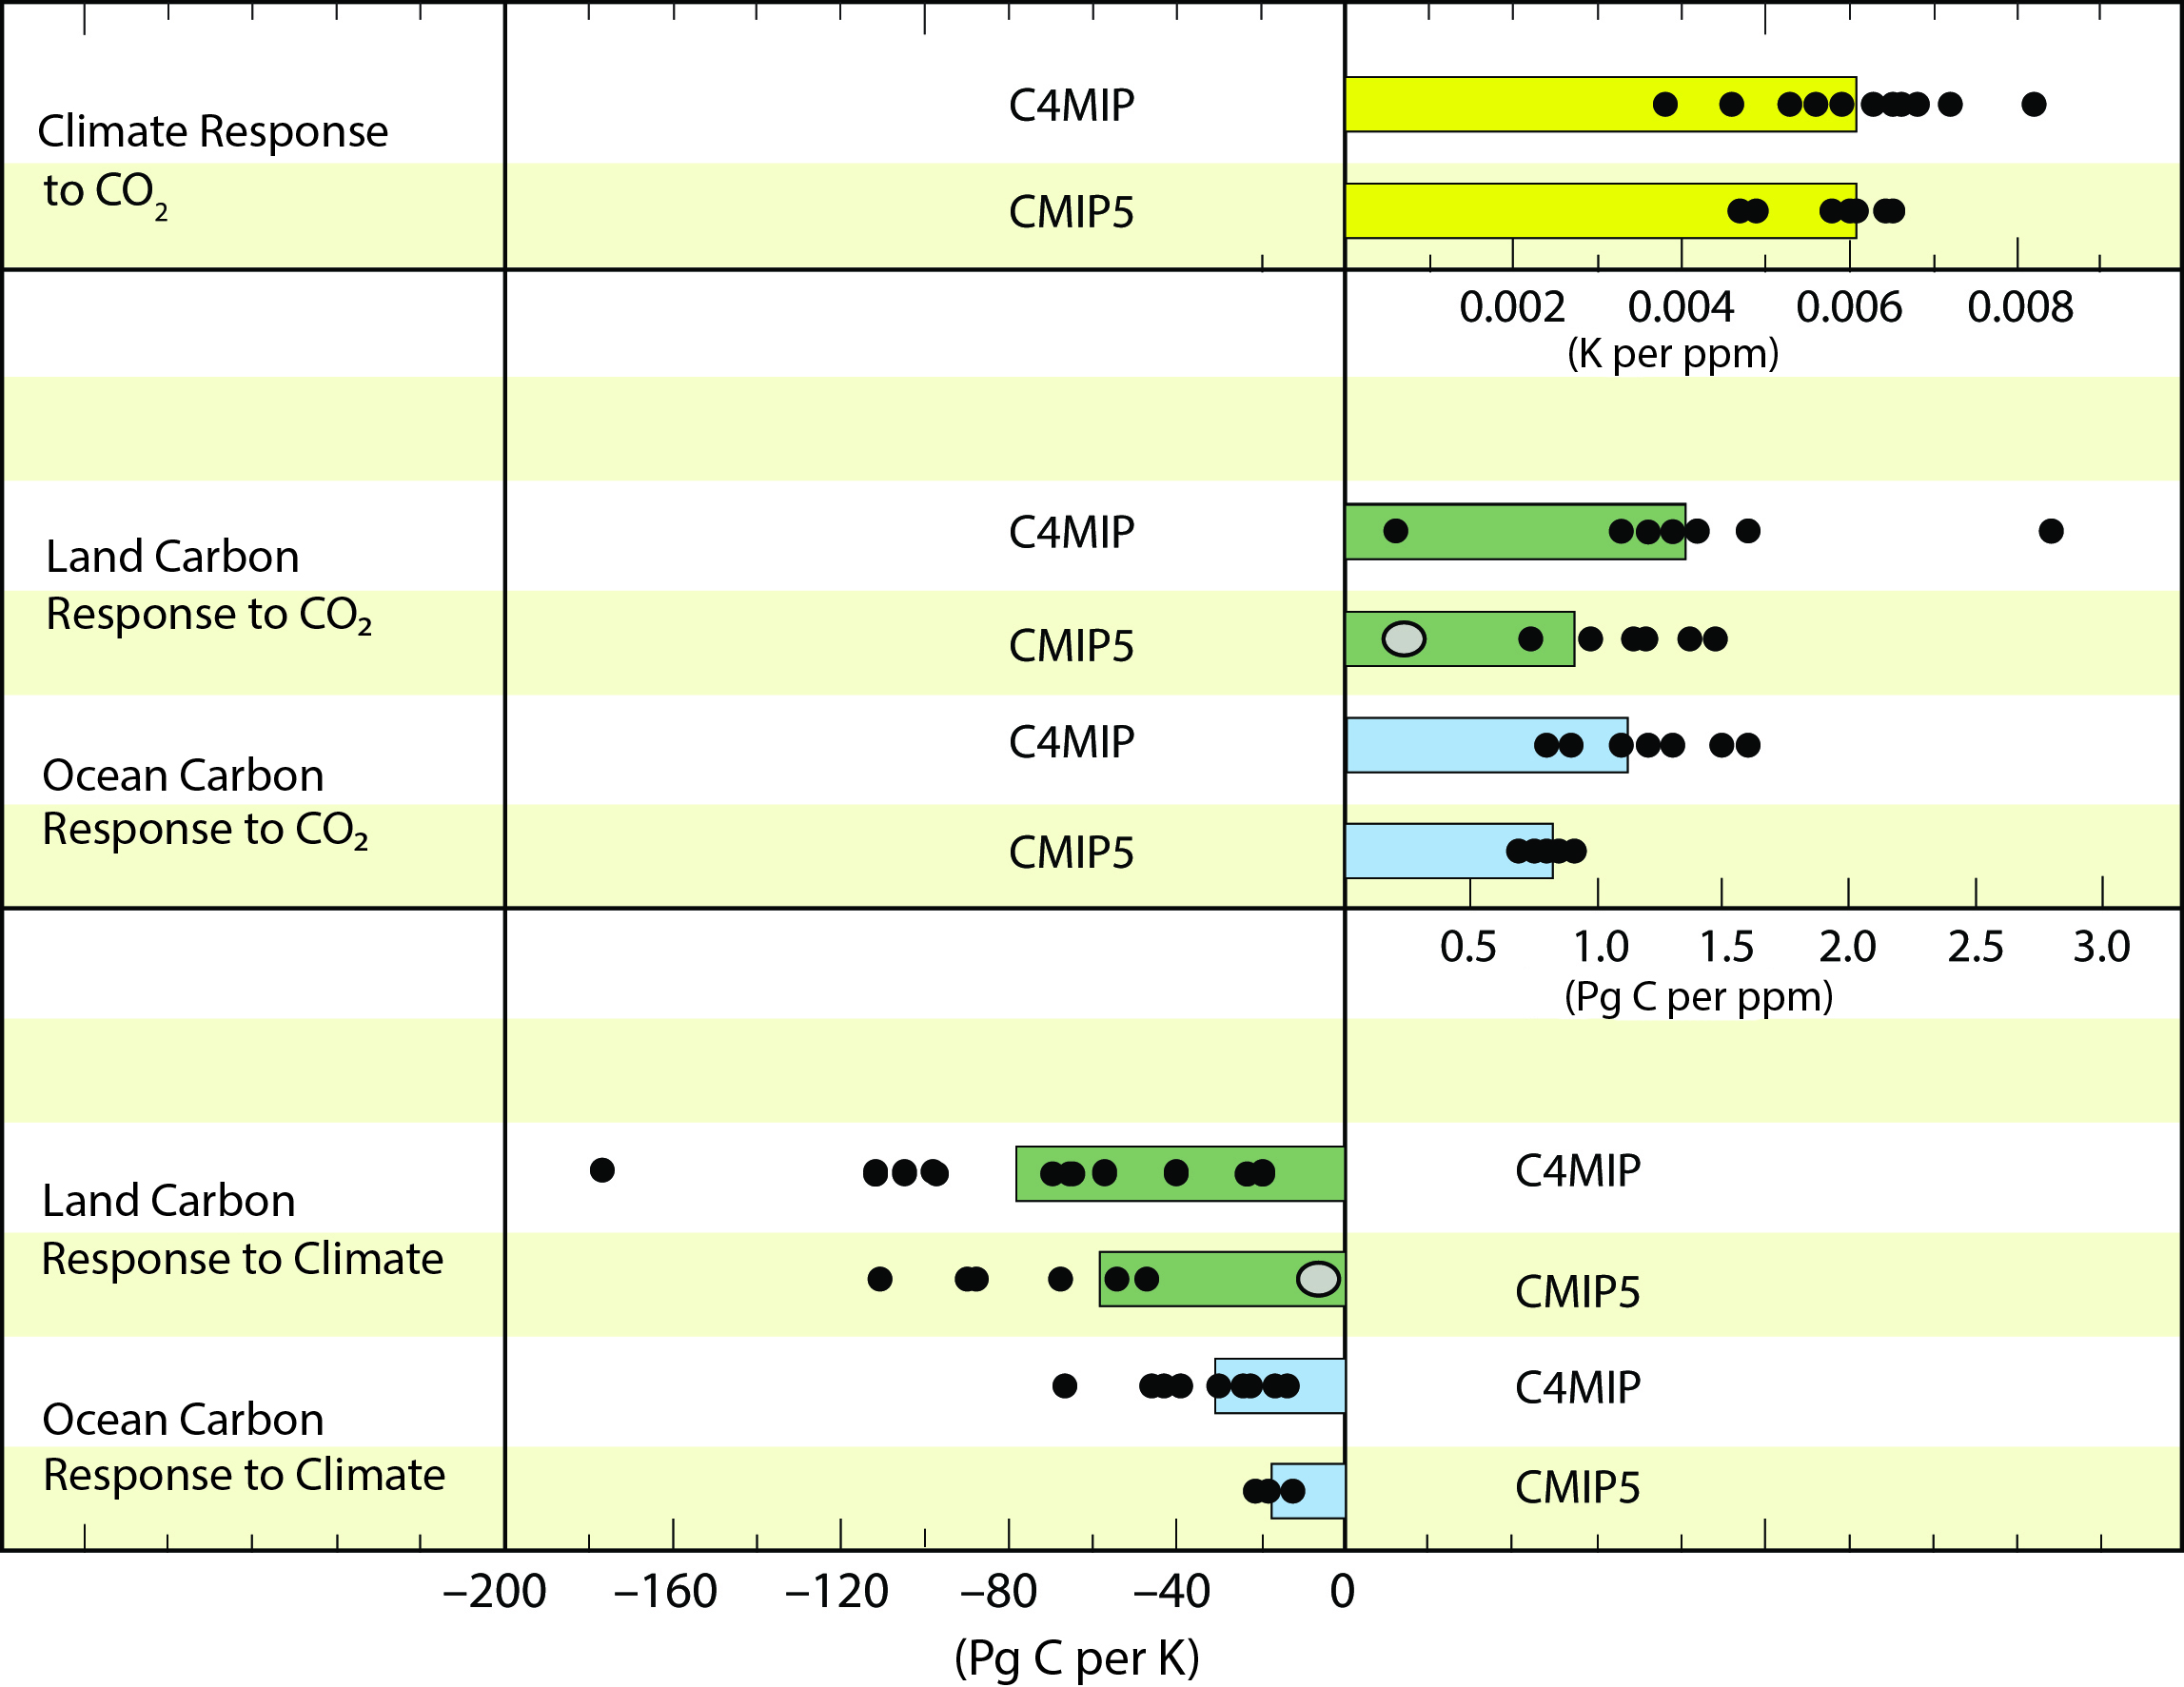
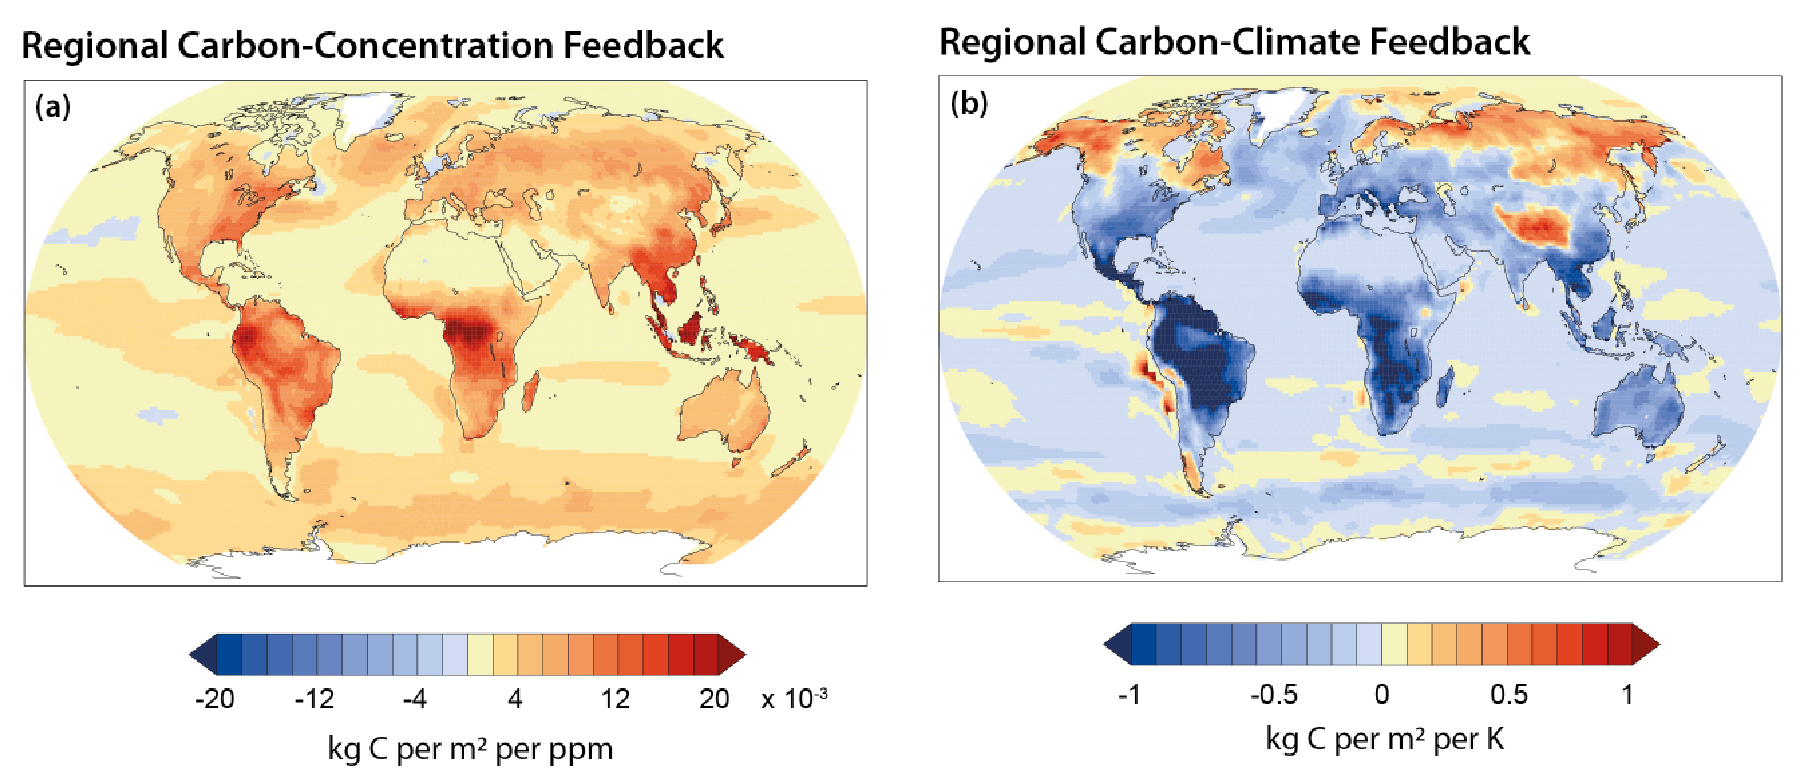
Land carbon uptake and storage are projected to increase with rising atmospheric CO2 (via CO2 fertilization), both globally and within North America (Ciais et al., 2013). While models tend to agree on the direction of the carbon uptake response to rising CO2, they show low agreement on the magnitude (size) of this response (see Figure 19.5). Figure 19.6 shows the spatial distribution of the modeled carbon sink’s response to an increase in atmospheric CO2 (see Ciais et al., 2013). The response is largest in more humid regions (e.g., U.S. Midwest and East Coast) with forested areas and greater amounts of vegetation. Whether models are correct in their projections of a sustained increase in photosynthesis by rising CO2 (i.e., the CO2 fertilization effect) is uncertain for a number of reasons.
Figure 19.5: Land and Ocean Carbon Cycle Feedbacks from Two Generations of Coupled Carbon-Climate Models.
First, the degree to which rising CO2 leads to enhanced plant growth likely depends on the age distribution of trees within a forested ecosystem. Much of the evidence for a CO2-based enhancement of ecosystem carbon storage comes from experiments (see Ch. 17: Biogeochemical Effects of Rising Atmospheric Carbon Dioxide). Ecosystem CO2-enrichment experiments in North American forests tend to show that, in the short term (e.g., up to 10 years), CO2 fertilization increases forest production by 20% to 25% (McCarthy et al., 2010; Norby et al., 2005; Talhelm et al., 2014). However, most of these forest experiments are located in young forests that also were accumulating biomass under ambient CO2 concentrations. The few experiments conducted on individual trees in more mature forests tend to show little or no growth response (Bader et al., 2013; Klein et al., 2016). Accurately projecting future CO2 fertilization effects will likely require accounting for both the forests that already are accumulating biomass and the more established ones that are not. The different responses observed across the range of forest ages probably are related to forest interactions with other factors that limit plant production such as nitrogen availability and perhaps water.
Second, nutrients will likely constrain the land carbon cycle’s response to rising CO2 (e.g., Norby et al., 2010). Nitrogen is a key nutrient for plant growth and can limit or stimulate plant productivity and carbon uptake, depending on nitrogen availability. Nitrogen acquisition and availability probably will be a controlling factor in the strength and persistence of CO2 fertilization (see Ch. 17: Biogeochemical Effects of Rising Atmospheric Carbon Dioxide). However, many current models do not consider nutrient cycling (Ciais et al., 2013; Hoffman et al., 2014), and models that do consider nutrient cycling exhibit substantial uncertainty in responses of terrestrial ecosystems to increased atmospheric CO2 (Walker et al., 2015; Zaehle and Dalmonech 2011). Insights into nitrogen’s complex interaction with carbon uptake are only now beginning to emerge with sufficient detail to model computationally (Drake et al., 2011; McCarthy et al., 2010; Norby et al., 2010; Terrer et al., 2016; Walker et al., 2015; Zaehle et al., 2014).
Third, the response of soil carbon stocks to rising CO2 is uncertain. Results from some studies suggest that even if rising CO2 does not lead to increased carbon storage in forest biomass, it may increase carbon storage in soils (e.g., Iversen et al., 2012). However, increased soil carbon input also may accelerate microbial decomposition of carbon and thus soil carbon turnover, leading to less overall soil carbon storage (Hungate et al., 2013; van Groenigen et al., 2014). The strength and magnitude of soil carbon losses, therefore, remains highly uncertain (Georgiou et al., 2015; Walker et al., 2015).
Consequently, it is unclear whether land ecosystems will truly sequester more carbon under elevated CO2. The potential for increased photosynthesis from rising CO2 to enhance long-term carbon storage in North American terrestrial ecosystems depends on 1) whether rising CO2 simply intensifies the rate of short-term carbon cycling (i.e., shorter carbon residence time) or 2) whether the additional carbon is used by plants to build more wood and tissue or is stored as long-lived soil organic matter. Furthermore, variations across biomes and climatic regimes are likely, and localized extreme weather events, such as droughts or fires, can lead to a decrease in regional ecosystem carbon uptake and thus negate any expected general increases (Reichstein et al., 2013).
19.4.2 Response of the Land Carbon Cycle to a Warming Climate
Climate change is projected to partially negate expected increases in land carbon sinks caused by rising atmospheric CO2 concentrations (see Figure 19.5; Ciais et al., 2013; Friedlingstein 2015). Model projections of reductions in carbon storage due to climate change are primarily driven by increased decomposition of organic matter in soils in a warmer world (Friedlingstein 2015; see Ch. 12: Soils). However, the magnitude and direction of the global and North American land carbon cycle’s response to a changing climate are uncertain because of other climate warming effects. For example, warmer temperatures are projected to reduce land carbon uptake in temperate North America due to heat stress in plants and increased respiration in soils, both of which could lead to carbon losses (see Figure 19.6). Conversely, at higher latitudes where temperature is a limiting factor, a warming climate could lengthen the growing season, leading to increased carbon storage in northern ecosystems. In addition, a warming climate can alter the water cycle through changes in precipitation patterns, snowpack, and extreme events such as droughts and floods. All these factors can alter ecosystem function and carbon cycle dynamics.
Figure 19.6: Simulated Spatial Distribution of Land and Ocean Carbon Sink Sensitivity to (a) Rising Atmospheric Carbon Dioxide (CO2) and (b) a Warming Climate
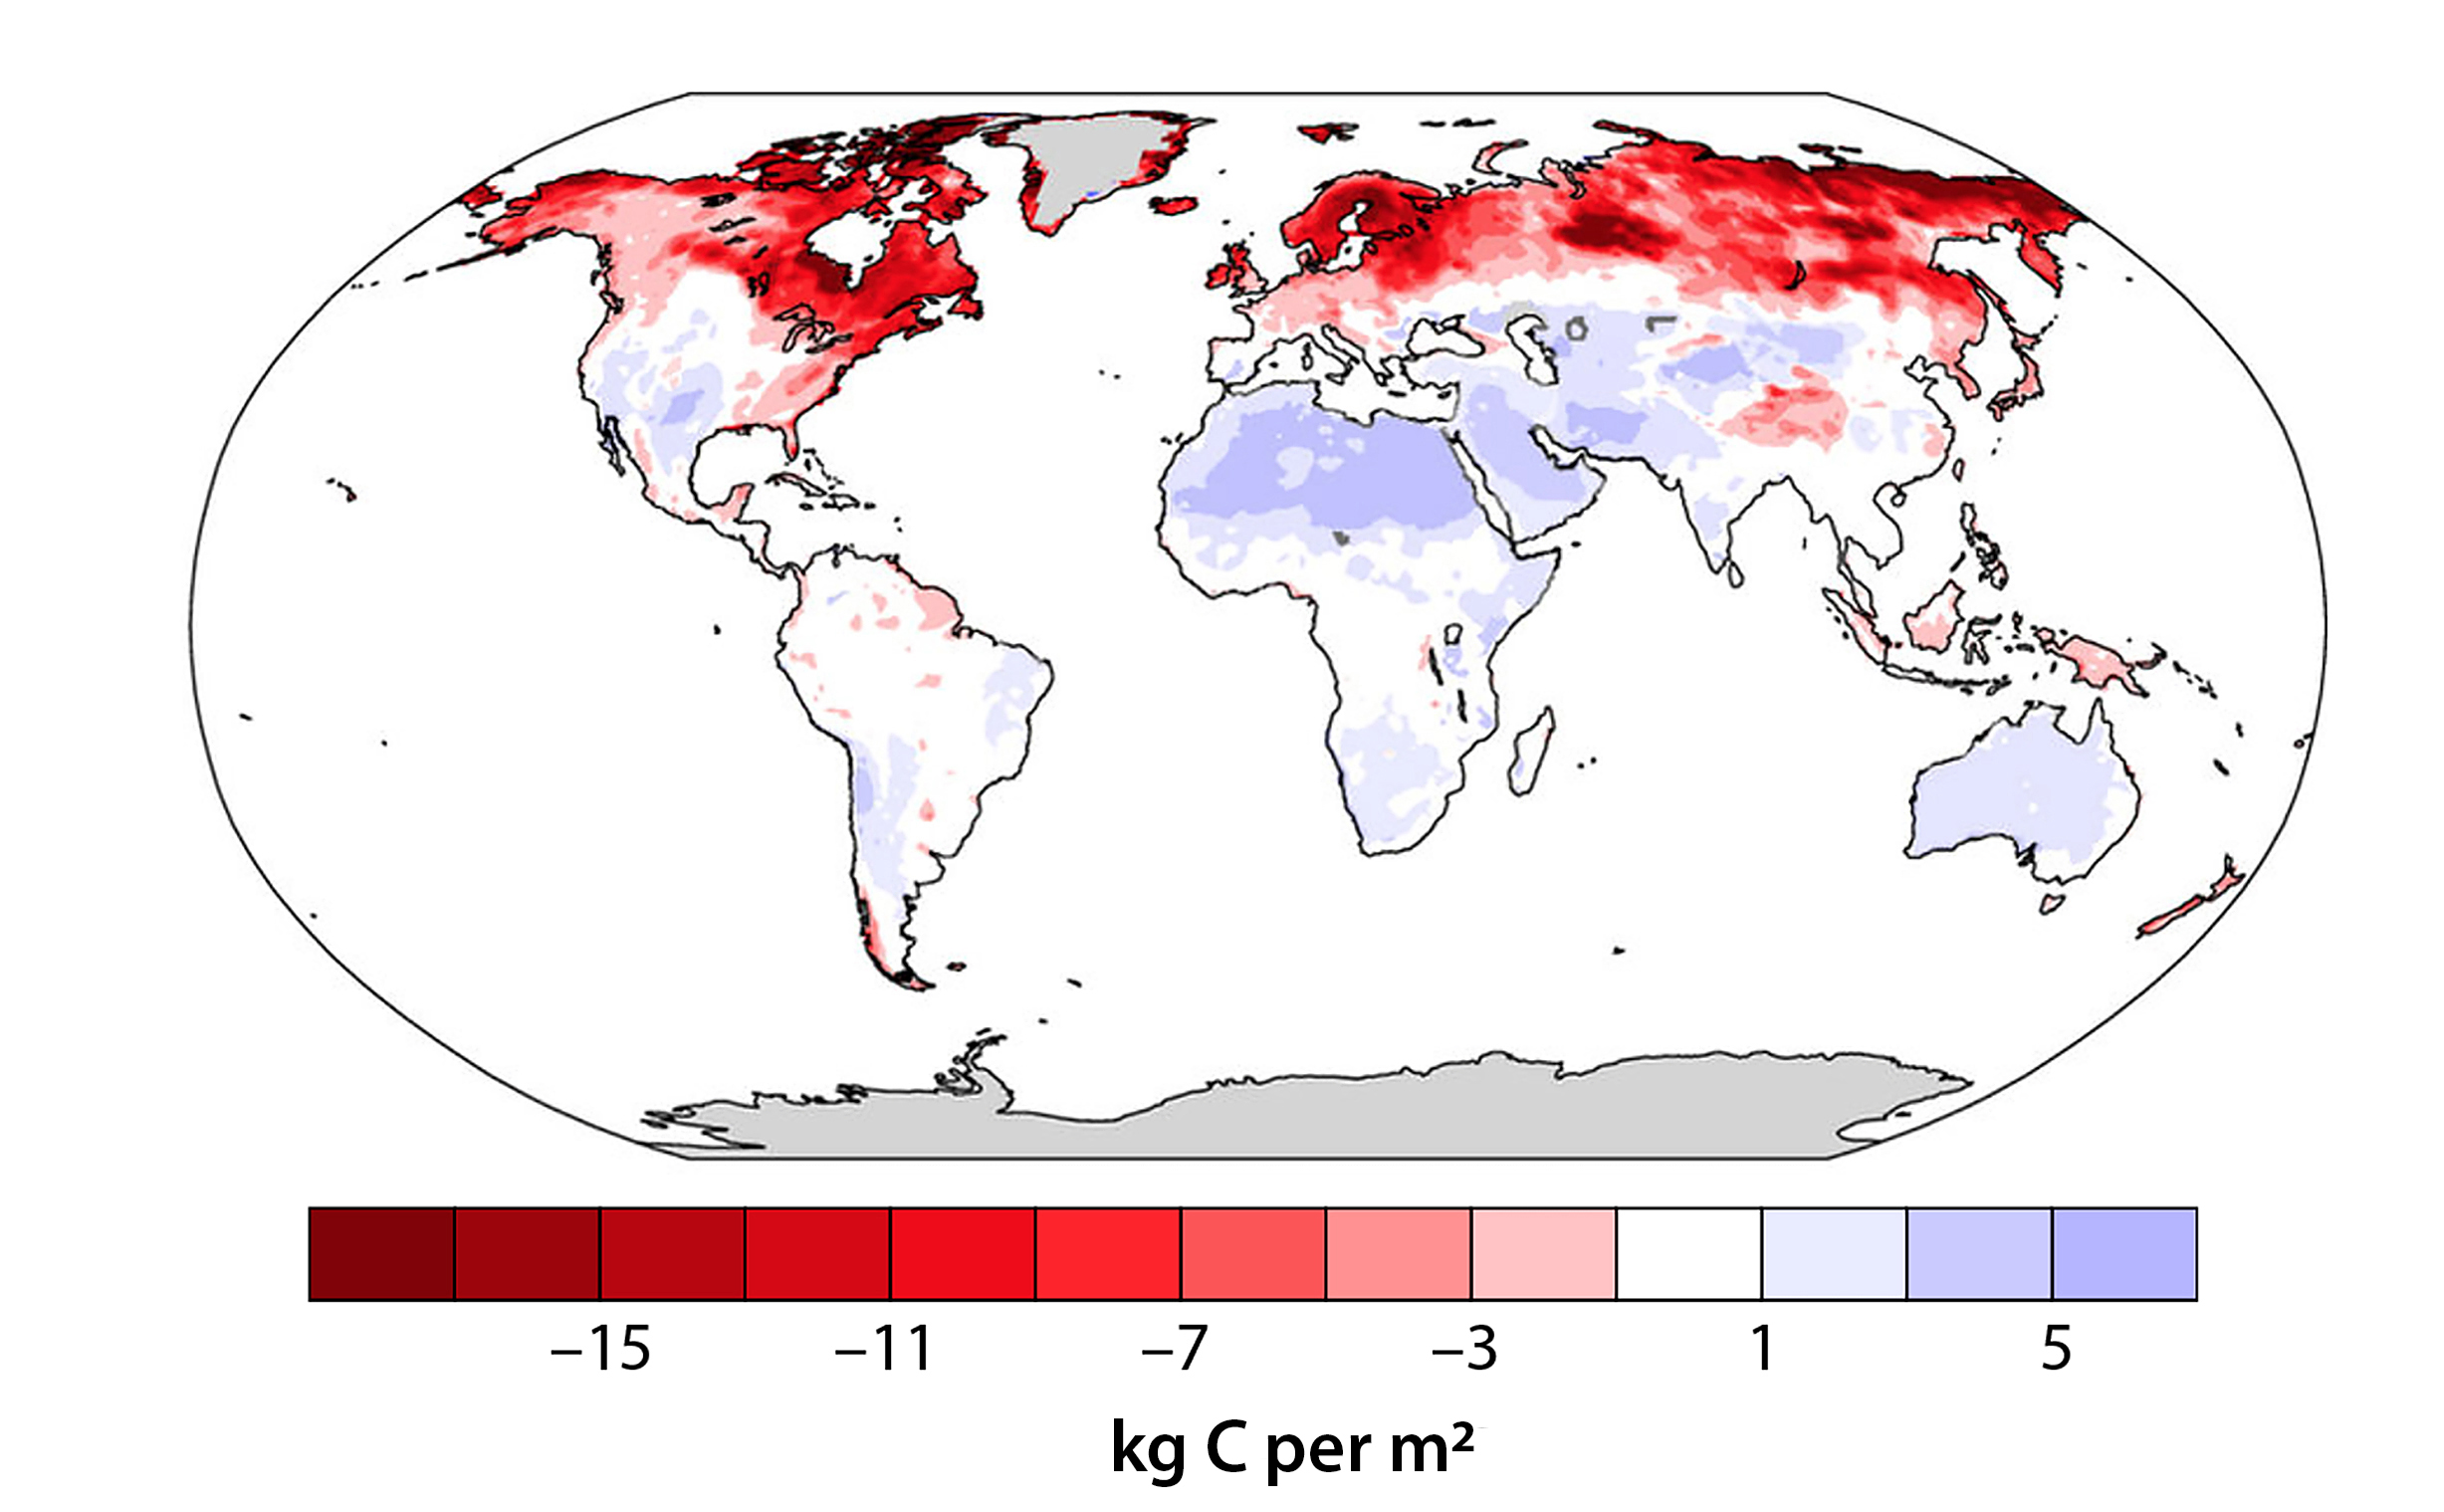
Globally, soils store 1,500 to 2,400 Pg C, more than twice the amount of carbon in the atmosphere (Bradford et al., 2016). Models project that as the climate warms, carbon losses from soils could range from minimal to significant, with up to one-third of the global soil carbon stock lost by 2100 (Bradford et al., 2016). The low confidence in these projected changes arises from several factors, including outdated assumptions about the controls on soil carbon turnover in models (i.e., model structure), uncertainty in the parameter values used to control the rate of soil carbon decomposition (i.e., model parameterization), and lack of empirical observations to capture long-term soil carbon dynamics (Bradford et al., 2016; Crowther et al., 2016; see Ch.12: Soils). As a result, changes in soil carbon resulting from a warming climate cannot be reliably predicted (Bradford et al., 2016). A recent study by Crowther et al. (2016) synthesized observations of warming-induced changes in soil carbon stocks from several field experiments worldwide. Their results suggest that, under business-as-usual emissions and expected climate change (i.e., 2°C increase over the next 35 years), warming could lead to a net loss of 55 ± 50 Pg C globally from surface soils by 2050. The effect of warming on soil carbon stocks varied across sites, depending on the size of the soil carbon pool and the extent and duration of warming. Their results suggest that soil carbon losses will be greatest in northern latitudes (e.g., the northeastern United States and Arctic and boreal regions of North America; see Figure 19.7) due to the region’s large soil carbon stocks and rapid rates of projected warming (Crowther et al., 2016; see also USGCRP 2017a and Section 19.3.3). The spatial distribution of potential soil carbon losses derived by Crowther et al. (2016) contradicts projections from coupled carbon-climate models used to inform the latest IPCC report (see Figure 19.6). Models project that warmer temperatures and an extended growing season in high-latitude areas of North America will lead to increased plant carbon inputs to soil that will more than offset increases in soil carbon decomposition rates under warmer temperatures. However, results from warming experiments suggest the opposite—losses considerably outweigh any potential positive vegetation responses (Bradford et al., 2016; Crowther et al., 2016). The difference in modeled and experimental results could be related to how soil carbon models are configured (see Ch. 12: Soils). A number of studies point to organic-rich soils (such as wetlands and permafrost) as the carbon pools most vulnerable to climate warming (Bradford et al., 2016; Grosse et al., 2016; Koven et al., 2015; Ringeval et al., 2011; Schuur et al., 2015). However, many models do not explicitly account for permafrost dynamics and the potential carbon loss from thawing permafrost soils (Bradford et al., 2016; see Section 19.7.2 for more details). In addition, inadequate understanding of interactive soil and plant processes and ecosystem response to climate change impedes accurate representation of soil carbon processes in current models.
Figure 19.7: Potential Vulnerability of Soil Carbon Stocks to Climate Warming