<b>Huntzinger</b>, D. N., A. <b>Chatterjee</b>, D. J. P. Moore, S. Ohrel, T. O. West, B. Poulter, A. P. Walker, J. Dunne, S. R. Cooley, A. M. Michalak, M. Tzortziou, L. Bruhwiler, A. Rosenblatt, Y. Luo, P. J. Marcotullio, and J. Russell, 2018: Chapter 19: Future of the North American carbon cycle. In Second State of the Carbon Cycle Report (SOCCR2): A Sustained Assessment Report [Cavallaro, N., G. Shrestha, R. Birdsey, M. A. Mayes, R. G. Najjar, S. C. Reed, P. Romero-Lankao, and Z. Zhu (eds.)]. U.S. Global Change Research Program, Washington, DC, USA, pp. 760- 809, https://doi.org/10.7930/SOCCR2.2018.Ch19.
Future of the North American Carbon Cycle
During the coming decades and centuries, human-driven CO2 emissions are expected to continue to drive changes in climate (Gregory et al., 2009) and thus the carbon cycle. Model projections of how the future may evolve with respect to climate change and the carbon cycle are commonly driven by a set of plausible future scenarios. These scenarios are useful in helping to inform decision making by offering insights into possible tradeoffs related to different types of actions or policies. While these scenarios often are not an exhaustive treatment of all mitigation or energy resource options, they do consider plausible changes to market structures and energy production capacity, as well as technological advancements and existing and potential policies to reduce CO2 and other greenhouse gas (GHG) emissions (e.g., EIA 2016; Mohr et al., 2015; van Vuuren et al., 2011).
At the global scale, a series of Representative Concentration Pathways (RCPs) was created for CMIP5 using different integrated assessment models. These RCPs consider alternate socioeconomic pathways that result in different emissions levels for both fossil fuel use and land-use change, and thus different potential atmospheric GHG concentrations (Jones et al., 2013; van Vuuren et al., 2011). These RCPs are used to drive Earth System Models (e.g., CMIP5; Friedlingstein 2015; Friedlingstein et al., 2014) in order to project potential climate and carbon cycle changes at global and regional scales. The set of four pathways used by CMIP5 and similar studies are representative of the range of scenarios presented in the literature and include one mitigation scenario leading to very low radiative forcing (RCP2.6), two medium stabilization scenarios (RCP4.5 and RCP6.0), and one high baseline emissions scenario (RCP8.5; van Vuuren et al., 2011). Each RCP is named after its target radiative forcing, measured in watts per square meter (W/m2), in the year 2100. A general description of the RCPs is provided next and in Figure 19.1 and Figure 19.2. More details on the characteristics of each RCP are available in van Vuuren et al. (2011).
Figure 19.1: Projected Global Energy Consumption and Emissions
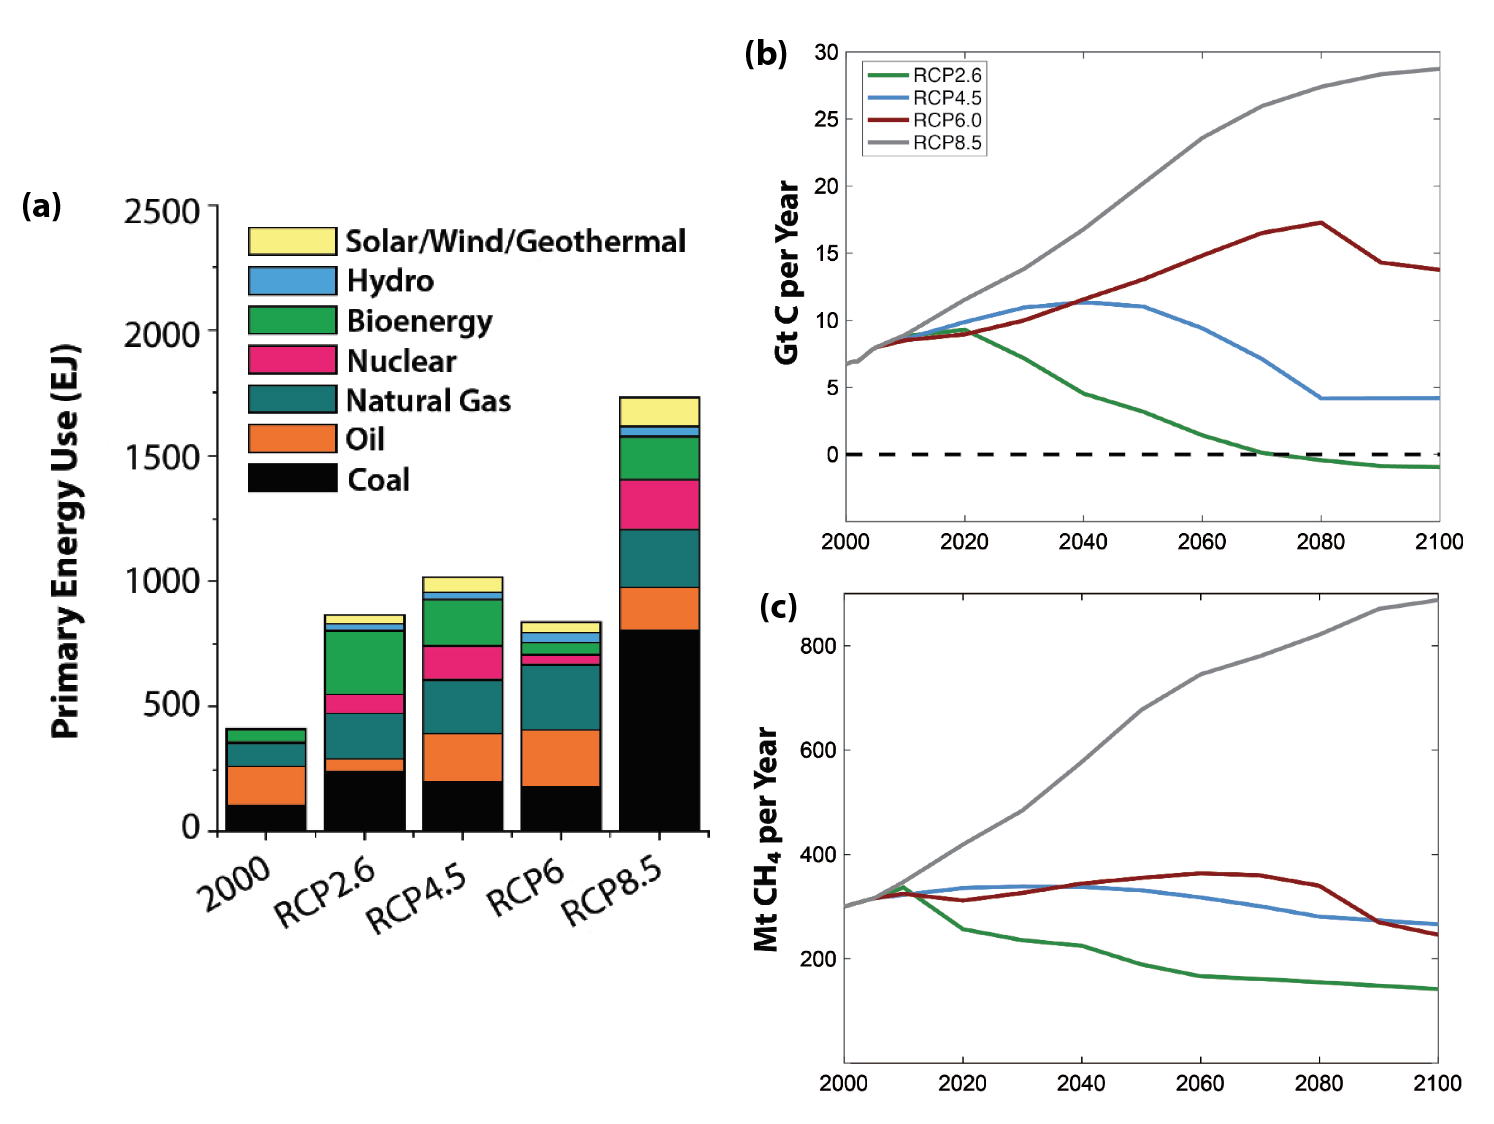
Figure 19.2: Projections of Future Land-Use Area and Land-Use Emissions

RCP8.5 High Emissions Scenario. Projects increasing CO2 and CH4 emissions over time due to increased energy intensity as a result of high population growth and lower rates of technology development leading to radiative forcing of 8.5 W/m2 by 2100. This scenario assumes an increase in cropland and grassland area driven by the demands of population growth.
RCP6.0 Stabilization Scenario. Projects a range of technologies and strategies to reduce CO2 emissions after the year 2080, coupled with fairly steady CH4 emissions throughout the century to stabilize radiative forcing at 6 W/m2 in 2100. This scenario assumes an increase in cropland area, but a decline in pasture area due to aggressive implementation of intensive animal husbandry.
RCP4.5 Stabilization Scenario. Projects a range of technologies and strategies to reduce CO2 emissions after 2040, coupled with fairly steady CH4 emissions throughout the century to stabilize radiative forcing at 4.5 W/m2 in 2100. This scenario assumes a decrease in cropland and grassland area due to climate policies that value carbon in natural vegetation.
RCP2.6 Low Emissions Scenario. Projects an increased use of bioenergy and carbon capture and storage, which leads to a substantial reduction in CO2 emissions after 2020. This reduction coupled with declining CH4 emissions from energy production, transportation, and livestock leads to a peak in radiative forcing of 3 W/m2, followed by a decline to 2.6 W/m2 by 2100. Cropland area increases, but largely as a result of bioenergy production. Grassland area remains relatively constant as the increase in animal production is offset by more intensive animal husbandry.
These RCPs describe a range of plausible global emissions and land-use scenarios that will drive changes in global climate. Later in this chapter, CMIP5 projections driven by these scenarios will be used to discuss projected changes in the North American land and coastal ocean carbon cycles. Section 19.3.1, summarizes projected trends of human-driven emissions from fossil fuel use, and Section 19.3.2 summarizes land-use management and change specific to North America. Also described is how climate is projected to change in North America according to different projections of future global emissions (see Section 19.3.3). Even though the following sections primarily focus on changes over North America, these changes have been placed in a global context as necessary.
19.3.1 Fossil Fuel Emissions
Fossil fuels are vital to current North American energy needs, accounting for about 80% of global energy consumption (Mohr et al., 2015). Emissions from fossil fuel combustion in North America’s energy sector currently represent a source of carbon (mostly as CO2) to the atmosphere and will continue to be a source into the future. Projections suggest that by 2040, total North American fossil fuel emissions will range from 1,504 to 1,777 Tg C per year (see Table 19.1). Compared to 2015, this range represents either a 12.8% decrease or a 3% increase in absolute emissions. These estimates are based on a range of projections for each country and provide “high” and “low” bounds for potential future North American carbon emissions from fossil fuel burning.
Table 19.1. Projected Energy-Related Emissions from Fossil Fuel Burning for Canada, Mexico, the United States, and North America from 2015 to 2040
| Canada (Teragrams of Carbon [Tg C]) | 2015 | 2020 | 2030 | 2040 |
|---|---|---|---|---|
| High (High Emissions Scenario, Rapid Growth) | 174 | 181 | 193 | 193 |
| Low (Low Emissions Scenario, Slow Growth) | 174 | 176 | 168 | 168 |
| Source: ECCC 2016a; values for 2040 assumed to be similar to 2030. | ||||
| Mexico (Tg C) | ||||
| High (Current Policies) | 118 | 117 | 127 | 140 |
| Low (New Policies) | 118 | 111 | 97 | 78 |
| Source: Mexico Energy Outlook (IEA 2016). | ||||
| United States (Tg C) | ||||
| High (Reference Case Without Clean Power Plan) | 1,434 | 1,442 | 1,421 | 1,445 |
| Low (Low Economic Growth) | 1,434 | 1,419 | 1,284 | 1,259 |
| Source: U.S. Department of Energy Annual Energy Outlook (EIA 2017). | ||||
| North America (Tg C) | ||||
| High | 1,726 | 1,740 | 1,740 | 1,777 |
| Low | 1,726 | 1,705 | 1,549 | 1,504 |
Values are based on those reported in Ch. 3: Energy Systems, p. 110, and represent a synthesis of projections from three sources: U.S. Department of Energy’s Energy Information Administration (EIA 2017), Environment and Climate Change Canada (ECCC 2016a), and Organisation for Economic Cooperation and Development’s International Energy Agency (IEA 2016).
Energy market projections, and subsequently fossil fuel emissions futures, are subject to large uncertainties because many of the factors that shape energy decisions and future developments in technologies, demographics, and resources cannot be robustly foreseen. These factors include economic and population growth, energy prices, technology innovation and adoption, policies, laws, and regulations. Fossil fuel emissions also can be altered through global organization and cooperation.
Future reductions in emissions often are pursued against a continuing upward trend of population growth and energy use. As such, a timeline to reach peak emissions and reverse emission trends is a goal embraced by several countries. These commitments require complex and comprehensive analyses that project energy sources, production, consumption, and efficiency practices across sectors. Creating baseline and alternative scenarios and assessing their accuracy are areas of continued research (see Ch. 3: Energy Systems for more details on energy and fossil fuel emission trends within North America and their future outlook).
19.3.2 Land-Use Management and Land-Cover Change
Often the terms “land cover” and “land use” are used synonymously, albeit incorrectly. Land cover indicates the Earth’s observed physical and biological land cover, whereas land use encompasses how people use land for shelter, food, feed, fiber, and fuel production, including activities such as livestock grazing, deforestation, and urbanization (IPCC 2000). All these land-use activities influence the exchange of carbon, heat, and water between the land and atmosphere (Pielke et al., 2016; USGCRP 2017a). People’s use of land shifts in response to evolving policies, land-use investments, and market preferences and demands. Land use is also affected by environmental and socioeconomic conditions including population and economic growth. The land-use decisions emerging from these changing conditions affect ecosystem functioning and the land carbon cycle. As a result, land use and land-cover change will play a large role in determining how the future carbon cycle, and thus global climate, will function and change (Barker et al., 2007; Brovkin et al., 2006; Gitz and Ciais 2004). Highlighted next are some recent trends in emissions from land use and land-cover change to provide context for projected future changes. See Ch. 2: The North American Carbon Budget for a more detailed discussion on emissions from current land use and land-cover change.
In 2014, land use and land-use change involving forests in Canada and Mexico resulted in net annual emissions of 72 Tg CO2e1 (ECCC 2016a). Most of these emissions resulted from forest fire and insect disturbance (Canada). In the United States and Mexico, however, land use, land-use change, and forestry (LULUCF) activities resulted in overall net carbon sequestration of 763 Tg CO2e (U.S. EPA 2016) in 2014 and 142 Tg CO2e in 2013 (SEMARNAT-INECC 2016), respectively. The most prominent changes in U.S. land use and land cover in recent decades involve the amount and type of forest cover (Brown et al., 2014) affected through logging and development in the Southeast and Northwest, as well as urban expansion in the Northeast and Southwest. Although total carbon sequestration by LULUCF has increased about 4.5% from 1990 to 2014 (U.S. EPA 2016), this trend—which largely depends on forest area, health, and product markets—is not guaranteed to persist into the future. Some studies estimate a significant decrease in the rate of future carbon uptake by forests resulting from changes in both forest age and land use as a result of increasing population and subsequent demand for agricultural commodities (see Ch. 9: Forests). However, other studies suggest U.S. forests will remain a large carbon sink because of investments in the forest sector (Tian et al., 2018) and CO2 fertilization (e.g., Tian et al., 2016) that will bolster future forest carbon stocks. The range of potential future changes in these stocks is captured in the diverging (e.g., increasing and decreasing) confidence bands associated with projected forest carbon stocks after 2020 in U.S. land-use projections (U.S. Department of State 2016). Nevertheless, future changes in forest carbon stocks will vary geographically and depend on environmental conditions including water availability (Beach et al., 2015; U.S. EPA 2015).
Agricultural emissions, including non-CO2 gases like CH4 (see Box 19.1, Future Methane Cycle) and nitrous oxide (N2O), associated with cropland and livestock management also play an important role in overall emissions levels (see Ch. 5: Agriculture). U.S. agricultural production resulted in GHG emissions totaling 516 Tg CO2e in 2013. These emissions are projected to decline slightly to 494 Tg CO2e by 2030 (U.S. Department of State 2016). Although total cropland area has remained fairly stable over the past 30 years (USDA 2017), cropland could slowly expand with population increases and economic growth. Furthermore, urban land cover could increase by 73% to 98% by 2050 in the lower 48 states (Bierwagen et al., 2010; Wear 2011). Future increases in cropland and urban areas may result in grassland and forest area losses, but the extent of increased cropland area will depend largely on environmental policies, changes in international trade of agricultural commodities, and advancements in agricultural technologies. Also, crop yield improvements consistent with historical trends could deliver an approximately 50% increase in global primary crop production by 2050 (Ray et al., 2013). More intense cropland management could decrease the need for croplands and, in turn, reduce forest and grassland losses.
Projecting the influence of land use and land-use change on future land carbon cycle dynamics is challenging because of uncertainties in projecting market interactions, potential extent of land-use change, and the associated effect of these changes on terrestrial ecosystems (U.S. Department of State 2016). This uncertainty is reflected in the range of future estimates. Globally, land-use change contributed 180 ± 80 Pg C to the atmosphere from 1750 to 2011 (Ciais et al., 2013). Depending on different scenarios in response to increasing population and management and policy choices, land use and land-cover change are projected to contribute an additional 10 to 100 Pg C to the atmosphere by 2050 and 19 to 205 Pg C by 2100 (Brovkin et al., 2013). These projections account for both carbon loss from vegetation clearing (e.g., for agricultural use, bioenergy crops, and wood products) and carbon gain from vegetation regrowth. Canada’s official 2016 emissions projections to 2030 do not include LULUCF emissions or sequestrations. However, according to Canada’s Midcentury Strategy, “analyses show that a substantial reduction in emissions and increase in removals by 2050 is possible through measures such as changes in how we manage forests, greater domestic use of long-lived wood products, greater use of bioenergy from waste wood, and afforestation” (ECCC 2016b). Within the conterminous United States, land use, land management, and climate change are projected, on average, to increase carbon stocks by 17 Pg C (368 Tg C per year) from 2005 to 2050 under different future emissions scenarios (Tan et al., 2015). Other estimates, however, indicate less carbon sequestration (3.7 Pg C from 2015 to 2030, or 246 Tg C per year) and higher uncertainty after 2030 (U.S. Department of State 2016). The primary drivers of carbon uptake arising from land-use and land-cover change activities within the United States are growth of existing forests and activities focused on increased carbon uptake such as forest management and tree planting (U.S. Department of State 2016). Uncertainties in future projections of land use, land-use change, and associated impacts on the North American carbon cycle largely stem from uncertainty in population growth and its effects on forest and agricultural land area, particularly after 2030.
Globally, through carbon sequestration and avoided emissions, effective land-based carbon mitigation strategies could prevent up to 38 Pg C from entering the atmosphere by 2050 (Canadell and Schulze 2014). Land-based emission mitigation strategies include avoided deforestation or conversion, afforestation or reforestation, improved land management and livestock practices, new harvested wood product technologies, and bioenergy (Canadell and Raupach 2008; Luyssaert et al., 2014; Van Winkle et al., 2017). However, additional future land-use goals (e.g., food, fiber, and feed production; wildlife management; and other ecosystem services) must be reconciled with strategies for increasing land carbon uptake.
19.3.3 Climate
Since the Third National Climate Assessment (Melillo et al., 2014), new observations and research have increased understanding of past, current, and projected changes in climate, both globally and within North America. The current state of knowledge in climate trends and projections for the United States is summarized in the Climate Science Special Report (CSSR; USGCRP 2017a). This section summarizes some of these key findings. For more detailed information about the observational evidence and mechanistic explanations for past and projected climate changes, see the full CSSR (USGCRP 2017a).
Global average annual temperatures over both land and ocean have increased by 1.8°F from 1901 to 2016. Similar warming has been observed over the conterminous United States, with the greatest temperature increase (more than 1.5°F in the past 30 years) seen in Alaska, the Northwest, Southwest, and northern Great Plains (USGCRP 2017a). For example, over the past 50 years, the average annual temperature across Alaska has increased at a rate more than twice as fast as the global average. Multiple lines of evidence point to human-driven activity as the dominant cause of the observed warming (USGCRP 2017a). Average annual temperatures across the United States are projected to continue to rise throughout this century, with near-term increases of at least 2.5°F over the coming decades. Much larger increases in temperature (5.8°F to 11.9°F) are projected in the United States by late century under higher human-driven emissions scenarios (USGCRP 2017a).
As the global climate warms, high-latitude regions (e.g., Alaska and Canada) are projected to become wetter, while the subtropical zone (e.g., southern United States) is projected to become drier. In addition, the tropical belt may widen while the subtropical region may shift poleward (Seidel et al., 2008). Within the United States, projected changes in seasonal average precipitation vary and depend on location and season (USGCRP 2017a). Northern parts of the country are expected to become wetter in the winter and spring as global temperatures increase. In the near term, this precipitation increase is likely to fall as snow. However, as average annual temperature continues to rise and conditions become too warm for snow production, wintertime precipitation will mostly fall as rain (USGCRP 2017a). Conversely, the southwestern United States is projected to become drier with less winter and springtime precipitation (USGCRP 2017b). In many regions of the country, however, changes in future average seasonal precipitation are smaller than or consistent with natural historical variations (USGCRP 2017a).
Along with changes in average annual temperature and seasonal precipitation, the frequency and intensity of extreme heat and heavy precipitation events are likely to increase (USGCRP 2017a). For example, under “business-as-usual” human-driven emissions scenarios (e.g., RCP8.5), the number of heavy precipitation events is projected to be two to three times greater than the historical average in every region of the United States by the end of the century (USGCRP 2017a). Additionally, the number of extremely warm days is projected to increase significantly, along with an increase in heatwave intensity.
Combined, these changes in annual mean temperature and seasonal precipitation, as well as the frequency and intensity of extreme events, can drive changes in the water cycle and, by extension, water quality and availability. Expected water cycle changes also are likely to lead to more intense and prolonged droughts within the United States, particularly in the Southwest. The increasing occurrence and severity of droughts can affect plant and agricultural productivity, carbon uptake, and the likelihood of disturbance events such as fire.
Projected climate change in North America is expected to affect carbon cycling in both land and ocean ecosystems. On land, the processes of photosynthesis, respiration, and decomposition strongly depend on temperature and moisture availability, and changes in either can alter the balance of carbon uptake and release across ecosystems (Jung et al., 2017; Luo 2007; Zscheischler et al., 2014). Similarly, because of the temperature sensitivity of gas solubility in water, warmer temperatures caused by climate change also affect the rate and extent to which atmospheric CO2 is exchanged with ocean and freshwater systems. Although most physical and biogeochemical drivers of the ocean carbon cycle favor a decrease of global oceanic CO2 uptake due to climate change, there are significant differences in regional responses and their underlying mechanisms (Crueger et al., 2007; Landschützer et al., 2016). Ultimately, it is this balance between the response of land and ocean systems to future climate that will determine the strength and extent of carbon uptake by these systems and whether they might become a net source of CO2 to the atmosphere.
See Full Chapter & References