<b>Butman</b>, D., R. Striegl, S. Stackpoole, P. del Giorgio, Y. Prairie, D. Pilcher, P. Raymond, F. Paz Pellat, and J. Alcocer, 2018: Chapter 14: Inland waters. In Second State of the Carbon Cycle Report (SOCCR2): A Sustained Assessment Report [Cavallaro, N., G. Shrestha, R. Birdsey, M. A. Mayes, R. G. Najjar, S. C. Reed, P. Romero-Lankao, and Z. Zhu (eds.)]. U.S. Global Change Research Program, Washington, DC, USA, pp. 568-595, https://doi.org/10.7930/SOCCR2.2018.Ch14.
Inland Waters
14.1.1 Inland Waters in the Carbon Cycle
This chapter provides an assessment of the total mass of carbon moving from terrestrial ecosystems into inland waters and places this flux in the context of major carbon loss pathways. Also provided is evidence that the estimated carbon flux through inland waters is poorly constrained, highlighting several opportunities to improve future estimates of carbon flows through aquatic ecosystems. Inland waters are defined in this chapter as open-water systems of lakes, reservoirs, nontidal rivers, and streams (see Ch. 13: Terrestrial Wetlands and Ch. 15: Tidal Wetlands and Estuaries for assessments of those ecosystems). Carbon within inland waters includes dissolved and particulate species of inorganic and organic carbon. The separation between dissolved and particulate carbon is operational and reflects, in general, a filtration through a 0.2- to 0.7-micrometer (µm) filter, where the larger material is considered particulate within freshwater environments. Using this definition classifies inland water carbon as dissolved organic carbon (DOC), dissolved inorganic carbon (DIC), particulate organic carbon (POC), and particulate inorganic carbon (PIC). Included within the DIC pool is dissolved carbon dioxide (CO2).
Lakes, ponds, streams, rivers, and reservoirs are both the intermediate environments that transport, sequester, and transform carbon before it reaches coastal environments (Liu et al., 2010) and dynamic ecosystems that sustain primary and secondary production supporting aquatic metabolism and complex food webs. Inland waters comprise a small fraction of Earth’s surface yet play a critical role in the global carbon cycle (Battin et al., 2009b; Butman et al., 2016; Cole et al., 2007; Findlay and Sinsabaugh 2003; Regnier et al., 2013; Tranvik et al., 2009). Over geological timescales, inland waters control long-term sequestration of atmospheric CO2 through the hydrological transport of inorganic carbon from terrestrial weathering reactions to coastal and marine carbon “sinks” as dissolved carbonate species (Berner 2004). Today, through anthropogenic land-use change, industrialization, damming, and changes in climate, the ecosystem structure and function of inland waters are changing rapidly. However, as presented in this chapter, the flows of carbon through inland waters represent a combination of both natural and anthropogenic influences, (see Figure 14.1) as the science has not achieved a comprehensive ability to differentiate anthropogenic fluxes from natural fluxes. In the context of the North American carbon cycle, the science discussed herein addresses current understanding of freshwater carbon cycling from the period since 1990 and highlights the need to focus on better identifying human impacts on the transport and biogeochemical cycling of carbon by inland waters.
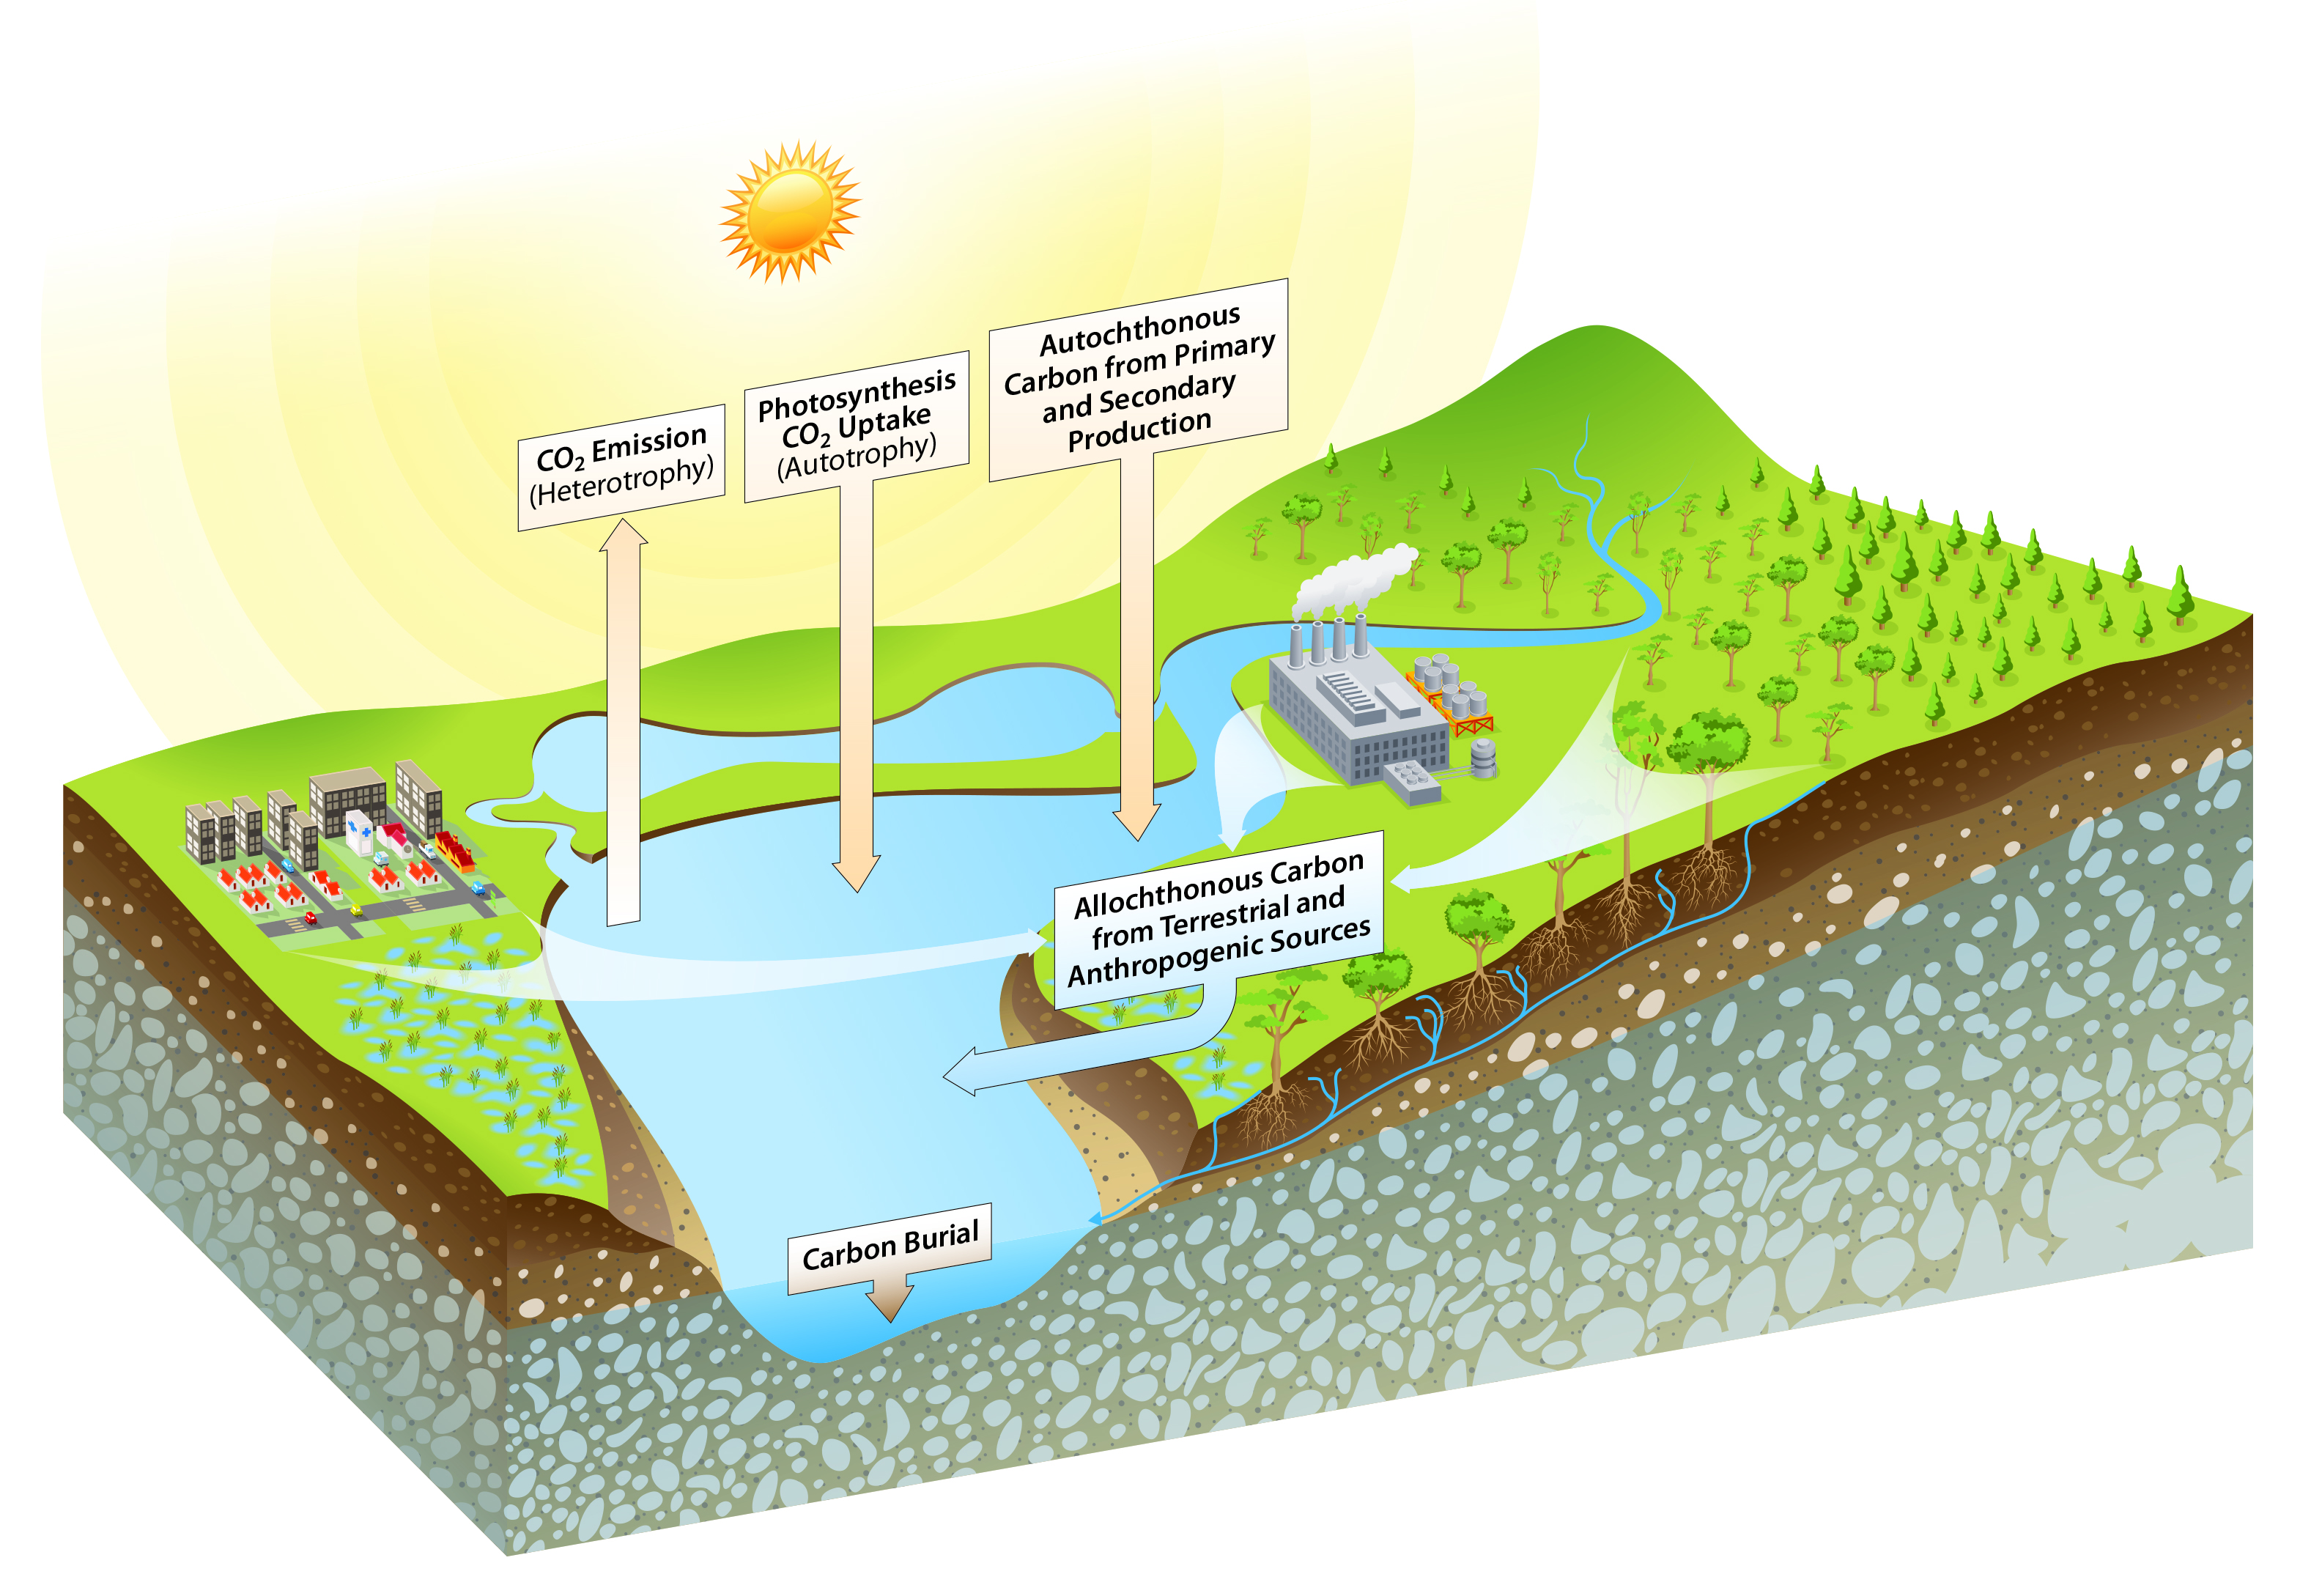
Figure 14.1: Carbon Flux Pathways in Aquatic Environments
14.1.2 Defining Carbon Within Inland Waters
Inland aquatic ecosystems are sites for biogeochemical carbon reactions that result in an exchange of particulate and dissolved carbon, CO2, and methane (CH4) among aquatic environments, terrestrial environments, and the atmosphere (Butman and Raymond 2011; Findlay and Sinsabaugh 2003; McCallister and del Giorgio 2012; McDonald et al., 2013; Raymond et al., 2013; Striegl et al., 2012). Carbon species in freshwaters originate from varied sources. Aquatic organic carbon consists of all organic molecules transported to or produced within inland waters and their various organic decomposition products. Inland water organic carbon originates from direct inputs from wastewater, surface runoff (typically, the largest contributor), groundwater, primary and secondary production within the aquatic environment, and atmospheric deposition. Inorganic carbon includes PIC and DIC. The mass balance of DIC in freshwater ecosystems is regulated by biological processes such as photosynthesis (consuming CO2) and respiration (producing CO2), along with air-water CO2 exchange and geochemical reactions, including carbonate precipitation and dissolution (Tobias and Bohlke 2011).
Rivers are conduits that deliver carbon to the coast while maintaining strong CO2 and CH4 fluxes to or from the atmosphere (Cole et al., 2007; Stanley et al., 2016; Tranvik et al., 2009). Lakes and reservoirs are sinks of particulate carbon in sediments and also process and remineralize organic carbon to CO2 and CH4 gases that are then emitted to the atmosphere (Clow et al., 2015; Teodoru et al., 2012). Autotrophic carbon production in nutrient-enriched lakes and reservoirs can cause inland water bodies to be a sink of atmospheric CO2 (Clow et al., 2015; Tranvik et al., 2009). The entrapment of sediments by dams can facilitate aerobic and anaerobic organic carbon oxidation and thus the net production of CO2 and CH4 that escape to the atmosphere, with important implications to climate forcing (Crawford and Stanley 2016; Deemer et al., 2016). However, the balances among primary production, total respiration, carbon burial, and carbon gas emission in lakes and reservoirs remain poorly quantified (Arntzen et al., 2013; Teodoru et al., 2012).
Of the roughly 2.9 petagrams of carbon (Pg C) per year that enter inland waters globally, most are emitted as CO2 across the air-water interface (Butman et al., 2016; Raymond et al., 2013) before ever reaching the ocean (Le Quéré et al., 2014). Recent estimates suggest that inland water surface carbon emissions may exceed 2 Pg C per year (Sawakuchi et al., 2017). In contrast, rivers export to the coastal ocean 0.4 Pg C per year of DIC and between 0.2 and 0.43 Pg C per year of organic carbon (Le Quéré et al., 2014; Ludwig et al., 1996; Raymond et al., 2013; Schlünz and Schneider 2000). However, the biogeochemical processes that produce and sustain both atmospheric carbon emissions and lateral fluxes remain unclear because physical and biological processes vary significantly across freshwater systems and along the hydrological continuum (see Figure 14.2; Battin et al., 2008; Hotchkiss et al., 2015).
Figure 14.2: Carbon Fluxes from Inland Waters of the Conterminous United States and Alaska
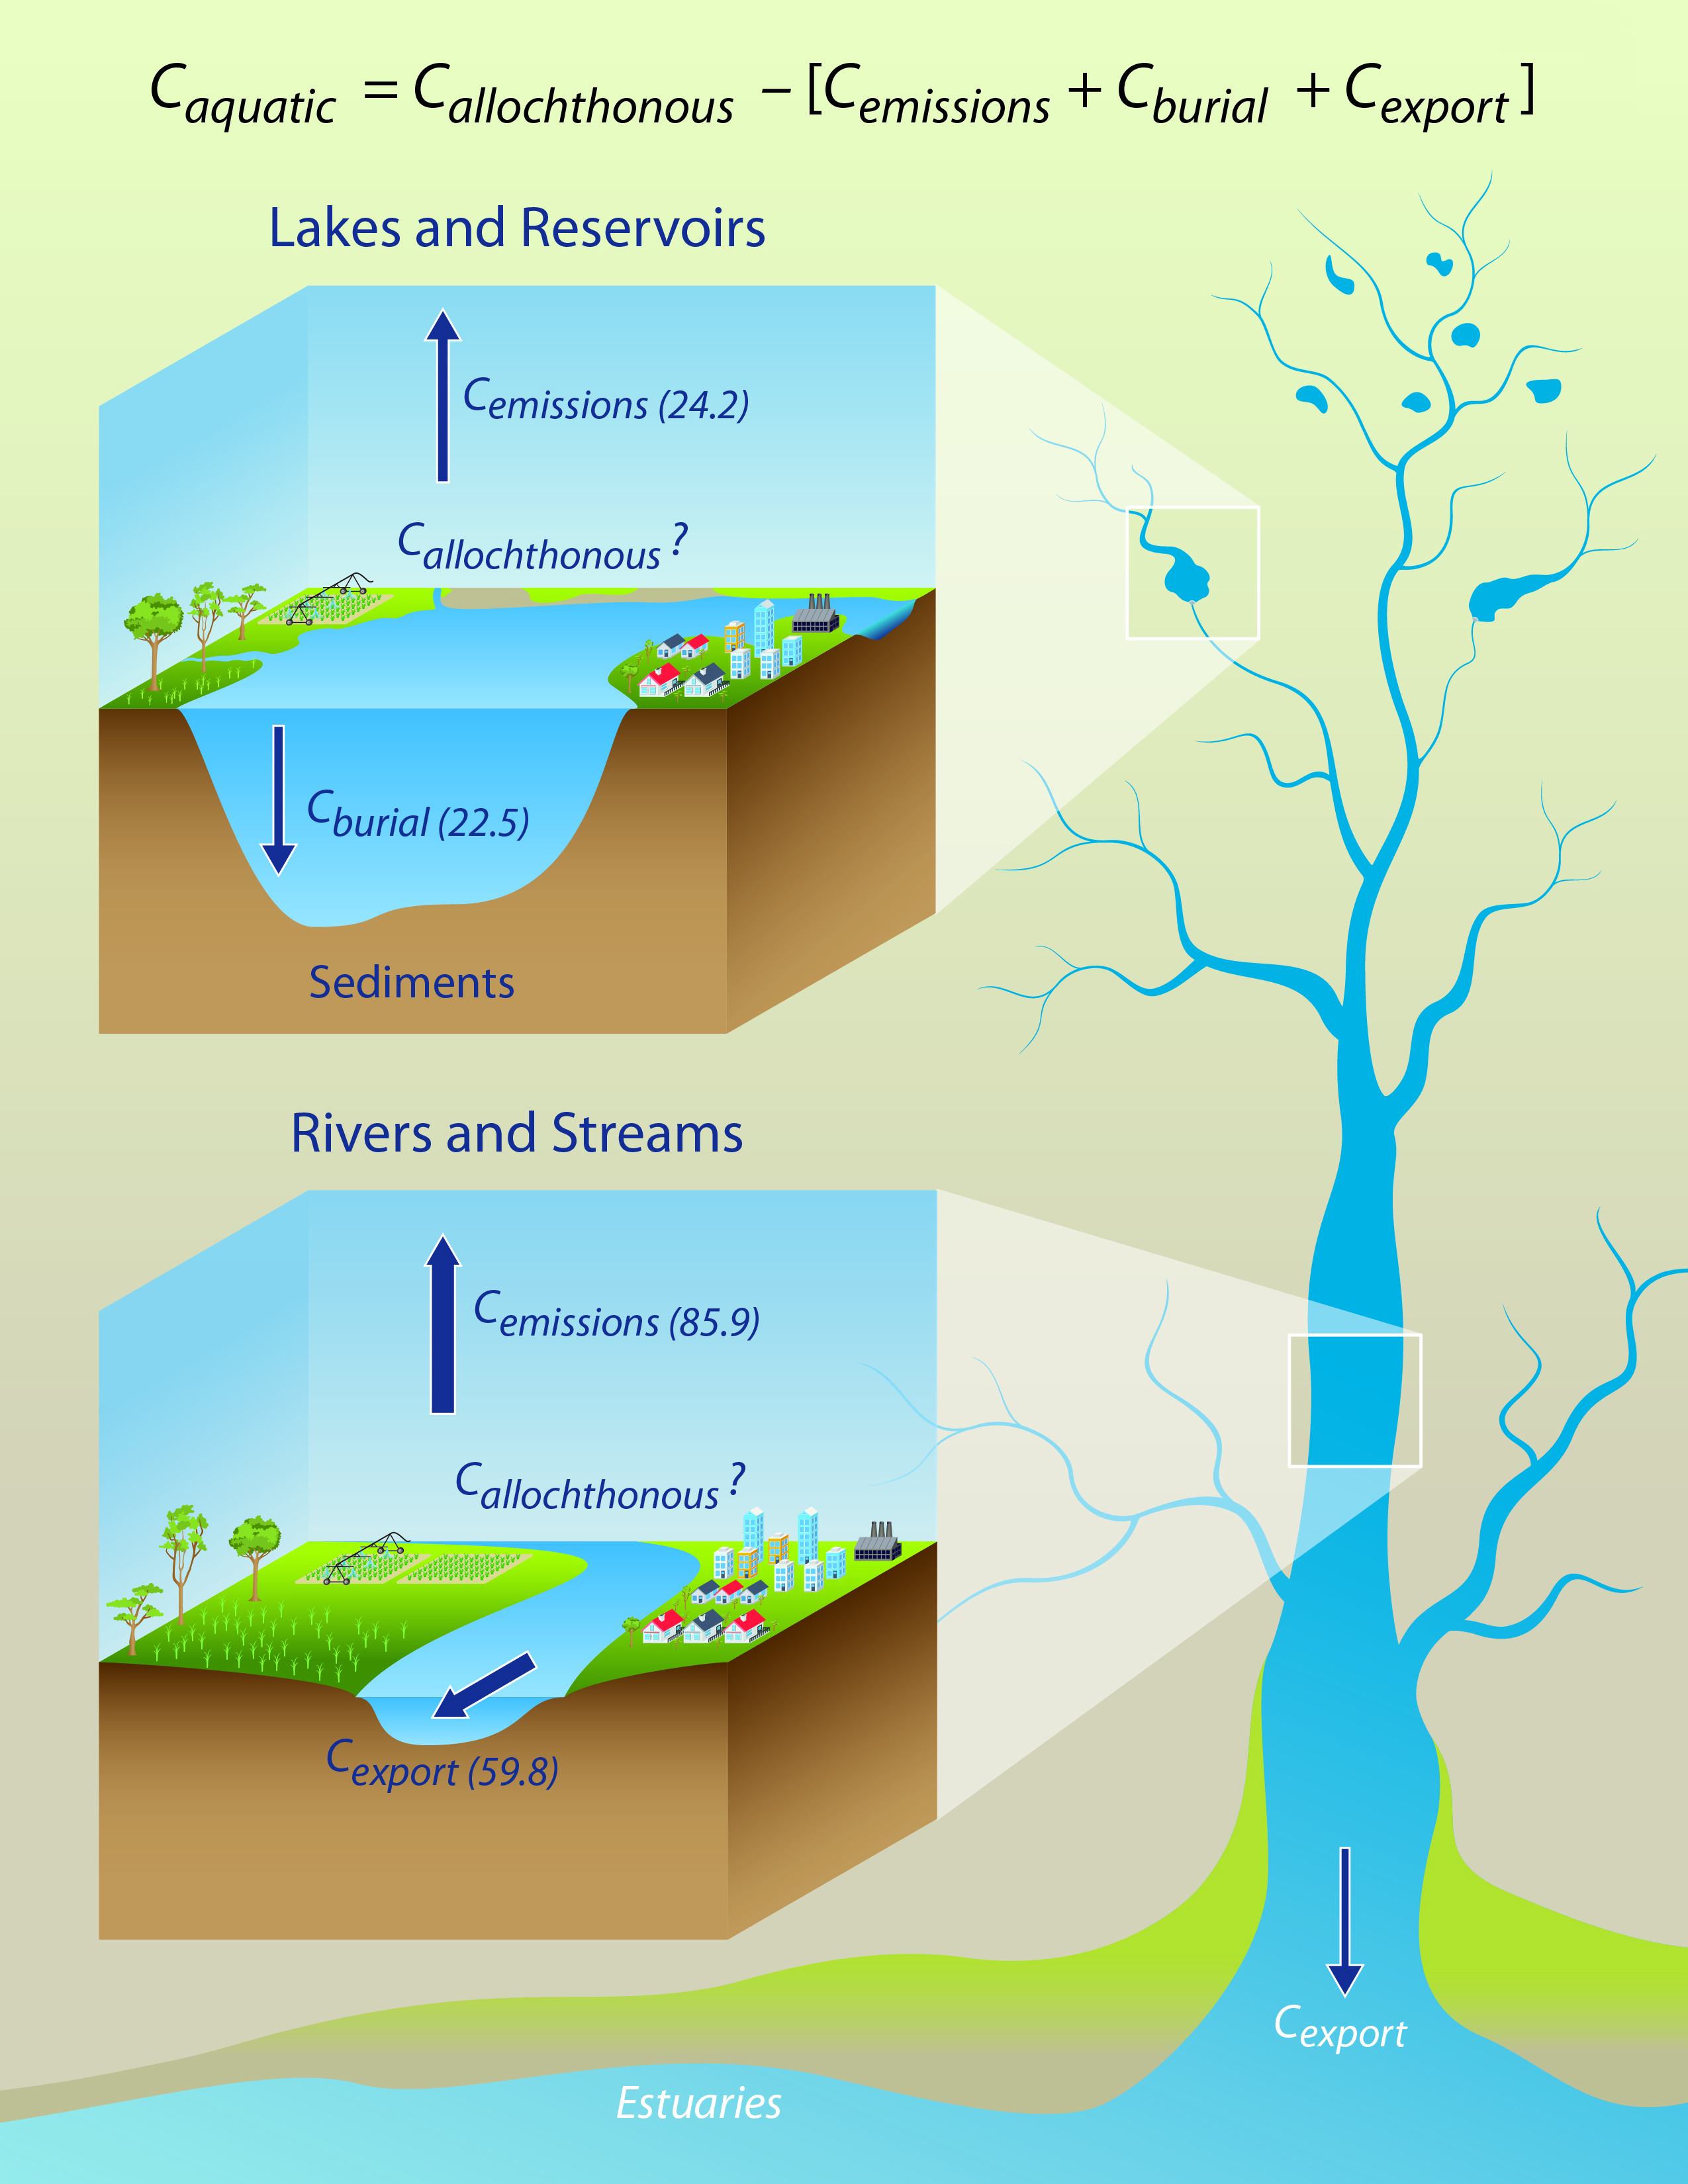
Carbon fluxes in inland waters are considered in Equation 14.1 in the context of a simple mass balance approach.
Equation 14.1
Caquatic = Callochthonous – [Cemissions + Cburial + Cexport]
The dimensions of this equation are mass carbon (C) per unit time (e.g., Tg C per year) or mass C per unit area per unit time (e.g., units of g C per m2 per year), where Caquatic represents the change of carbon stock in inland waters, Callochthonous is the input of allochthonous carbon into inland waters from land, Cemissions is the total emissions of CO2 and CH4 from the water surface, Cburial is the total burial of POC in lakes and reservoirs, and Cexport is the total export of inorganic and organic carbon to coastal systems. For this analysis, estimates of CH4 emissions are not provided. Furthermore, changes in carbon stocks are assumed to be zero (i.e., assumption of steady state), which is reasonable over long timescales because of the rapid movement and turnover of carbon in lotic (flowing) and lentic (still) ecosystems. Hence, in this chapter, the flux of carbon from inland waters (the terms within brackets in Equation 14.1) is assumed to be equivalent to the flux of carbon to inland waters, Cterrestrial. The use of this equation implies a fully constrained hydrological system. Adjustments have been made to U.S. flux estimates for carbon originating outside national boundaries.
14.1.3 Inland Waters of the United States and North America
The conterminous United States (CONUS) and Alaska contain over 45 million individual lakes and ponds greater than 0.001 km2. Excluding the Laurentian Great Lakes (see Section 14.1.4), these lakes and ponds cover an estimated 179,000 to 183,000 km2 (Butman et al., 2016; Clow et al., 2015; McDonald et al., 2012; Zhu and McGuire 2016) and include more than 87,000 reservoir systems (Clow et al., 2015; Hadjerioua et al., 2012). Streams and rivers in the United States and Alaska are estimated to cover 36,722 km2 (Butman et al., 2016; Stackpoole et al., 2017b; Zhu and McGuire 2016). Combined, inland waters (except the Great Lakes) cover approximately 1.9% of CONUS and 3.9% of Alaska. Although 30-m resolution map products include inland freshwater bodies >0.005 km2 (Feng et al., 2015), large-scale water-surface map products currently do not capture smaller-scale water bodies (<0.001 km2), which have been linked with higher greenhouse gas (GHG) emissions rates (Holgerson and Raymond 2016). All stream and river areas in this chapter are estimated by scaling the relationships among discharge and water velocity, water depth, and stream or river width (Melching and Flores 1999; Raymond et al., 2012). Freshwater discharge to the coast of North America is dominated by the Mississippi, St. Lawrence, Mackenzie, Columbia, and Yukon rivers, which have a combined discharge of 1,500 km3 per year, about half the total freshwater runoff to the coast of North America (Dai et al., 2009).
The boreal area of North America constitutes one of the most lake-rich regions in the world. In Canada alone, there are an estimated 3.3 million water bodies greater than 0.01 km2 in surface area and another 5.4 million in the smallest size category (<0.001 km2). All Canadian water bodies (excluding the Great Lakes) are estimated to cover 884,000 km2, or about 9% of the country’s surface. In some large regions of northern Quebec and Ontario, inland waters cover up to 25% of the surface area. In Mexico, surface waters (excluding fluvial systems) are estimated to cover 25,769 km2, or 1% of the country’s surface, and the total length of streams and rivers is estimated to be 633,000 km (INEGI 2017). The watersheds of Mexico’s 33 main rivers cover 565,128 km2, and freshwater flow is dominated by the Grijalva and Usumancinta rivers, which drain to the Gulf of Mexico.
There are 87,359 registered dams in the United States (USACE 2016), more than 10,000 dams in Canada (Canadian Dam Association 2018), and 5,163 dams and reservoirs holding approximately 150 km3 of water in Mexico (CONAGUA 2015). Dam construction in recent years has increased the volume of retained water by about 600% to 700% globally, tripling the transit time of water from land to sea (Vörösmarty et al., 2009). This trend is expected to continue globally with several large damming projects underway (Zarfl et al., 2014). Within the United States, nearly 2,500 dams provide 78 gigawatts (GW) of power; up to 12 GW potentially could be added by leveraging the installed dam capacity currently not being used for energy production (Hadjerioua et al., 2012). The U.S. Pacific Northwest and Southeast have the highest potential for future power generation (Hadjerioua et al., 2012). Reservoirs formed through the damming of rivers alter the natural flux of carbon and the dispersal of sediments (Dean and Gorham 1998), increasing the likelihood that organic carbon will be remineralized to CH4 and CO2 compared to unrestricted conditions (Deemer et al., 2016; Rudd et al., 1993; Teodoru et al., 2012). Thus, the conversion of meandering rivers to a series of reservoirs potentially reduces the transport of carbon to the coast (Hedges et al., 1997), and it may increase the flux of CO2 and CH4 to the atmosphere (Deemer et al., 2016; Tranvik et al., 2009; Tremblay et al., 2005).
14.1.4 The Great Lakes
The Laurentian Great Lakes vary between being considered as part of the coastal domain or as inland waters because each of the five lakes is distinct in size and volume. In this chapter, these lakes are considered as inland waters, containing about 18% of the world’s supply of surface fresh liquid water and 84% of North America’s supply (www.epa.gov/greatlakes/great-lakes-facts-and-figures). Although interconnected, the lakes differ substantially in their physical, biological, and chemical characteristics. The largest, Lake Superior, has an average depth of 147 m and a water retention time of nearly 200 years, while the smallest, Lake Erie, has an average depth of 19 m and a retention time of about 3 years. Productivity ranges from oligotrophic in Lake Superior to eutrophic in Lake Erie. Water chemistry also varies substantially among the lakes, with mean alkalinity ranging from 840 micromoles (µmol) per kg in Lake Superior to 2,181 µmol per kg in Lake Michigan (Phillips et al., 2015).
Despite the large size of the Great Lakes, knowledge of their lakewide carbon cycle is relatively limited. Recent observational and modeling studies have helped elucidate some of the physical and biogeochemical processes governing the seasonal carbon cycle (Atilla et al., 2011; Bennington et al., 2012; Pilcher et al., 2015), but current CO2 emissions estimates are poorly constrained and are excluded from regional carbon budgets (McDonald et al., 2013). Observations of surface partial pressure of CO2 (pCO2) suggest that the Great Lakes are in near equilibrium with the atmosphere on annual timescales but vary seasonally between periods of significant undersaturation and supersaturation (Atilla et al., 2011; Karim et al., 2011; Shao et al., 2015). Autochthonous carbon from spring and summer productivity is respired at depth and ventilated back to the atmosphere during strong vertical mixing in late fall and winter, limiting burial (Pilcher et al., 2015). However, even highly productive regions, such as western Lake Erie, have been shown to be net sources of carbon to the atmosphere (Shao et al., 2015). Additional data are required to better understand the lakewide response to increasing atmospheric CO2 and any resulting, decreasing trend in lake pH (Phillips et al., 2015). Further uncertainty arises from a long history of anthropogenic stressors that have significantly affected lakewide ecology and ecosystem services (Allan et al., 2013). A recent example is the proliferation of invasive Dreissena mussels throughout most of the Great Lakes. Filter feeding from these mussels coincides with substantial reductions in aquatic primary productivity, which probably has altered the lakewide food web and resulted in unknown impacts to the carbon cycle (Evans et al., 2011; Madenjian et al., 2010).
See Full Chapter & References