<b>Kolka</b>, R., C. <b>Trettin</b>, W. Tang, K. Krauss, S. Bansal, J. Drexler, K. Wickland, R. Chimner, D. Hogan, E. J. Pindilli, B. Benscoter, B. Tangen, E. Kane, S. Bridgham, and C. Richardson, 2018: Chapter 13: Terrestrial wetlands. In Second State of the Carbon Cycle Report (SOCCR2): A Sustained Assessment Report [Cavallaro, N., G. Shrestha, R. Birdsey, M. A. Mayes, R. G. Najjar, S. C. Reed, P. Romero-Lankao, and Z. Zhu (eds.)]. U.S. Global Change Research Program, Washington, DC, USA, pp. 507-567, https://doi.org/10.7930/ SOCCR2.2018.Ch13.
Terrestrial Wetlands
Prepared by Carl Trettin,1 Wenwu Tang,2 and Steven Campbell3
1USDA Forest Service; 2University of North Carolina, Charlotte; 3USDA Natural Resources Conservation Service
13A.1 Introduction
This appendix provides the methodologies and data used to estimate the area and carbon pools of terrestrial wetlands in North America. Since the First State of the Carbon Cycle Report (SOCCR1; CCSP 2007), several developed geospatial databases have provided the opportunity to improve the estimation of carbon pools beyond what is feasible using area density factors. The development of the Gridded Soil Survey Geographic (gSSURGO) database by the U.S. Department of Agriculture’s (USDA) Natural Resources Conservation Service (NRCS) was a particularly important advancement, availing gridded soil survey information for the United States and Puerto Rico. Similarly, the USDA Forest Service’s Forest Inventory and Analysis (FIA) database uses forest biomass data for the United States, thereby facilitating its incorporation into carbon pool assessments. Sections 13A.2–13A.6 detail the data and methods used to obtain the reported wetland area and carbon pools.
13A.2 Conterminous United States
13A.2.1 Approach
The U.S. Fish and Wildlife Service’s (USFWS) National Wetlands Inventory (NWI) was used as the basis for identifying terrestrial (i.e., nontidal) freshwater wetlands within the conterminous United States (CONUS) and for distinguishing between forested and nonforested wetlands. Subsequently, geospatial databases were used to calculate the carbon pools in soils and forests. Specifically, the gSSURGO database was used to calculate soil carbon, and the FIA database was used to calculate forest carbon based on the reported biomass. A carbon pool density factor was used for the nonforest vegetation biomass because an appropriate geospatial database was not available.
13A.2.2 Data
The datasets used for analyses of the wetland area and carbon pool computations are summarized in Table 13A.1.
Table 13A.1 Source Datasets
| Dataset | Year | Publisher | Download Link |
|---|---|---|---|
| Gridded Soil Survey Geographic (gSSURGO) | 2016 | U.S. Fish and Wildlife Service | URL |
| National Wetlands Inventory (NWI) | 2015 | U.S. Department of Agriculture (USDA) Natural Resources Conservation Service (NRCS) | URL |
| Forest Inventory Analysis (FIA) Forest Biomass | 2003 | USDA Forest Service FIA | URL |
| Value-Added Look Up Table Database | 2016 | USDA NRCS | URL |
| Cartographic Boundary | 2015 | U.S. Census Bureau | URL |
13A.2.3 Results
Wetland Area
According to NWI data, there are 395,197 km2 of terrestrial freshwater wetlands in CONUS, 54% of which are forested and 46% nonforested (see Table 13A.2). The estimate of forested freshwater wetlands is within 2% of the most recent NWI report; the total area of freshwater forested wetlands is calculated as 213,914 km2, compared with 208,912 km2 for 2009 from Dahl (2011). This area is smaller than the wetland area used in SOCCR1 (405,670 km2; CCSP 2007) because that report also included tidal wetlands. Mineral soils compose 79% of the terrestrial wetlands, with 21% being organic or peat soils (see Table 13A.2). The distribution of wetlands among soil (organic and mineral) and vegetation (forest and nonforest) categories among states is presented in Figure 13A.1.
Table 13A.2. Area of Forested and Nonforested Terrestrial Wetland and Related Soil Types in the United States
| Soil Type | Forested Wetlands (km2) | Nonforested Wetlands (km2) | Total (km2) |
|---|---|---|---|
| Organic Soil | 40,823 | 42,903 | 83,726 |
| Mineral Soil | 173,091 | 138,381 | 311,472 |
| Total | 213,914 | 181,283 | 395,197 |
Figure 13A.1: Areal Distribution Among U.S. States of the Four Categories of Freshwater Terrestrial Wetlands

The accuracy of the NWI data is considered to be over 90% for large wetlands (i.e., those > 1 hectare); uncertainties increase with smaller wetlands (Nichols 1994). Independent field-based studies also have been conducted to evaluate the accuracy of the NWI data for wetland mapping. The reported accuracies ranged from over 90% of overall accuracy in Michigan, Maine, and Massachusetts (see Kudray and Gale 2000; Nichols 1994; Swartwout et al., 1981) to underestimation of wetland area by 39% in Vermont (see Morrissey and Sweeney 2006). With these issues considered, the NWI data are recognized as a reasonable source for estimating wetland area, particularly at large spatial extents, and thus are the source for national-level reporting.
Wetland Carbon Stock Estimation
Carbon stocks were calculated based on soil carbon content calculated from gSSURGO, forest biomass extracted from the FIA database, and a biomass density factor for nonforest vegetation. Forest vegetation consists of a carbon stock of about 0.878 petagrams of carbon (Pg C), with 79% occurring on mineral soils; nonforest vegetation contributed approximately 0.093 Pg C (see Table 13A.3). Integrating forest biomass and soil carbon pools yields approximately 13.5 Pg C in terrestrial wetlands (see Table 13A.4). The breakdown of carbon within forested and nonforested wetlands and of mineral and organic soils by state is summarized in Table 13A.4.
Table 13A.3. Carbon Stock in Forest and Nonforest Biomass Within Organic and Mineral Soil Terrestrial Wetlandsa
| Soil Type | Forest Carbon Pool (Pg C) | Nonforest Carbon Pool (Pg C) |
|---|---|---|
| Organic Soil | 0.185 | 0.022 |
| Mineral Soil | 0.693 | 0.071 |
| Total | 0.878 | 0.093 |
Notes
a Carbon stocks are measured in petagrams of carbon (Pg C) within the conterminous United States.
Table 13A.4. Carbon Stocks Within Organic and Mineral Soil, and Forested and Nonforested Freshwater Wetlandsa
| Soil Type | Forest Wetlands (Pg C) | Nonforested Wetlands (Pg C) | Total |
|---|---|---|---|
| Organic Soil | 4.45 | 3.88 | 8.34 |
| Mineral Soil | 3.26 | 1.94 | 5.21 |
| Total | 7.71 | 5.82 | 13.55 |
Notes
a Carbon stocks are measured in petagrams of carbon (Pg C) within the conterminous United States.
13A.3 Alaska
13A.3.1 Approach
The NWI and traditional soil surveys of Alaska are not available for the entire state. Fortunately, Clewley et al. (2015) recently published an inventory of wetlands based on remote-sensing data that used the Cowardin Classification system for representing the distribution of wetland types. Similarly, NRCS has produced a gSSURGO dataset for Alaska. Accordingly, those datasets were used as the basis for estimating the terrestrial wetland categories and carbon stocks following the same general approach used for CONUS. The combination of the wetland and carbon stock assessment with the distribution of frozen wetlands is considered to provide a comprehensive assessment of wetlands for the state.
13A.3.2 Data
Table 13A.5 presents the principal datasets used in this study that include information on soil, wetlands, soil organic carbon, permafrost, and elevation.
Table 13A.5. Datasets Used to Estimate the Distribution and Carbon Stocks of Alaskan Terrestrial Wetlandsa–b
| Dataset | Year | Publisher | Download Link |
|---|---|---|---|
| Alaska Wetlands (Clewley et al., 2015) | 2007 | Alaska Satellite Facility | URL |
| STATSGO2 | 2014 | U.S. Department of Agriculture (USDA) Natural Resources Conservation Service | URL |
| Organic Soil Probability | 2016 | U.S. Geological Survey (USGS) LandCarbon | URL |
| Forest Biomass | 2002 | USDA Forest Service Forest Inventory and Analysis | URL |
| Probability of Near Surface 1-m Permafrost | 2015 | USGSa | URL |
| STATSGO Depth of Permafrost | 2012 | USGSa | URL |
| STATSGO Permafrost Soil | 2014 | USDA Natural Resources Conservation Serviceb | URL |
| Alaska State Boundary | 2016 | U.S. Census Bureau | URL |
| Elevation | 1996 | USGS | URL |
Notes
a Provided by Neal Pastick, USGS.
b Provided by Steve Campbell, USDA Natural Resources Conservation Service.
13A.3.3 Results
Wetland Area
The total area of freshwater wetlands in Alaska, based on the Clewley et al. (2015) database, is 579,645 km2 (see Table 13A.6). The wetland data were classified from ALOS PALSAR2 remote-sensing data using a random forest-based classifier. The data were processed using the adjustment factor employed by Clewley et al. (2015) to calculate the total area of freshwater wetlands, and data that overlapped into Canada were excluded. The overall accuracy of the classification is 84.5% for distinguishing specific wetland types and 94.7% for distinguishing wetlands with uplands (Clewley et al., 2015). The NWI class was used to aggregate the areas into forested and nonforested types.
Table 13A.6. Area of Four Terrestrial Wetland Types in Alaska
| Soil Type | Forested (km2) | Nonforested (km2) | Total (km2) |
|---|---|---|---|
| Organic | 9,947 | 97,111 | 107,057 |
| Mineral | 54,858 | 417,729 | 472,587 |
| Total | 64,805 | 514,840 | 579,645 |
Also calculated was the total area of wetlands in Alaska from STATSGO2 data using the percent in hydric soil attribute (“hydric_pct”; i.e., the percent in hydric soil). The total area is 587,143.9 km2 based on the STATSGO2 percentage of hydric soils, which is very close to that provided by the Clewley et al. (2015) dataset.
Soil organic carbon data from STATSGO2 were employed to estimate the area of organic soils in Alaska, using the variable named “hydric_org_pct” (i.e., the percent in hydric organic soil) as the basis. This variable was multiplied by the area of map units (polygons) in the STATSGO2 dataset to obtain the area of peatland within each map unit. The total area of peatlands estimated from STATSGO2 using the hydric organic soil attribute is 107,057 km2.
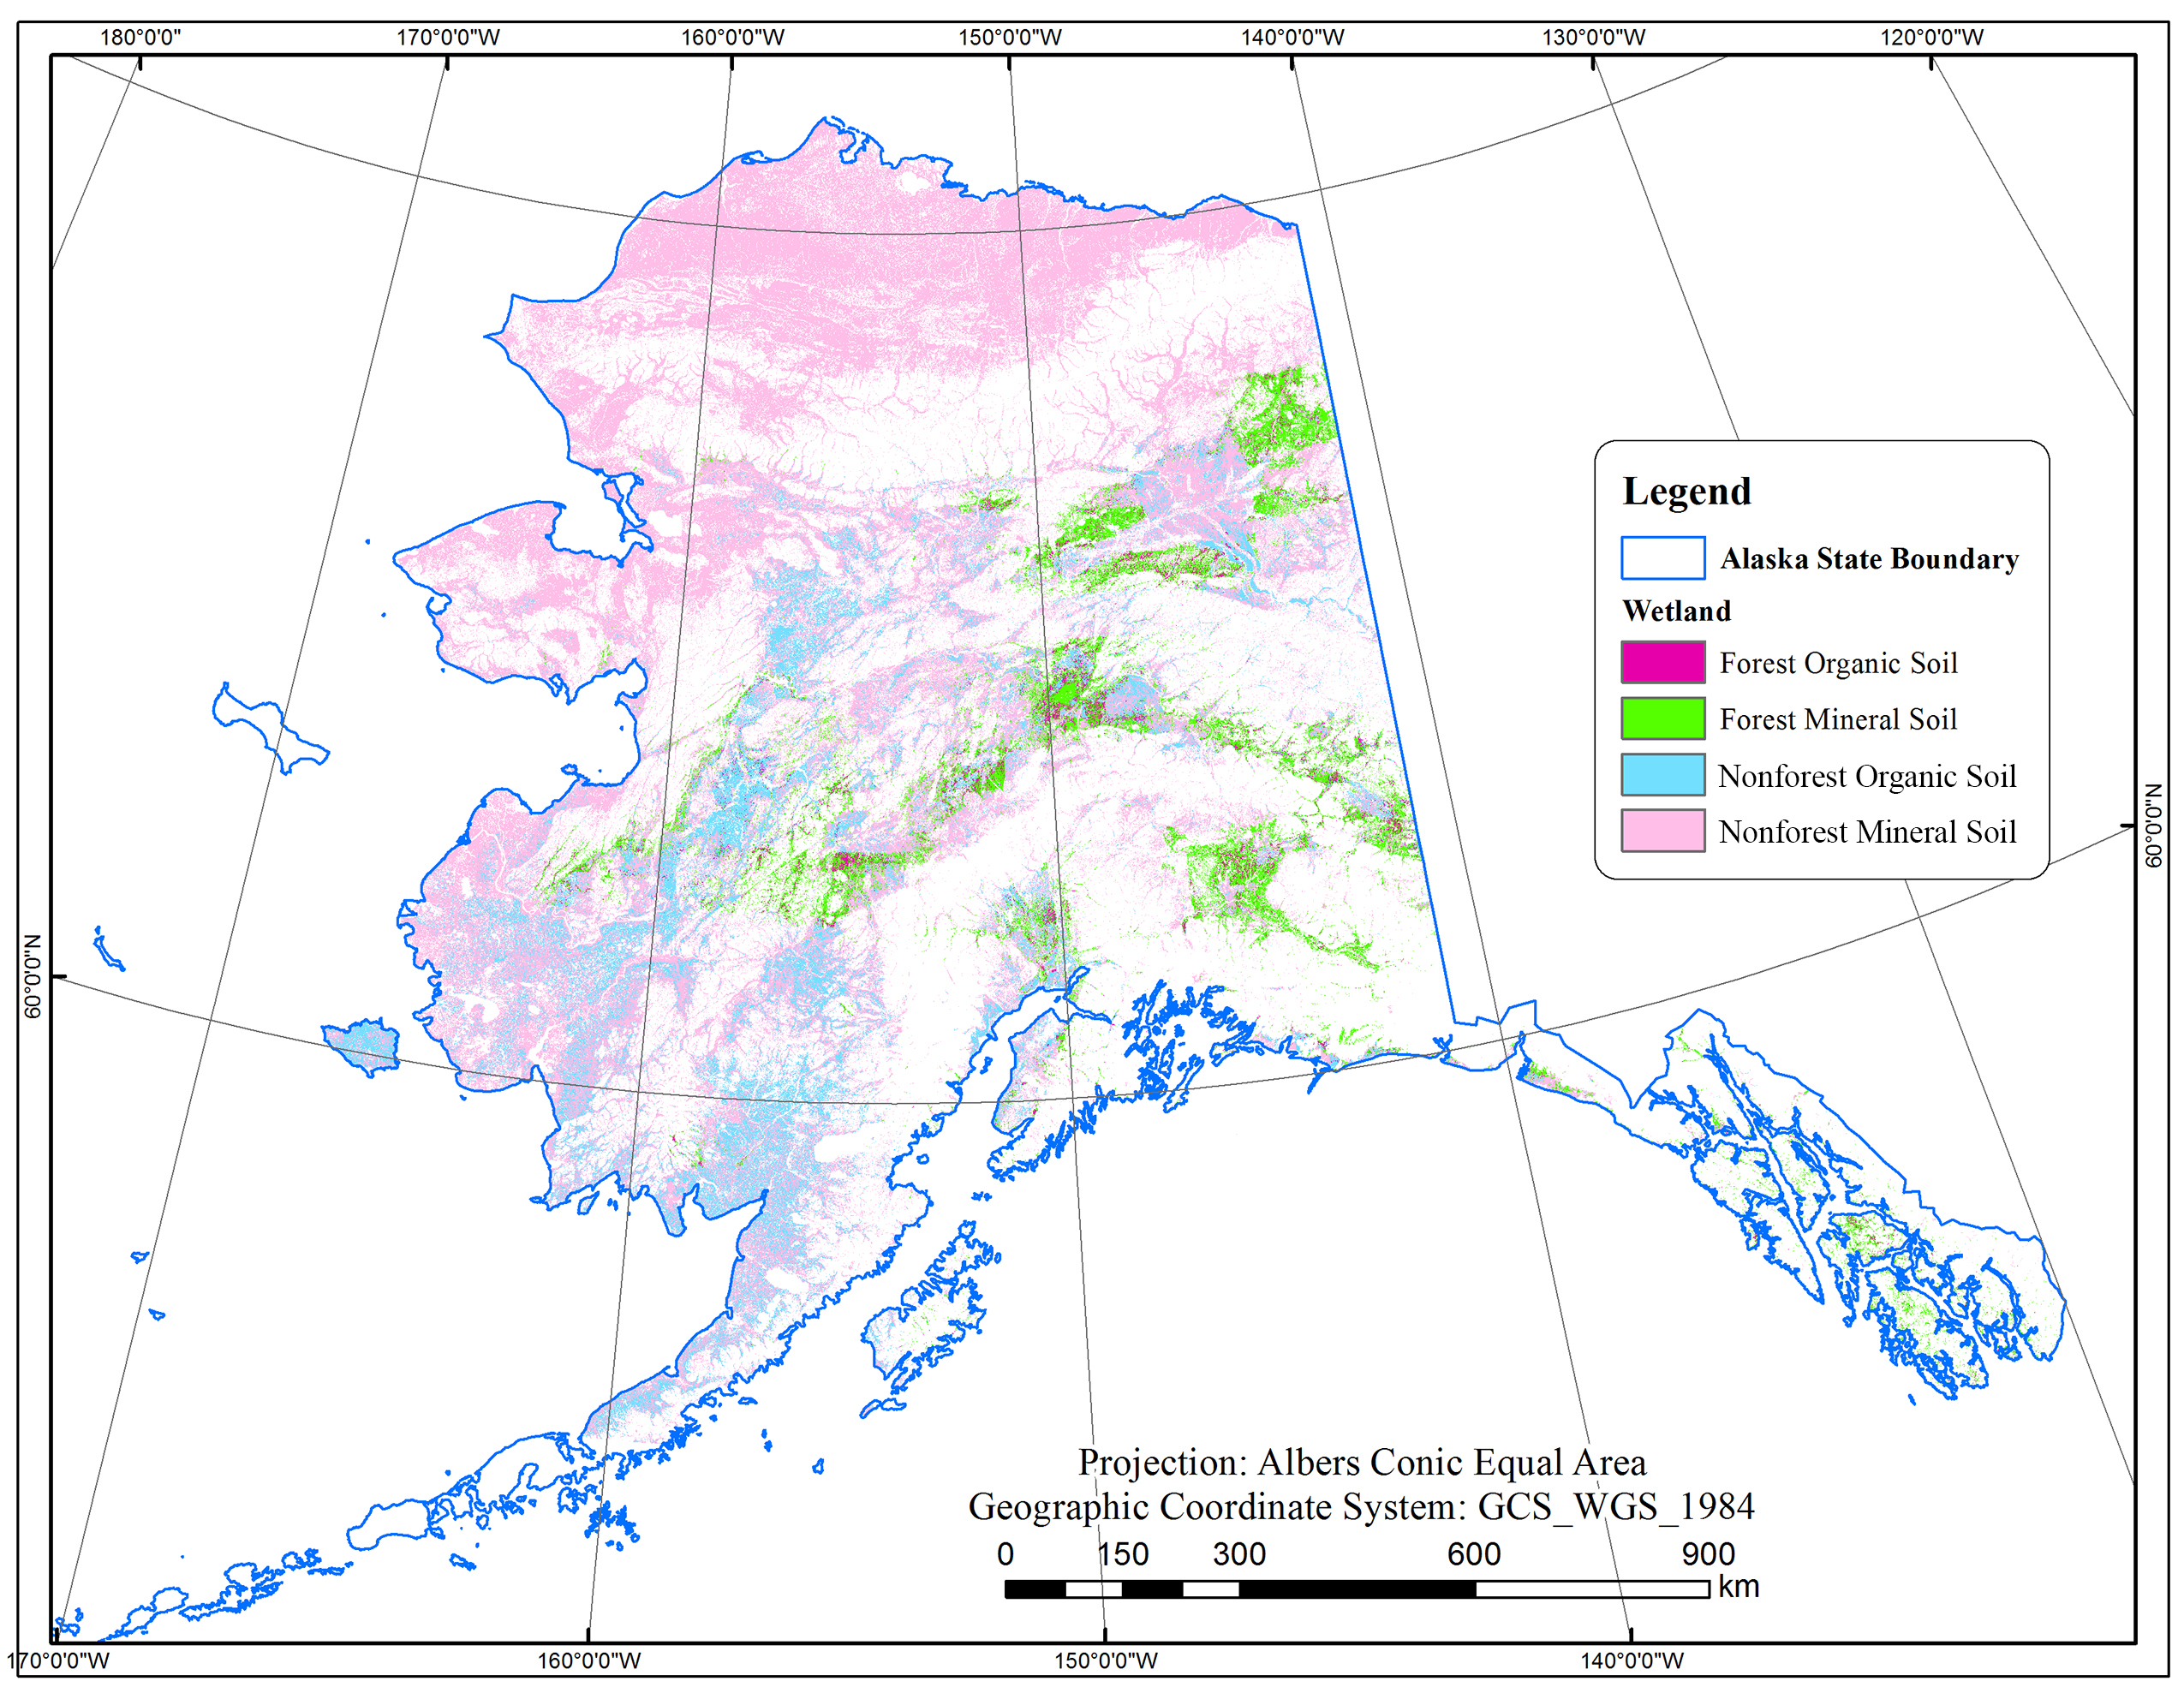
Incorporating the distribution of organic soils into the overlay analyses yielded the distribution and area of the four wetland categories (see Figure 13A.2). The total area of the four wetland categories of freshwater wetlands in Alaska are summarized in Table 13A.6.
Figure 13A.2: Areal Distribution in Alaska of the Four Categories of Terrestrial Wetlands
Assessing the overlap of wetlands and permafrost areas provided a basis for distinguishing carbon stocks. The use of the USGS probability map of permafrost provided a cut-off threshold of 60% to permafrost occurring within 1 m of the surface (with a 30-m spatial resolution). The resultant area of permafrost is 405,891 km2, compared with 548,503 km2 based on permafrost 2 m in depth from STATSGO2 data. Overlaying the USGS permafrost area with the wetlands shows that the total area of wetlands within the permafrost region is 267,887 km2, which is approximately 46% of the total wetland area. The areas of the four types of freshwater wetlands in Alaska within permafrost or nonpermafrost regions are presented in Table 13A.7.
Table 13A.7. Distribution of Wetland Types Among Areas With and Without Permafrost in Alaska
| Soil Type | Forested (km2) | Nonforested (km2) | Total (km2) | |
|---|---|---|---|---|
| Permafrost | ||||
| Organic | 4,199 | 23,274 | 27,474 | |
| Mineral | 14,696 | 225,716 | 240,413 | |
| Total | 18,895 | 248,991 | 267,887 | |
| Nonpermafrost | ||||
| Organic | 5,747 | 73,836 | 79,584 | |
| Mineral | 40,162 | 192,013 | 232,175 | |
| Total | 45,910 | 265,849 | 311,759 | |
Wetland Carbon Stocks
Ecosystem carbon stocks for the four wetland categories were derived from soil carbon stocks from USDA STATSGO data, biomass carbon data from FIA for forests, and a density factor for nonforested wetlands (see Table 13A.8).
Table 13A.8. Total Carbon Pool of the Four Wetland Categories in Alaskaa
| Soil Type | Forested (km2) | Nonforested (km2) | Total (km2) |
|---|---|---|---|
| Organic | 0.70 | 7.09 | 7.79 |
| Mineral | 2.80 | 21.21 | 24.01 |
| Total | 3.50 | 28.31 | 31.80 |
Notes
a Carbon stocks are measured in petagrams of carbon (Pg C).
Partitioning the ecosystem carbon pools among wetlands in permafrost and nonpermafrost zones is provided in Table 13A.9. Approximately 46% of the wetland carbon pool occurs within the permafrost areas.
Table 13A.9. Ecosystem Carbon Pools in Freshwater Wetlands Occurring in Permafrost and Nonpermafrost Areas in Alaskaa
| Soil Type | Forested (Pg C) | Nonforested (Pg C) | Total Carbon (Pg C) | |
|---|---|---|---|---|
| Permafrost | ||||
| Organic | 0.27 | 1.56 | 1.83 | |
| Mineral | 0.83 | 11.87 | 12.70 | |
| Total | 1.11 | 13.43 | 14.53 | |
| Nonpermafrost | ||||
| Organic | 0.42 | 5.54 | 5.96 | |
| Mineral | 1.97 | 9.34 | 11.30 | |
| Total | 2.39 | 14.88 | 17.26 | |
Notes
a Carbon stocks are measured in petagrams of carbon (Pg C).
13A.4 Puerto Rico
13A.4.1 Approach
The approaches to quantifying the distribution of terrestrial wetlands and the associated carbon pools for Puerto Rico follow those of CONUS, where a suite of datasets was used, including gSSURGO, NWI, Value-Added Look Up Table Dataset, Cartographic Boundary Shapefile, and FIA Forest Biomass Dataset. An overlay analysis was conducted between NWI and gSSURGO to identify vegetation and soil types for wetlands. Cartographic Boundary identified the boundary of Puerto Rico. The FIA Forest Biomass dataset provided the forest biomass information. Soil Data Development Tools for ArcGIS were used to extract the soil class of freshwater wetlands.
13A.4.2 Data
Datasets used in this study are summarized in Table 13A.10.
Table 13A.10. Datasets Used to Estimate Terrestrial Wetland Area and Carbon Pools in Puerto Rico
| Dataset | Year | Provider | Download Link |
|---|---|---|---|
| Gridded Soil Survey Geographic (gSSURGO) | 2016 | U.S. Department of Agriculture (USDA) Natural Resources Conservation Service | URL |
| National Wetlands Inventory | 2010 | U.S. Fish and Wildlife Service | URL |
| Forest Biomass | 2008 | USDA Forest Service’s Forest Inventory and Analysis | URL |
| Puerto Rico Boundary | 2016 | U.S. Census Bureau | URL |
13A.4.3 Results
Wetland Area
The total area of terrestrial wetlands derived from NWI data is 311.4 km2. However, gSSURGO data coverage was missing for approximately 9.8% of the terrestrial wetland area. Distributing the area of missing soil data among the forested and nonforested categories yields the final area of the four wetland categories (see Table 13A.11).
Table 13A.11. Area of Terrestrial Wetland Categories in Puerto Rico
| Soil Type | Forested (km2) | Nonforested (km2) | Total (km2) |
|---|---|---|---|
| Organic Soil | 0.67 | 8.4 | 9.1 |
| Mineral Soil | 49.9 | 252.3 | 302.3 |
| Total | 50.6 | 260.7 | 311.4 |
Ecosystem Carbon Pool
Ecosystem carbon pools, including soil and biomass, for freshwater wetlands in Puerto Rico are summarized in Table 13A.12.
Table 13A.12. Ecosystem Carbon Pools Among the Four Terrestrial Wetland Categories in Puerto Ricoa
| Soil Type | Forested (Pg C) | Nonforested (Pg C) | Total (Pg C) |
|---|---|---|---|
| Organic Soil | 0.000 | 0.001 | 0.001 |
| Mineral Soil | 0.001 | 0.006 | 0.007 |
| Total | 0.001 | 0.007 | 0.008 |
Notes
a Carbon pools are measured in petagrams of carbon (Pg C).
13A.5 Canada
13A.5.1 Approach
Canadian terrestrial freshwater wetlands were estimated based on a combination of spatial data because there was not a single wetland database that could produce estimates of organic and mineral soil wetlands and of forest and nonforest vegetation.
13A.5.2 Data
Datasets in this study are summarized in Table 13A.13.
Table 13A.13. Datasets Used in Canadian Terrestrial Wetland Assessment
| Codea | Dataset | Year | Publisher | Download Link |
|---|---|---|---|---|
| W1 | North America Land Cover | 2010 | U.S. Geological Survey | URL |
| W2 | Global Lakes and Wetlands Database Level 3 (GLWD-3) | 2004 | World Wild Life Organization; The Center for Environmental Systems Research, University of Kassel, Germany | URL |
| S1 | FAO/UNESCOb Digital Soil Map of the World 3.6 | 2007 | Food and Agriculture Organization of the United Nations | URL |
| S2 | Soil Landscapes of Canada 3.2 | 2010 | Agriculture and Agri-Food Canada | URL |
| S3 | Peatlands of Canada | 2005 | Natural Resources Canada | URL |
Notes
a The W1 and W2 and S1, S2, and S3 abbreviations are used in this and subsequent tables to indicate, respectively, the wetlands
and soils datasets outlined here.
b Key: FAO, U.N. Food and Agriculture Organization; UNESCO, United Nations Educational, Scientific and Cultural Organization.
13A.5.3 Results
Organic and Mineral Soil in Forested and Nonforested Terrestrial Wetlands in Canada
Organic and mineral soils for forested and nonforested wetlands were estimated by overlaying land-cover datasets (GLWD and North America land-cover data) with soil datasets (FAO soil data, Peatland Database of Canada, and Soil Landscape of Canada). Those analyses routinely underestimated wetland area compared with estimates in published reports, especially for organic soils (Tarnocai 2006; Warner 2005; see Table 13A.14 for examples of the differences in wetland area based on data sources).
Table 13A.14. Areas of Forested Wetland and Nonforested Terrestrial Wetland and Related Soils in Canadaa–b
| Soil Type | W1 * S1 (km2) | W1 * S2 (km2) | ||||
|---|---|---|---|---|---|---|
| Forested | Nonforested | Total | Forested | Nonforested | Total | |
| Organic | 582,078 | 194,895 | 776,973 | 499,271 | 35,692 | 534,963 |
| Mineral | 215,794 | 40,933 | 256,727 | 360,249 | 21,345 | 381,594 |
| Total | 797,872 | 235,828 | 1,033,700 | 859,520 | 57,037 | 916,557 |
| Soil Type | W2 * S1 (km2) | W2 * S2 (km2) | ||||
| Forested | Nonforested | Total | Forested | Nonforested | Total | |
| Organic | 503,810 | 187,765 | 691,575 | 351,529 | 32,084 | 383,613 |
| Mineral | 161,886 | 38,960 | 200,846 | 193,374 | 17,685 | 211,059 |
| Total | 665,696 | 226,725 | 892,421 | 544,903 | 49,769 | 594,672 |
Notes
a Areas estimated using different data sources.
b W1: 2010 North America Land Cover dataset (wetland class available); W2: Global Lakes and Wetlands Database; S1: FAO/
UNESCO Digital Soil Map of the World; S2: Soil Landscapes of Canada; S3: Peatlands of Canada dataset.
Asterisk (*) denotes the use of multiple datasets (GIS-based overlay analysis applied).
Because the accepted area of peatlands is 1,135,610 km2 as reported by Tarnocai (2006), it was used as the basis for the total peatland area; the 16,375 km2 of permafrost peatlands (Tarnocai et al., 2011) were excluded from the final area table (see Table 13A.15). Wetland-specific soil types from the Peatlands of Canada and the Soil Landscapes of Canada datasets were used to identify mineral and organic soil wetlands. The analysis of wetland area in Canada is based on the Peatlands of Canada database, which was updated from its previous version. The accuracy of the wetland area estimated using this database is equal to or greater than 66%, as suggested by Tarnocai (2009). The distribution of terrestrial freshwater wetlands in Canada is presented in Table 13A.15. For comparison, Warner (2005) reported 1.056 million km2 of peatland area (organic soil wetland) for Canada, a difference of 7%.
Table 13A.15. Areas of Forested and Nonforested Wetland and Related Soil in Canada from Peatland Dataset (S3)a
| Soil Type | Forested (km2) | Nonforested (km2) | Total (km2) |
|---|---|---|---|
| Organic Soil | 703,785 | 415,450 | 1,119,235 |
| Mineral Soil | 268,337 | 103,932 | 372,270 |
| Total | 972,122 | 519,382 | 1,491,505 |
Notes
a S3, Peatlands of Canada dataset.
Carbon Pools
Carbon pools of the Canadian wetlands were calculated using the area carbon density factors for the four wetland categories, derived from CONUS (see Table 13A.16).
Table 13A.16. Carbon Pools of Forested and Nonforested Wetland and Peat and Mineral Soils in Canadaa
| Soil Type | Forested (Pg) | Nonforested (Pg) | Totala (Pg) |
|---|---|---|---|
| Organic Soil | 76.7 | 37.8 | 114.5 |
| Mineral Soil | 5.1 | 9.5 | 14.6 |
| Total | 81.8 | 47.3 | 129.0 |
Notes
a Carbon pools are calculated in petagrams (Pg).
13A.6 Mexico
13A.6.1 Approach
An assessment of terrestrial wetlands in Mexico was used as the basis for identifying wetland areas and soil types. The North American Land Cover dataset (see Table 13A.17) and a recent dataset from Mexico were used to segregate the wetlands into vegetation categories. Area carbon density factors were used to develop the estimates of wetland carbon pools.
Table 13A.17. List of Datasets Used to Assess the Area of Terrestrial Wetlands in Mexico
| Dataset | Year | Publisher | Download Link |
|---|---|---|---|
| North America Land Cover | 2010 | U.S. Geological Survey, Natural Resources Canada, Insituto Nacional de Estadística y Geografía (INEGI), Comisión Nacional para el Conocimiento y Uso de la Biodiversidad (CONABIO), and Comisión Nacional Forestal (CONAFOR) | URL |
| Mapa Potencial de Humedales | 2012 | INEGI | URL |
13A.6.2 Data
The datasets used to estimate the area of terrestrial wetlands in Mexico are presented in Table 13A.17.
13A.6.3 Results
Organic and Mineral Soil in Forested and Nonforested Wetlands in Mexico
This estimate of freshwater wetlands is greater than other reported values (e.g., 31,000 km2; Bridgham et al., 2006). A review of the map units from the Mapa Potencial de Humedales could not ensure that selected wetlands were adequately constrained to freshwater systems (due to problems with data code translations). Accordingly, the calculated wetland area was reduced by 25% to provide a conservative estimate (see Table 13A.18), thereby reducing the accuracy to at least 75%. The metadata for the database did not provide an estimate of the mapping error.
Table 13A.18. Area of Freshwater Wetlands in Mexico Categorized by Soils and Vegetation
| Soil Type | Forested (km2) | Nonforested (km2) | Totala (km2) |
|---|---|---|---|
| Organic Soil | 3,394 | 17,191 | 20,585 |
| Mineral Soil | 5,288 | 10,320 | 15,608 |
| Total | 8,682 | 27,511 | 36,193 |
Acknowledgments
Spatial analyses were conducted at the Center for Applied GIScience, University of North Carolina, Charlotte, by Yu Lan, Jiyang Shi, Wenpeng Feng, Yu Lan, Douglas Shoemaker, Minrui Zheng, and Xiang Zhao. Julie Arnold, USDA Forest Service Southern Research Station, assisted with the literature and preparation of data tables and spreadsheets. Also used were computational facilities at the Portland office of the USDA Natural Resources Conservation Service.
See Full Chapter & References