<b>Kolka</b>, R., C. <b>Trettin</b>, W. Tang, K. Krauss, S. Bansal, J. Drexler, K. Wickland, R. Chimner, D. Hogan, E. J. Pindilli, B. Benscoter, B. Tangen, E. Kane, S. Bridgham, and C. Richardson, 2018: Chapter 13: Terrestrial wetlands. In Second State of the Carbon Cycle Report (SOCCR2): A Sustained Assessment Report [Cavallaro, N., G. Shrestha, R. Birdsey, M. A. Mayes, R. G. Najjar, S. C. Reed, P. Romero-Lankao, and Z. Zhu (eds.)]. U.S. Global Change Research Program, Washington, DC, USA, pp. 507-567, https://doi.org/10.7930/ SOCCR2.2018.Ch13.
Terrestrial Wetlands
The occurrence of the water table within the upper soil layers during the growing season differentiates wetlands from upland ecosystems, influencing the biological communities that must adapt to withstand prolonged periods of soil saturation and biogeochemical processes that are a function of the anoxic soil conditions. While net primary production (NPP) of wetlands is comparable to upland ecosystems (Ahl et al., 2004), the rate of organic matter decomposition is generally less due to the anaerobic soil conditions. As a result, wetland soils typically contain considerably more carbon per unit volume than do upland soils. In areas with prolonged periods of soil saturation and high rates of organic matter production, organic matter may accumulate on top of the mineral substrate, forming organic soils or peatlands with thicknesses ranging from 40 cm to many meters.
The anaerobic conditions of wetland soils also influence greenhouse gas (GHG) fluxes. Unlike upland soils that generally are a sink for atmospheric CH4, wetland soils typically are a net source of CH4 to the atmosphere. Methane flux from wetlands is regulated largely by oxygen availability and associated water table position, soil temperature, and vegetation type (Bansal et al., 2016; Green and Baird 2012; Hanson et al., 2016). Hence, fluxes can be highly variable, even within a wetland, as subtle differences in surface topography, temperature gradients, and vegetation affect fluxes (Bridgham et al., 2006). Accordingly, carbon fluxes and storage in wetlands are likely to change dramatically as a result of climate and land-use changes, which alter water-table dynamics, temperatures, and vegetation communities, ultimately affecting the ecosystem carbon balance. Drainage is the common modification to wetlands for agriculture and silviculture and causes most of the wetland loss noted above. The organic matter decomposition rates of those drained wetlands can be very high, and, for peatlands, the effect may persist for many decades. The soil carbon content of converted wetlands may be greater than the surrounding upland, while the fluxes of GHGs, especially CO2, are likely larger.
This chapter assessed the state of the wetland carbon cycle, considering organic and mineral soils separately because the soil carbon density, or the amount of carbon per unit volume, varies between the two soil types, and they generally reflect different hydrological settings and vegetation communities. Correspondingly, differentiating between forested and nonforested organic and mineral soil wetlands provides a basis to consider the influence of vegetation on the carbon cycle. The approach for quantifying the wetland carbon pools was based primarily on analyses of recently developed geospatial data, providing a more robust basis for the assessment, as contrasted with summarization based on studies reported in the literature. The general framework, using CONUS as an example, consisted of identifying the distribution of forested and nonforested terrestrial wetlands using the USFWS National Wetlands Inventory. The soil carbon stocks were then determined by summarizing USDA’s NRCS Soil Survey databases. Forest vegetation carbon stocks were estimated based on the U.S. Forest Service FIA database (U.S. Forest Service 2003), and nonforest vegetation carbon content was estimated using a mean carbon density based on reported values in the literature. Variations to that framework were necessitated by available databases. For example, in Alaska, where the National Wetlands Inventory has not been completed, a remote sensing–based approach to wetland identification was used (Clewley et al., 2015). Similarly, because Canada does not have a comprehensive national soil inventory, independent assessments of Canadian peatlands and soil landscapes were used. Details about the databases used to calculate the wetland area and associated carbon stocks are provided in Appendix 13A.
There are approximately 2.2 million km2 of terrestrial wetlands in North America (see Table 13.1); the majority of those wetlands (81%) occurs in Canada and Alaska. This estimate is approximately 176,000 km2 less than the one used in SOCCR1 (CCSP 2007). The difference in nonpermafrost peatlands and freshwater mineral soil wetlands among the two reports is due primarily to a smaller and more accurate and current assessment of wetland area in Alaska (Clewley et al., 2015), which reduced the total wetlands in the state by approximately 360,000 km2; Canadian wetlands increased by approximately 198,000 km2 due primarily to a larger estimate of mineral soil wetlands. The uncertainty in wetland area is greatest at the higher latitudes, hence the reliance on remote-sensing methods for spatial extent estimates, which are expected to improve further as data and processing tools advance. The report on Alaskan wetlands by Clewley et al. (2015) is an example of achieving an accuracy of approximately 94% in discriminating wetlands from uplands. There remains uncertainty in the reported area of Canadian peatlands, which ranges from the 755,000 km2 reported by Kroetsch et al. (2011) to the 1.1 million km2 reported in SOCCR1 (Bridgham et al., 2007). In contrast to reported inventories and assessments used in SOCCR1, Zhang et al. (2017a) used six models to estimate wetland area for North America (including coastal wetlands), with the modeled estimates ranging from about 1.1 to 3.3 million km2, effectively placing the estimated total in Table 13.1 in the middle of that range. Correspondingly, there are large ranges in estimated global wetland area. Based on modeled and observational estimates (Bridgham et al., 2006; Melton et al., 2013; Zhang et al., 2017a), North America contains 20% to 47% of the global wetland area, depending on the basis.
Table 13.1. Area, Carbon Pool, Net Ecosystem Exchange of Carbon, and Methane Emissions from Wetlands in North Americaa–c
| Wetland Type | Aread (km2) | Carbon Poole (Pg C) | NEEf | CH4 Emissions | |
|---|---|---|---|---|---|
| Net Balance (Tg C per Year)g | CH4-C (Tg C per Year)g | CH4 (Tg per Year) | |||
| Canada | |||||
| Peatland | |||||
| Nonforested | 415,450 | 37.8 | –6.9 ± 3.5 | 9.4 ± 2.4 | 12.6 |
| Forested | 703,785 | 76.7 | –33.6 ± 5.9 | 6.3 ± 7.4 | 8.4 |
| Mineral | |||||
| Nonforested | 103,932 | 9.5 | –10.6 ± 7.2 | 2.7 ± 0.7 | 3.6 |
| Forested | 268,337 | 5.1 | –12.9 ± 6.8 | 7.2 ± 4.3 | 9.6 |
| Total | 1,491,504 | 129.0 | –64.0 ± 12.0 | 25.6 ± 8.9 | 34.2 |
| Conterminous United States | |||||
| Peatland | |||||
| Nonforested | 42,903 | 3.9 | –5.8 ± 3.6 | 1.0 ± 0.3 | 1.3 |
| Forested | 40,823 | 4.4 | –4.9 ± 3.8 | 0.4 ± 0.4 | 0.5 |
| Mineral Soil | |||||
| Nonforested | 138,381 | 1.9 | –14.1 ± 9.5 | 3.6 ± 1.0 | 4.8 |
| Forested | 173,091 | 3.3 | –11.6 ± 8.2 | 4.7 ± 2.8 | 6.2 |
| Total | 395,197 | 13.5 | –36.5 ± 13.6 | 9.6 ± 3.0 | 12.8 |
| Alaska | |||||
| Peatland | |||||
| Nonforested | 73,836 | 5.5 | –4.2 ± 4.7 | 1.7 ± 0.4 | 2.2 |
| Forested | 5,747 | 0.4 | –0.3 ± 0.4 | 0.1 ± 0.1 | 0.2 |
| Mineral Soil | |||||
| Nonforested | 192,013 | 9.3 | –10.9 ± 12.3 | 5.0 ± 1.4 | 6.7 |
| Forested | 40,162 | 2.0 | –2.3 ± 2.6 | 1.1 ± 0.6 | 1.4 |
| Total | 311,758 | 17.3 | –17.6 ± 13.5 | 7.9 ± 1.6 | 10.5 |
| Puerto Rico | |||||
| Peatland | |||||
| Nonforested | 8 | –0.003 ± 0.003 | 3.38E-04h ± 2.88E-04 | 0.0 | |
| Forested | 1 | 0.000 | 0.000 ± 0.000 | 2.68E-05 ± 2.28E-05 | 0.0 |
| Mineral Soil | |||||
| Nonforested | 252 | 0.006 | –0.030 ± 0.110 | 1.36E-02 ± 0.488E-02 | 0.0 |
| Forested | 50 | 0.001 | –0.006 ± 0.022 | 2.70E-03 ± 0.966E-03 | 0.0 |
| Total | 311 | 0.008 | –0.039 ± 0.110 | 1.67E-02 ± 0.500E-02 | 2.22E-02 |
| Mexico | |||||
| Peatland | |||||
| Nonforested | 17,191 | 0.43 | –5.33 ± 5.25 | 0.69 ± 0.59 | 0.9 |
| Forested | 3,394 | 0.24 | –1.05 ± 1.04 | 0.14 ± 0.12 | 0.2 |
| Mineral Soil | |||||
| Nonforested | 10,320 | 0.35 | –1.25 ± 4.51 | 0.56 ± 0.20 | 0.7 |
| Forested | 5,288 | 0.16 | –0.64 ± 2.31 | 0.29 ± 0.10 | 0.4 |
| Total | 36,193 | 1.17 | –8.27 ± 7.37 | 1.67 ± 0.640 | 2.22 |
| North America | |||||
| Peatland | |||||
| Nonforested | 549,388 | 47.7 | –22.2 ± 17.1 | 12.8 ± 3.7 | 17.0 |
| Forested | 753,749 | 81.8 | –39.9 ± 11.0 | 6.9 ± 8.0 | 9.2 |
| Mineral Soil | |||||
| Nonforested | 444,898 | 21.1 | –36.9 ± 33.6 | 11.9 ± 3.3 | 15.9 |
| Forested | 486,928 | 10.4 | –27.4 ± 19.9 | 13.3 ± 7.8 | 17.7 |
| Total | 2,234,963 | 161.0 | –126.4 ± 23.8 | 44.8 ± 9.5 | 59.8 |
Notes
a Positive emissions indicate net gains to the atmosphere, and negative emissions indicate net gains or sequestration into the ecosystem.
b Citations and assumptions in calculations are in the text of this chapter and in Appendices 13A, and 13B
c Key: C, carbon; NEE, net ecosystem exchange; CH4, methane; Pg C, petagrams of carbon; Tg C, teragrams of carbon.
d Includes freshwater and nontidal terrestrial wetlands. Accuracy of wetland area estimates: Canada: >66% (Tarnocai 2009), conterminous United States: >90% (Nichols 1994), Alaska: 95% (Clewley et al., 2015), Puerto Rico: >90% (Nichols 1994), Mexico: <75% (this report); see Appendix 13A, for more information.
e Includes soil and plant carbon; soil carbon accounts for approximately 93% of the total pool.
f Includes net exchange of CO2 from the wetland; it does not include lateral fluxes or CH4 fluxes.
g The values here are mean values plus or minus 2 times the standard errors to approximate the minimum and maximum values of a 95% confidence interval.
h E = 10x.
The dominant carbon flux from terrestrial wetlands is characterized as NEE of CO2, which is a measure of the difference in CO2 uptake and CO2 release; NEE is positive when the net flux is from the wetland to the atmosphere. In addition to NEE of CO2, this chapter also reports CH4 fluxes from the wetlands. Estimates of these fluxes are based on studies reported in SOCCR1 (CCSP 2007) and subsequent literature that used field-based measurements to estimate NEE and CH4 fluxes (either chamber based or eddy covariance). This chapter categorizes the studies by soil, vegetation type, and region and utilizes a mean flux as the basis for the flux density (flux per unit area) used in the reported regions (see Appendix 13B for flux density factors used in the analyses). Though NEE and CH4 fluxes are the primary fluxes considered, the wetland net ecosystem carbon balance (Chapin et al., 2006), which is the overall net change in wetland carbon over a specified time, is also influenced by other fluxes. These additional fluxes include carbon monoxide and volatile organic carbon to the atmosphere (e.g., from fires), lateral fluxes of DOC (see Section 13.3.3), dissolved inorganic carbon (DIC), and particulate carbon (Chapin et al., 2006).
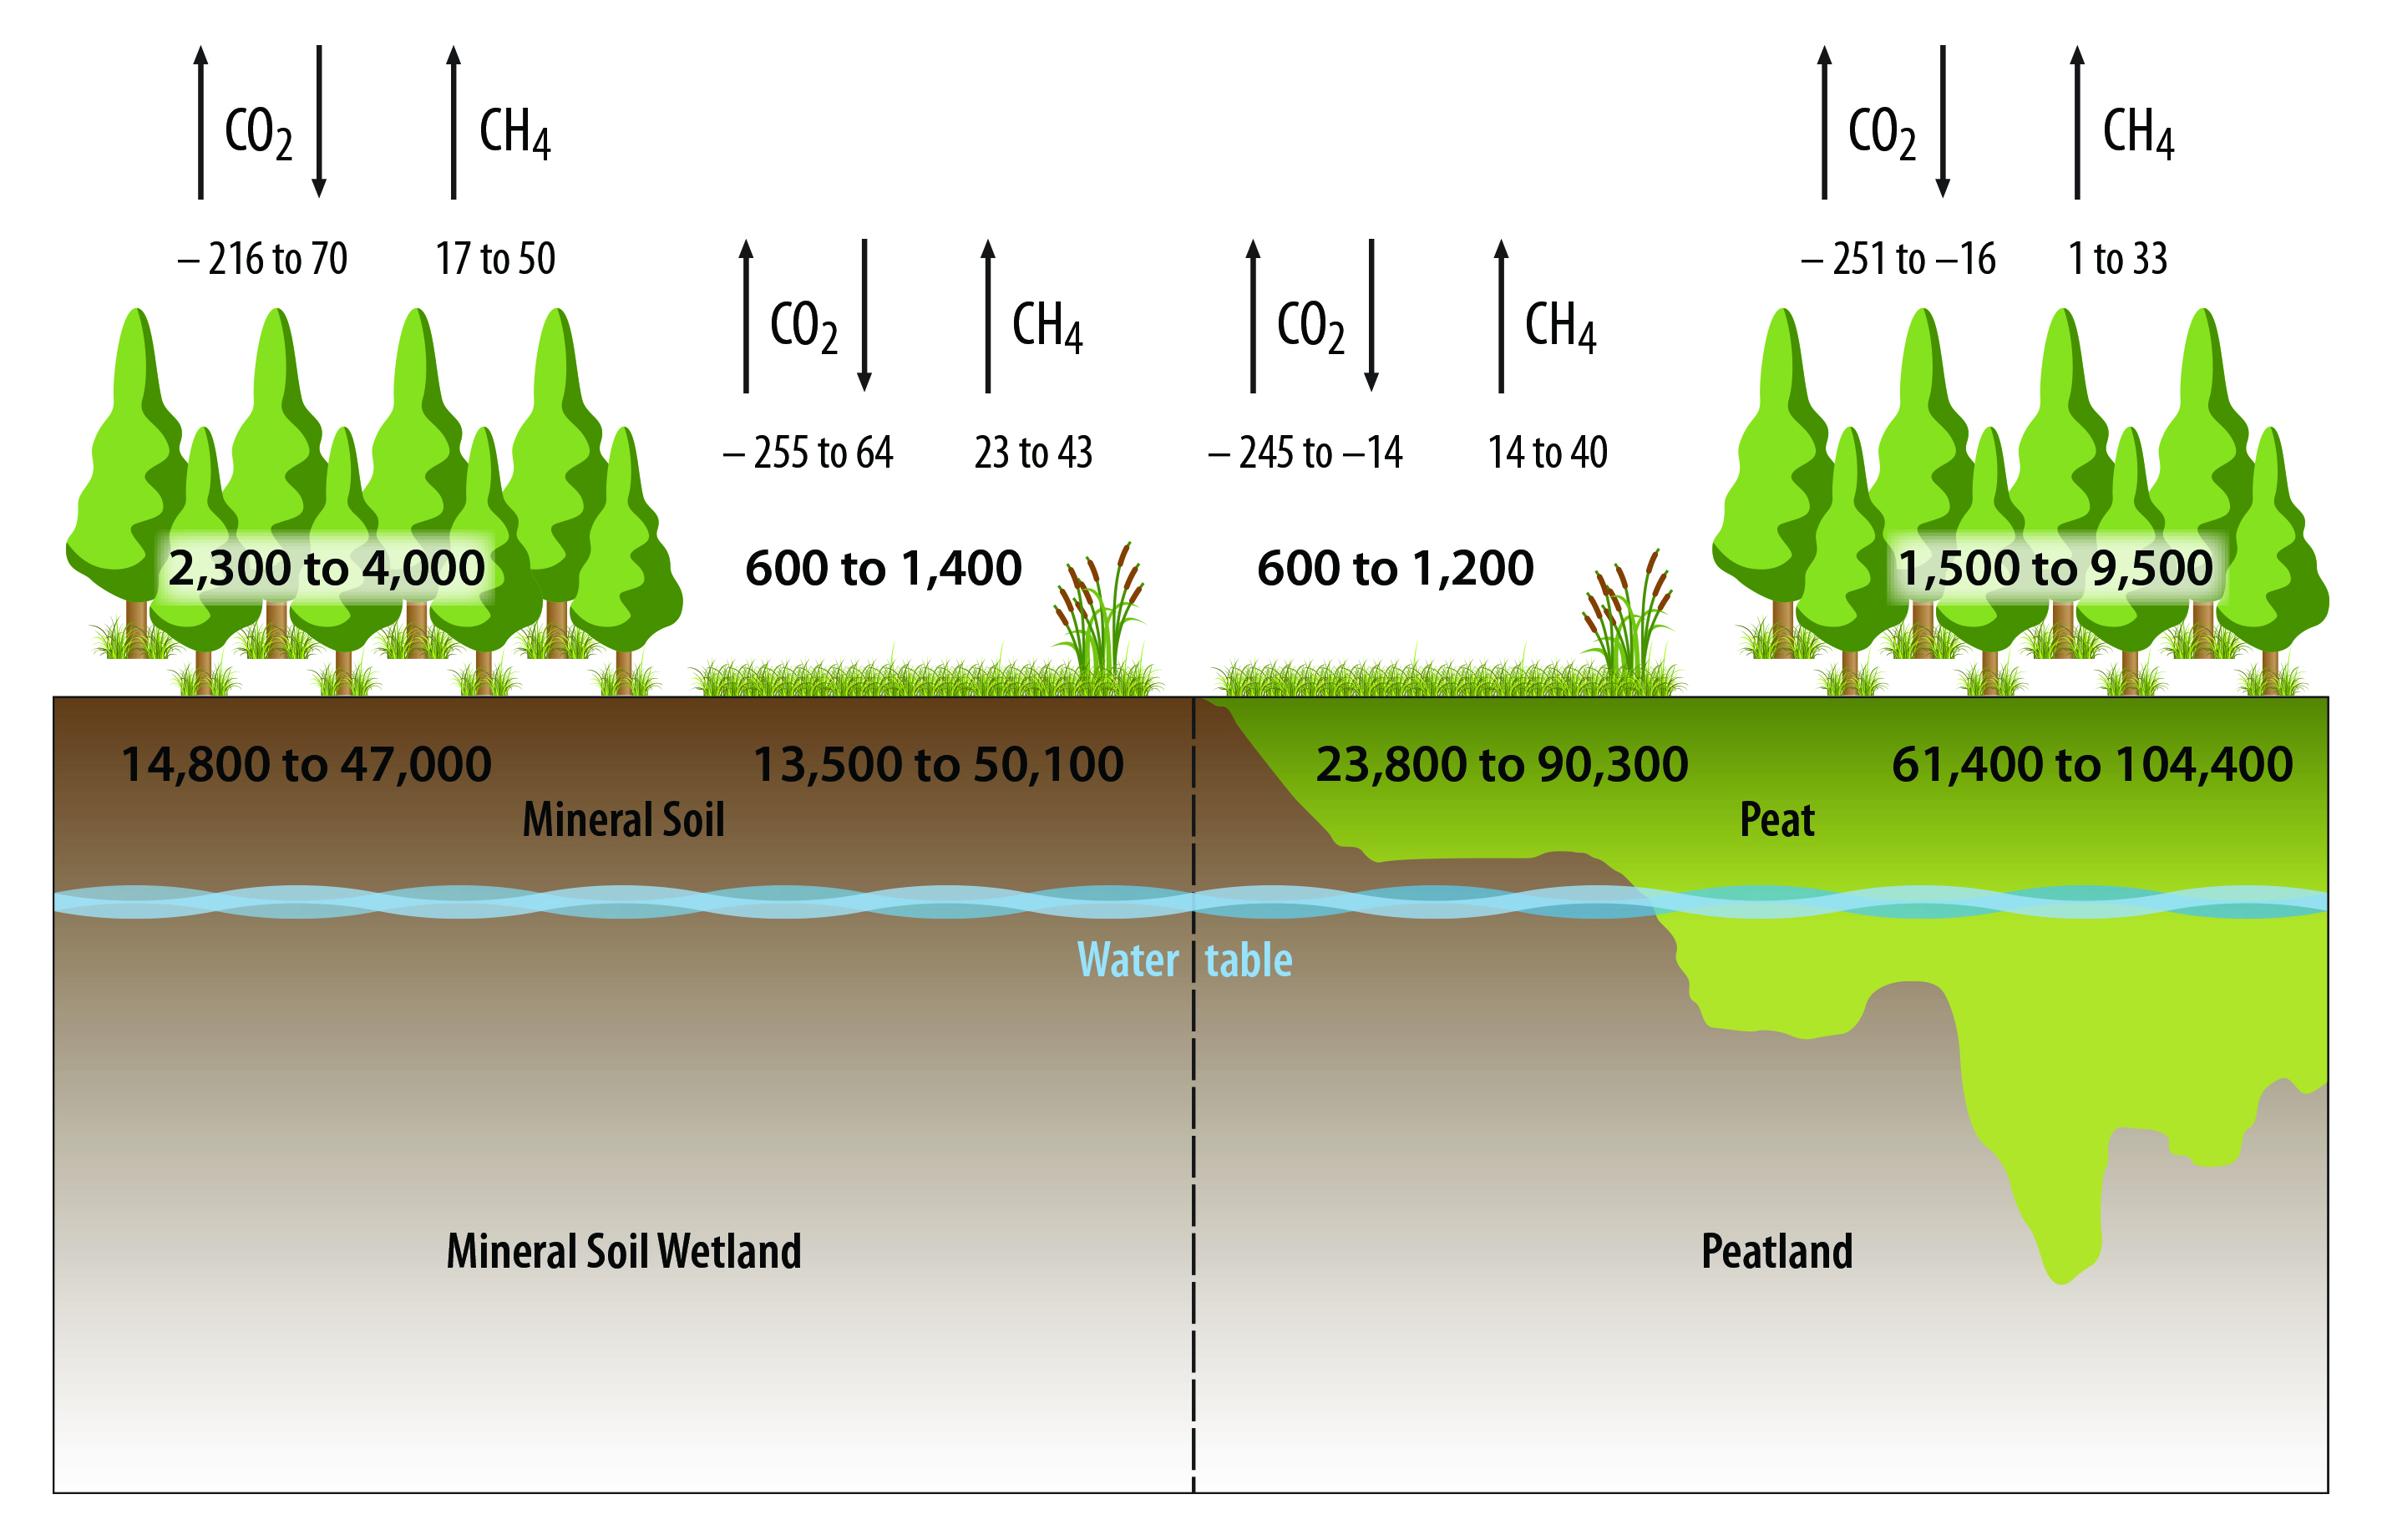
Peatlands tend to store more soil carbon than mineral soil wetlands, and forested wetlands store more carbon in the vegetation than nonforested wetlands (see Figure 13.2). Across all studies used in this chapter’s analysis, fluxes of CO2 are overlapping across all wetland types but both forested and nonforested mineral soil wetlands tend to be larger sources (or lesser sinks) of CO2 (see Figure 13.2). Similarly, CH4 fluxes overlap across all wetland types, yet all wetland types tend to be sources of CH4 (see Figure 13.2).
Figure 13.2: Carbon Pools and Fluxes in Forested and Nonforested Mineral Soil Wetlands and Peatlands in North America
13.3.1 Peatlands—Carbon Stocks and Fluxes
Peatlands include those ecosystems with organic soils generally classified as either fens or bogs, both of which are defined by water source and pH. Fens tend to be fed by groundwater and precipitation and have circumneutral pH values with vegetation generally dominated by sedges (Carex spp.) and brown mosses. In contrast, bogs are predominantly precipitation fed and have much lower pH and Sphagnum mosses. Other types of peatlands include riparian systems such as bottomland hardwood ecosystems in the Mississippi River Valley, pocosins, Atlantic white cedar swamps, Carolina bays in the southeastern United States, and high-elevation peatlands in the Rocky Mountains from Canada to Mexico and throughout the Sierra Nevada of California. The total area of peatland in North America is about 1.3 million km2 (see Table 13.1).
Peatlands contain about 80% of the wetland carbon stock in North America and account for 48% of the net annual carbon uptake and 44% of the annual CH4 flux. Approximately 58% of peatlands in North America are forested. The peatland carbon pool in Canada is currently estimated at 114 petagrams of carbon (Pg C), about 67% of which occurs in forests. This pool represents 88% of the total peatland carbon stock for North America (see Table 13.1). Canadian peatlands have an estimated annual uptake of 41 teragrams of carbon (Tg C) and an estimated release of 16 Tg CH4-C per year, 61% from nonforested peatlands. Alaska contains 42% of the U.S. peatland carbon stock and accounts for approximately 39% of the carbon uptake. Forests compose 49% of the peatland carbon stock in CONUS and 7% in Alaska. Methane from U.S. peatlands is 7% of the North American annual peatland flux; CONUS contributes 43% of the U.S. CH4 flux. This difference in stocks and fluxes between the two countries having the majority of North American peatlands is attributable to the much larger peatland area in Canada. Mexico contains the largest area of tropical peatlands (~20,600 km2), which constitutes approximately 57% of the total wetland area of the country (see Table 13.1). Those peatlands contribute 2% of the North American peatland CH4 flux as a result of the high flux rates in the tropics. Additionally, small areas of tropical peatlands occur in Puerto Rico (9 km2). The estimated CH4 emission is quite variable for each country or state, with the 95% confidence interval varying from 26% to 118% and 85% to 269% of the mean for temperate and tropical wetlands (see Table 13.1), which is a reflection of the high degree of variability in the reported measurement data. The CH4 fluxes applied for forested and nonforested peatlands (8.9 and 22.7 g C per m2 per year, respectively) are less than the 26 g C per m2 per year average for bogs and fens reported by Turetsky et al. (2014).
There is wide variation in intrinsic peat properties that influences the carbon stored in peat and how fast it accumulates after disturbances or with succession. Peat properties related to carbon storage are directly linked to the source material that changes with peatland type (Kracht and Gleixner 2000; Schellekens et al., 2012). For example, “peat moss,” or Sphagnum-derived peat, is different in soil carbon density than peat derived from woody plants (“silvic peat”). Also, peat decomposition rates tend to increase with decreases in water tables (Ise et al., 2008). As such, care is needed in making broad assessments of peat accumulation in forested versus open peatlands, especially since dominant cover types can change (e.g., from silvic peat to Sphagnum peat) over time, and water tables can be influenced by short- and long-term precipitation patterns (e.g., droughts) and anthropogenic disturbances (e.g., draining). These factors all contribute to the large amount of variation in peatland carbon cycling and rates of peat accumulation. Peat carbon accumulation rates since the last glaciation range from 7 to 300 g C per m2 per year (Kolka et al., 2011) in North America, with an average of 23 g C per m2 per year during the Holocene (Loisel et al., 2014), but values commonly range from 20 to 30 g C per m2 per year (Manies et al., 2016). In terms of peat accumulation, long-term rates range from 0.2 to 10 mm per year but typically range from 0.4 to 2.0 mm per year across all North American peatland types (Kolka et al., 2011). Peatland carbon pools are dependent on the depth of peat, ranging from 20,000 g C per m2 in shallow peatlands to more than 300,000 g C per m2 in peatlands >5 m deep (Kolka et al., 2011).
Generally, any factor that lowers the water table relative to the peat surface will result in increased CO2 production, increased decomposition, and decreased CH4 production (Waddington et al., 2015). There are also generalizations that can be made across peatland types, although variation in CO2 and CH4 production is high (e.g., McLaughlin and Webster 2014). Fen ecosystems are generally characterized by having relatively low CH4:CO2 fluxes compared with systems having very little water movement such as bogs, though fluxes vary greatly, both seasonally and latitudinally. In northern peatlands, CH4 fluxes are generally highest when water tables are near the peat surface and seasonal temperatures are high (Turetsky et al., 2014). Pocosin ecosystem soils are in contact with groundwater except during seasonal droughts, thus their gaseous fluxes can be variable but generally produce less CH4 than northern peatlands (Bridgham and Richardson 1992). The reduced gaseous fluxes of pocosins may be related to the high polyphenol content of their peats that resists decomposition even during moderate drought (Wang et al., 2015). The composition of the organic matter in peatlands also affects fluxes of CH4 and CO2, with low-quality peat maintaining low rates of decomposition, even when aerated (see Figure 13.3). Those effects are evident both within and between climatic zones.
Figure 13.3: Organic Soil Peat Core

Gaps in research and monitoring activities to better understand how peatland carbon storage may change in an altered future climate are related mainly to disturbance events that dramatically alter the mechanisms of peat carbon accumulation and stability. Disturbance events of concern are those that alter wetland hydrology, which has a direct feedback to primary production and decomposition. While there is well-developed literature demonstrating that lower water tables coincident with changing precipitation patterns or altered drainage often result in a decline in the carbon sink strength of northern peatlands (Waddington et al., 2015), altered hydrology also has been shown to increase the vulnerability of northern latitude peatlands to wildfire (Benscoter et al., 2011; Turetsky et al., 2011a; Waddington et al., 2012), hence further increasing the vulnerability of peatland carbon pools to decomposition. Research has demonstrated that the extent of fires in boreal North America has steadily increased over the past five decades (Kasischke and Turetsky 2006), often with substantial peat combustion (Turetsky et al., 2011b). For example, a single fire event in northern peatlands can consume 3.3 to 3.6 kg C per m2 (Reddy et al., 2015; Turetsky et al., 2011b), recovery from which would require about 140 years. Disturbance-mediated changes in vegetation community composition also have implications for gas production because different plant species functionally alter rates of CO2 and CH4 fluxes from peat, or they affect the ability of peat to resist decomposition (Armstrong et al., 2015; Turetsky et al., 2014). Taken together, the effects of altered hydrology (whether induced by management or as a climatic response) on fire regime and productivity and changes in plant species composition represent key uncertainties in the current understanding of peatland carbon storage in an altered future climate.
13.3.2 Mineral Soil Wetlands—Carbon Stock and Fluxes
The total area of mineral soil wetlands in North America is about 0.9 million km2 (see Table 13.1). The United States contains 52% of the mineral soil wetland carbon stock in North America. Mineral soil wetlands in CONUS have an estimated carbon stock of 5.2 Pg C, with a net annual sequestration of 25.7 Tg C as CO2 (Tg CO2-C) and an estimated emission of 8.3 Tg CH4-C per year (see Table 13.1). Alaska has a larger stock (11.3 Pg C), annual sequestration as CO2 (13.2 Tg C), and CH4 release (6.1 Tg CH4-C). Canadian mineral soil wetlands have a carbon stock of 14.6 Pg C, with an annual CO2 uptake of 23.5 Tg C and an estimated release of 9.9 Tg CH4-C per year (see Table 13.1). Mexico has much smaller mineral soil wetland stock (0.5 Pg C), CO2 sequestration, and CH4 emissions. The estimates of the exchange of CO2-C and CH4-C are quite variable, with the 95% confidence interval ranging from 18% to 360% of the reported mean. Mineral soil wetland carbon stocks in North America are nearly equally divided between nonforested and forested wetlands, 48% and 52%, respectively. Methane releases from the wetlands are greatest for mineral soil wetlands in Canada, followed by CONUS and Alaska (see Table 13.1); these estimates also are variable, having a 95% confidence interval ranging from 28% to 61% of the reported mean.
Different national agencies classify mineral soil wetlands differently, using various terms such as marshes, swamps, riverine wetlands, palustrine wetlands, prairie potholes, playas, and Carolina bays, as well as many other local and regional terms. Geography and geomorphology are distinguishing factors in some classifications and influence carbon dynamics. Although there is value in broad classifications, such as forested versus nonforested as in Table 13.1, it is important to recognize that boreal, temperate, and tropical regions in North America span from just over 14°N latitude along the Mexican border with Guatemala to boreal regions of Alaska and Canada positioned to 60° to 70°N latitude. Variation in the carbon pool within these mineral soil wetland types and regions correlates strongly with latitude. Modeled NPP of wetlands across all types, including organic soil wetlands, ranged from 461 to 618 g C per m2 per year for tropical and lower-latitude temperate regions to as little as 172 to 183 g C per m2 per year in boreal regions (Cao et al., 1996). Summarizing carbon dynamics in tropical wetlands, Sjogersten et al. (2014) reported an average NPP of 880 g C per m2 per year for tropical mineral soil wetlands. The proportion of carbon being returned to the atmosphere as CH4 also decreased with increasing latitude, with CH4 fluxes varying slightly with respect to whether wetlands were forested or nonforested along this latitudinal gradient (see Table 13.1). The data reported by Cao et al. (1996) do not differentiate organic soil wetlands from mineral soil wetlands, but reductions in NPP and CH4 fluxes for mineral soil wetlands are included and would track with these overall patterns.
Mineral soil wetland carbon pools include those with soil organic layers that are less than 40 cm thick. The Intergovernmental Panel on Climate Change (IPCC) considers a soil depth down to 30 cm as the lower limit for reporting of mineral soil wetland carbon pools (IPCC 2013). To a depth of 30 cm, carbon pools range from 2,200 g C per m2 in dry tropical mineral soil wetlands to greater than 10,000 g C per m2 in boreal and moist temperate wetlands (Batjes 2011; Wickland et al., 2014). U.S. soil surveys consider soil properties in the upper 200 cm, but values in the top 150 cm are reported in this chapter to provide a uniform basis of comparison that includes both the surface soil layers and the subsoil.
Seasonal and diurnal fluxes of GHGs from boreal and temperate mineral soil wetlands have a wide range. For example, from temperate forested wetlands, CO2 fluxes ranged from –0.444 to 3.303 g C per m2 per day and CH4 fluxes ranged from –0.014 to 0.0199 g C per m2 per day (Alford et al., 1997; Harriss and Sebacher 1981; Harriss et al., 1982, 1988; Kelley et al., 1995; Krauss and Whitbeck 2012; Miller and Ghiors 1999; Mulholland 1981; Pulliam 1993; Wilson et al., 1989; Yu et al., 2008). The fluxes depend on the wetland type, soil temperature, and soil water regime. These factors are affected not only by latitude, but also by land-use change, leading to much assessment difficulty and uncertainty. North American wetlands release approximately 44 Tg CH4-C per year, but the uncertainty surrounding this value is considerable (see Table 13.1). For nonforested mineral soil wetlands of North America, NEE of carbon as CO2, ranged from an average of –264 to 527 g C per m2 per year. Methane was emitted from these same wetlands at rates of 0.8 to 127 g C per m2 per year. Such broad ranges of CO2 and CH4 fluxes reflect sensitivity to biotic and abiotic factors, which drive high uncertainty in estimating the net carbon balance and changes in carbon sinks at large scales and time periods.
Understanding the carbon balance across gradients of hydrology and vegetation within a mineral soil wetland is crucial to determining landscape-scale fluxes, especially for systems associated with fluvial networks. For instance, in a short-hydroperiod floodplain wetland in Virginia, GHG fluxes varied dramatically depending on the floodplain geomorphic unit (i.e., levee, backswamp, and toe slope) and in relation to longitudinal position (i.e., upstream versus downstream; Batson et al., 2015). The focus is often on the in situ capacity of forested mineral soil wetlands in controlling the carbon balance. However, many forested mineral soil wetlands are positioned for allochthonous inputs, (i.e., organic and inorganic carbon [including dissolved CO2] that moves across terrestrial landscapes to aquatic environments). Such inputs, along with erosion, may influence the carbon balance significantly through external drivers (Ensign et al., 2013; Noe et al., 2016). Data on these inputs are few, as research has focused intently over the past several decades on carbon balance from organic soil wetlands (e.g., fens, bogs, and coastal marshes).
Prairie "potholes" represent one type of mineral soil wetland that has been studied intensively. The Prairie Pothole Region (PPR) is home to the largest inland mineral soil wetland ecosystem in North America. Covering about 777,000 km2 of north-central United States and south-central Canada, the PPR is characterized by millions of closed depressional, mineral soil wetlands or potholes encompassing approximately 70,000 km2 of undrained wetlands (Dahl 2014; Euliss et al., 2006). The distinguishing feature of prairie potholes is their lack of a discernable surface drainage network. These wetlands have the potential to represent a considerable contribution to the North American GHG balance, both as carbon storage and sequestration sites and as sources of GHGs (Badiou et al., 2011; Bansal et al., 2016; Tangen et al., 2015). PPR wetlands, also characterized by periods of inundation ranging from ephemeral to permanent, exist along a water-salinity gradient from fresh to hypersaline and occur primarily within a matrix of croplands and grasslands (Euliss et al., 2004; Goldhaber et al., 2014; Niemuth et al., 2010; Winter and Rosenberry 1998). Many PPR wetlands contain sulfate concentrations comparable to coastal systems, resulting in inhibition of CH4 production (Goldhaber et al., 2014). Consequently, the biotic and abiotic factors that regulate the carbon dynamics and GHG balance of these systems are highly variable, both temporally and spatially.
Previous work recognizing PPR wetlands as significant carbon storage sites (Euliss et al., 2006) and identifying mineral soil wetlands as a major data gap (Bridgham et al., 2006, 2007) spurred considerable research in recent years pertaining to the overall GHG balance of these wetlands. Soil carbon stores are reduced by 12% to 26% when wetlands are converted from native grasslands to agricultural uses, presumably due to wetland drainage and soil disturbance (Gleason et al., 2008, 2009; Tangen et al., 2015). Peak CH4 fluxes can exceed 0.75 g C per m2 per day, and maximum cumulative seasonal CH4 fluxes have been shown to be among the greatest reported for North American wetlands (Bansal et al., 2016; Bridgham et al., 2006; Tangen et al., 2015). In terms of the overall radiative balance of PPR mineral soil wetlands, CO2 contributes the most (about 90%) to net GHG flux, followed by CH4 (about 9%) and N2O (about 1%; Gleason et al., 2009).
13.3.3 Lateral Carbon Fluxes from Terrestrial Wetlands
The lateral flux of carbon may occur in the form of DIC, DOC, dissolved CH4, and particulates. The DOC flux is generally the largest of these fluxes from wetlands and is particularly important because it can be a source of carbon to both surface and groundwater. The rates of DOC production and loss are variable across time, space, and wetland types and appear to be climate dependent (Drösler et al., 2014). The transport of DOC to surface waters is fairly well studied for peatlands (Hope et al., 1994). The IPCC Wetlands Supplement (2013) chapter on drained inland organic soils reviewed the literature and estimated DOC flux from natural systems across biomes. As part of that supplement, Drösler et al. (2014) found 1) boreal peatland flux to surface waters to be 8.4 g C per m2 per year (95% confidence interval ranging from 6.0 to 11.1 g C per m2 per year), 2) temperate peatland flux to surface waters to be 21.2 g C per m2 per year (17.3 to 26.2 g C per m2 per year), and 3) tropical DOC fluxes to surface waters to be 56.9 g C per m2 per year (49.2 to 63.8 g C per m2 per year). Higher temperatures lead both to more production and decomposition and to higher DOC fluxes.
However, mineral soil wetlands are not well studied, possibly because many mineral soil wetlands have no surface stream drainage outlet. Studies conducted in the temperate northeastern United States summarized data for 30 forested watersheds with no wetlands present and found DOC fluxes to range from 0.5 to 4.9 g C per m2 per year (mean = 2.4 g C per m2 per year; Raymond and Saiers 2010), considerably lower than the aforementioned mean of 21.2 g C per m2 per year found for peatlands. At least for the temperate zone, these fluxes can be considered as the lower bound of mineral soil wetland fluxes. Aitkenhead and McDowell (2000) reviewed the literature and compared riverine DOC fluxes across a wide range of climate and vegetation biomes but did not differentiate DOC contributions between peatland and mineral soil wetlands. Here, the studies in known mountainous and peatland watersheds were removed, with the caveat that they are stream and river fluxes, not wetland fluxes. This chapter estimated the mean DOC flux for streams and rivers that have considerable mineral soil wetlands in their watersheds. The mean DOC flux for mineral soil wetlands in 1) tropical systems is estimated as 9.9 g C per m2 per year (n = 2; Day et al., 1977; Malcolm and Durum 1976); 2) in temperate systems, as 5.4 g C per m2 per year (n = 6; Clair et al., 1994); and 3) in boreal systems, as 2.1 g C per m2 per year (n = 16; Clair and Ehrman 1996; Mulholland and Watts 1982).
Interestingly, this chapter’s estimates of mineral soil wetland DOC fluxes as a percentage of organic soil DOC fluxes are relatively consistent across the three biomes (25%, 25%, and 17%, respectively, for boreal, temperate, and tropical ecosystems). DOC fluxes from North American terrestrial wetlands can be estimated using the wetland areas in Table 13.1 and characterizing Alaska and Canada as boreal, CONUS as temperate, and Puerto Rico and Mexico as tropical. Boreal DOC fluxes are 11.4 Tg (10.1 Tg from organic wetland soils and 1.3 Tg from mineral wetland soils). Temperate DOC fluxes are 3.5 Tg (1.8 Tg from organic wetland soils and 1.7 Tg from mineral wetland soils). Tropical DOC fluxes are 1.4 Tg (1.2 Tg from organic wetland soils and 0.2 Tg from mineral wetland soils). Together, these fluxes total 16.3 Tg DOC for North America. Although there is low confidence in the amount of lateral DOC fluxes, especially those related to mineral soil wetlands, these fluxes are lower but of similar magnitude as the NEE and about 37% of the CH4 fluxes from terrestrial wetlands (see Table 13.1).
13.3.4 Carbon Stock and Balance
The estimated North American terrestrial wetland carbon pool of 161 Pg C is less than the 214 Pg C reported in SOCCR1 for permafrost peatlands, nonpermafrost peatlands, and freshwater mineral soil wetlands (CCSP 2007). This difference is attributable to the inclusion of permafrost wetlands in the SOCCR1 report (CCSP 2007) and differences in nonpermafrost wetland area. The estimate here (129 Pg) for the amount of carbon stored in North American peatlands is less than that (163 Pg) reported by Gorham et al. (2012), again, likely a result of the Arctic permafrost area.
The development of a carbon balance sheet for the terrestrial wetlands of North America provides a useful perspective for considering the relative contributions of the various pathways, the relative differences in fluxes, and uncertainties. The wetland carbon balance sheet can be simplified by considering NEE as the net change in the CO2-carbon exchange between the wetland and the atmosphere (negative values indicate net transfer to the ecosystem). Net gains to the wetland, assuming a negative NEE, are effectively allocated among vegetation and soils. The principal losses of carbon from the wetlands that are not included in NEE are CH4 fluxes (see Sections 13.3.1 and 13.3.2), DOC (see Section 13.3.3), hydrological fluxes of DIC and suspended particulates, and losses due to episodic disturbance regimes (e.g., fire). Unfortunately, there is very little information about the loss of carbon as DIC or particulates for terrestrial wetlands. Thus, for current purposes, they are not considered further. Accordingly, the net ecosystem carbon balance for terrestrial wetlands in North America is –65.3 Tg C (–126.4 Tg C input, see Table 13.1, + 44.8 Tg CH4-C flux, see Table 13.1, + 16.3 Tg DOC loss, see Section 13.3.3), indicating that the wetlands are a net carbon sink. However, the estimated annual accumulation in carbon among the soil and vegetation pools, 47.9 and 43.6 Tg C per year, respectively, yields an imbalance of +30 Tg C, indicating that the estimated NEE is too low or that one or more of the components are overestimated.
There is considerable variability in estimates of wetland carbon fluxes, whether it is from field measurements or large-scale simulations. Accordingly, comparison among reports provides useful perspectives. The North American terrestrial wetland CH4 flux, based on measurements and extrapolated to the wetland area, is estimated at 45 Tg C per year, which is considerably higher than the estimated amount in SOCCR1 (6.1 Tg C per year). SOCCR1 also used measurements as the basis (CCSP 2007); however, the SOCCR2 estimate is nearer the range of several recent modeling studies. Using an ensemble of models to simulate CH4 emissions in North America, Poulter et al. (2017) reported annual emissions of 31.8 to 33.5 Tg C for 2007 to 2012. Similarly, using six different datasets, Zhang et al. (2017a) reported an average CH4 emission rate of 22.6 Tg C per year for the region from 2000 to 2006. This amount is similar to the average annual emission estimated for 1979 to 2008 of 17.8 Tg C per year by Tian et al. (2010). The annual global CH4 flux from wetlands is estimated between 124 and 139 Tg C per year (Saunois et al., 2016; Bloom et al., 2017; Poulter et al., 2017; Zhang et al., 2017a, b); accordingly, the contribution of North America to the global CH4 budget is likely within the range of 20% to 30%. While there are not any large-scale NEE assessments, synthesizing measurement data for terrestrial wetlands, Lu et al. (2017) report an average annual accumulation rate of 93 g C per m2, which is considerably higher than the average rate of 53 g C per m2 reported here.
Assessing the pools associated with the carbon balance sheet provides additional perspective. Both organic and mineral soils accumulate carbon. Estimates here of carbon accumulation in the soil are 25 and 17 g C per m2 per year for peat and mineral soils, respectively; those aggregated rates are based on the mean accumulation rates, reported by Bridgham et al. (2006), weighed by the wetland area. Accordingly, peat and mineral soils gain approximately 32.2 and 15.9 Tg C per year, respectively. Although there is a wide range in vegetation productivity, an estimated 43.6 Tg C is sequestered in biomass annually. The estimate assumes that accumulation in plant biomass is balanced with decomposition in nonforested wetlands and that forested wetlands have a net accumulation of 30 to 50 g C per m2 per year (Bridgham et al., 2006; Stinson et al., 2011). The resulting summation of carbon sequestration by the soil and vegetation components (92 Tg C) is greater than the allocation to CH4 fluxes or DOC.
See Full Chapter & References