<b>Schuur</b>, E. A. G., A. D. <b>McGuire</b>, V. <b>Romanovsky</b>, C. Schädel, and M. Mack, 2018: Chapter 11: Arctic and boreal carbon. In Second State of the Carbon Cycle Report (SOCCR2): A Sustained Assessment Report [Cavallaro, N., G. Shrestha, R. Birdsey, M. A. Mayes, R. G. Najjar, S. C. Reed, P. Romero-Lankao, and Z. Zhu (eds.)]. U.S. Global Change Research Program, Washington, DC, USA, pp. 428-468, https://doi.org/10.7930/ SOCCR2.2018.Ch11.
Arctic and Boreal Carbon
11.3.1 Soil Carbon Pools
The total pool of organic carbon stored in permafrost zone soils comprises carbon frozen at depth in peatlands (>20% carbon) and carbon mixed with mineral soils (<20% carbon). Each type dominates different locations in the Northern Hemisphere, depending on physiographic and environmental characteristics (Gorham 1991; Jobbágy and Jackson 2000; Mishra and Riley 2012; Post et al., 1982; Tarnocai et al., 2009). Recent work has shown permafrost soil carbon pools to be much larger at depth than previously recognized because of cryogenic (freeze-thaw) mixing (Bockheim and Hinkel 2007; Ping et al., 2008) and sediment deposition (Schirrmeister et al., 2002, 2011; Zimov et al., 2006). In particular, the 1.2 × 10⁶ km2 “yedoma” region (i.e., areas of Siberia and Alaska that remained ice-free during the last Ice Age) contains accumulated silt (loess) soils many meters thick. Even though carbon concentrations of these mineral soils are not remarkably high (0.2% to 2% carbon), the depths of these sediments give rise to large carbon inventories.
The current best estimate of total soil organic carbon (terrestrial) in the northern circumpolar permafrost zone is 1,460 to 1,600 petagrams (Pg; 1 Pg = 1 billion metric tons; Hugelius et al., 2014; Schuur et al., 2015; Strauss et al., 2017). This inventory includes all soil orders within the permafrost zone and thus also counts carbon in nonpermafrost soil orders, active-layer carbon that thaws seasonally, and peatlands. All permafrost zone soils estimated to 3 m in depth contain 1035 ± 150 Pg of carbon (C; see Table 11.1 and Figure 11.7a). Based on somewhat earlier estimates for the 1-m inventory, two-thirds of the soil carbon pool is in Eurasia, with the remaining one-third in North America, including Greenland (Tarnocai et al., 2009).
Table 11.1. Soil Carbon Pools to 3 m in Depth for the Northern Circumpolar Permafrost Zone
| Soil Orders | Soil Suborders | Soil Carbon Pool Pg C, 0 to 3 m in depth) |
Area (×106 km2 |
|---|---|---|---|
| Gelisol | Turbels | 476 | 6.2 |
| Orthels | 98 | 2.5 | |
| Histels | 153 | 1.4 | |
| Histosol, Organic | 149 | 0.9 | |
| Non-Gelisol, Mineral | 158 | 6.8 | |
| Total Circumpolar | 1,035a | 17.8 |
Soil suborders are shown for Gelisol (permafrost soil order) only, but soil carbon (petagrams of carbon [Pg C]) in this zone also is contained in Histosol (peat soil) and non-Gelisol soil orders (various). Data are from Hugelius et al. (2014).
Notes
a Total is different from the sum due to rounding.
New synthesis reports account for 327 to 466 Pg C in deep loess (wind- and water-borne) sediment accumulations below 3 m in Siberia and Alaska (Strauss et al., 2013, 2017; Walter Anthony et al., 2014; Zimov et al., 2006; see Figure 11.7b). This yedoma region contains both intact yedoma deposits that have remained primarily frozen since the last glacial period and deposits where abrupt thaw led to ground subsidence (thermokarst) and lake formation. These thermokarst lake deposits later refroze into permafrost when the lakes drained. The carbon density of intact yedoma is now thought to be lower than previously estimated because of revisions in soil bulk density estimates to account for excess pore ice (Schirrmeister et al., 2011). In contrast, thermokarst lake deposits previously believed to have depleted soil carbon stocks are now thought to have accumulated net soil carbon (Walter Anthony et al., 2014). The discovery of increased net soil carbon as a result of the thermokarst lake cycle compensated in part for the downward revision of the carbon pool contained in intact yedoma (Strauss et al., 2013; Walter Anthony et al., 2014). The range here represents different methodologies for scaling carbon pools and also accounts for carbon remaining in thawed sediments below currently existing lakes (high estimate only).
Figure 11.7: Soil Organic (SOC) Carbon Maps
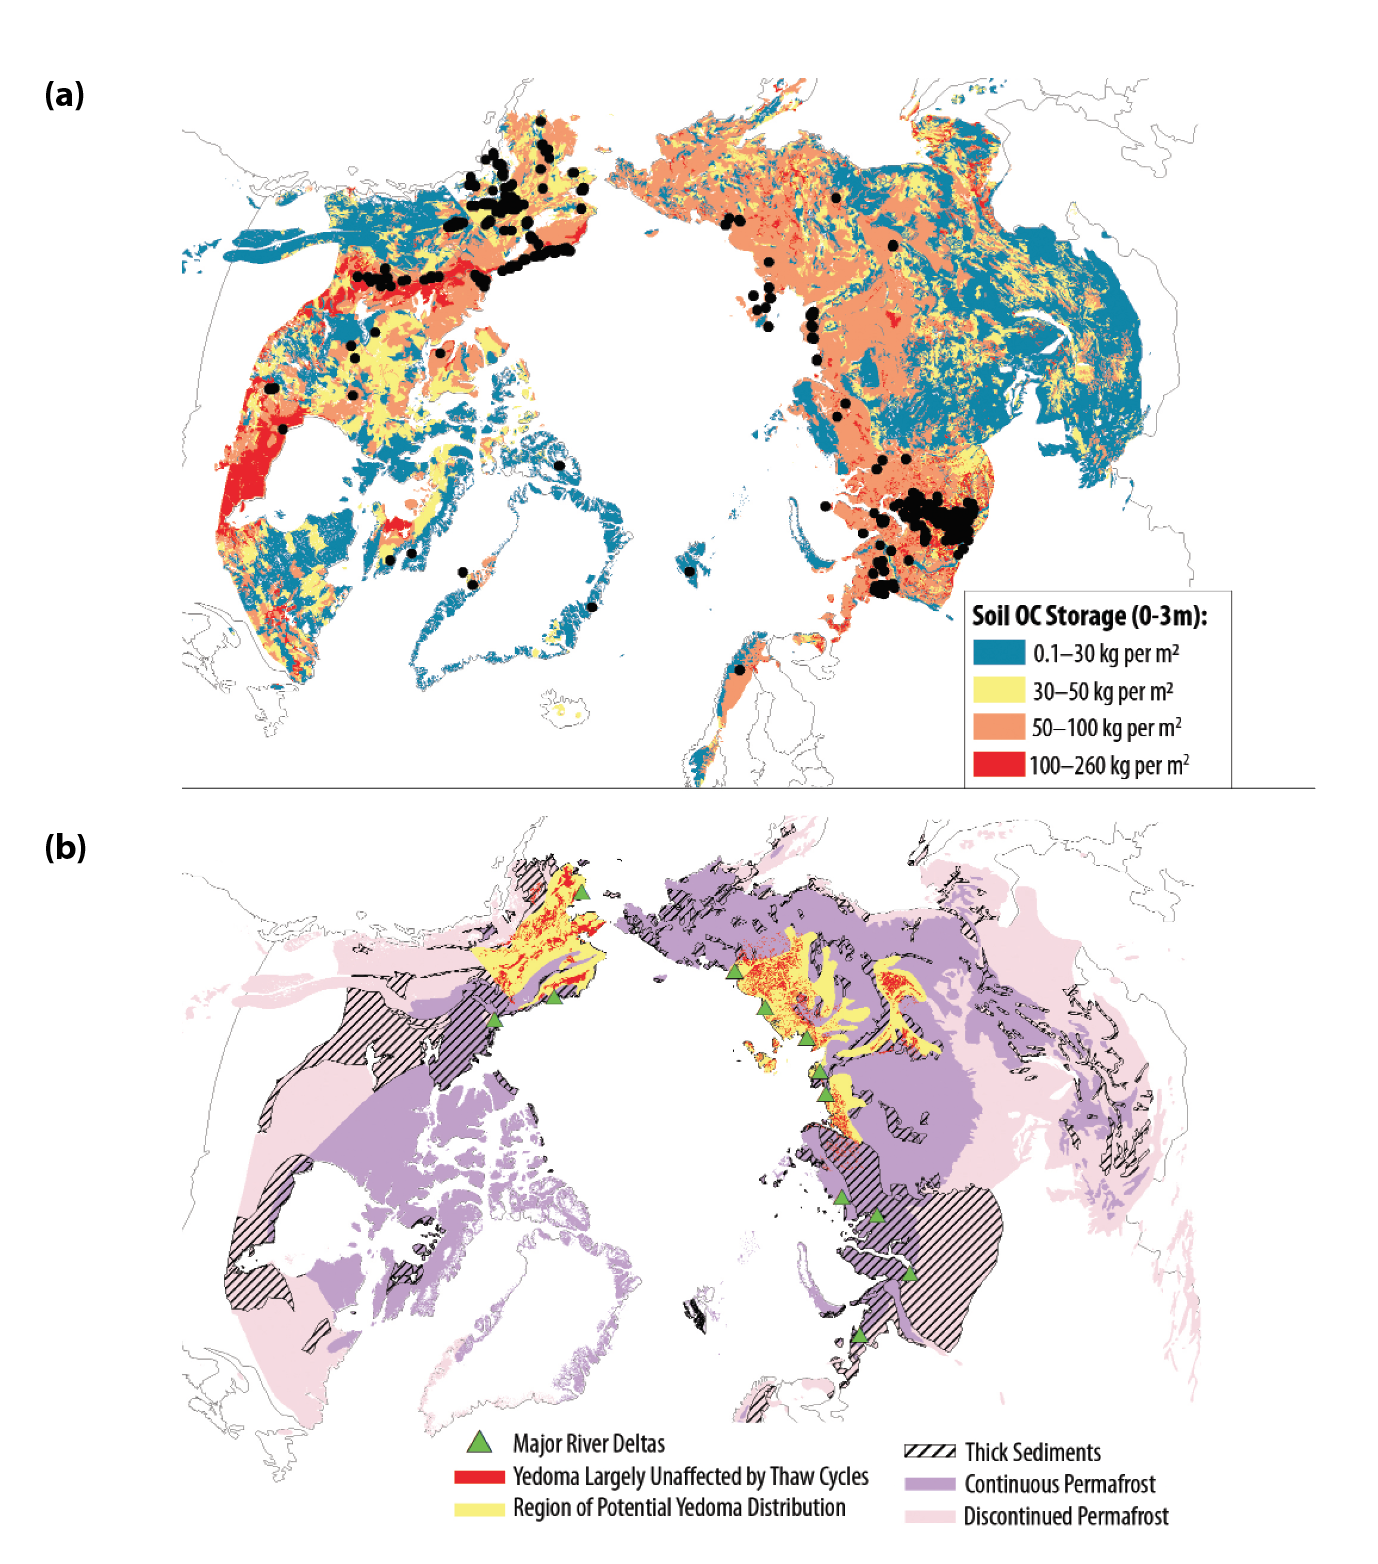
River deltas are now thought to contain 96 ± 55 Pg C, a quantity much less than originally estimated for these deep deposits (Hugelius et al., 2014; Strauss et al., 2017; Tarnocai et al., 2009). However, other deep sediment deposits located over 5 × 10⁶ km2 outside the yedoma and delta areas are not included in the total soil carbon stock reported here. Simple calculations based on extremely limited data suggest that these regions may roughly contain an additional 350 to 465 Pg C, but more sampling and data synthesis are needed to verify or revise estimates of these potential deep permafrost carbon deposits (Schuur et al., 2015; see Figure 11.7b).
Two additional pools of permafrost carbon are not included in the permafrost carbon pool summarized previously. The first are new estimates for the permafrost region of the Tibetan plateau that are built on earlier work (Wang et al., 2008), which now place 15.3 Pg C in the top 3 m of soil (Ding et al., 2016). This new carbon inventory extended deep carbon measurements substantially and used improved upscaling techniques, resulting in a somewhat smaller inventory for Tibetan permafrost than had been reported previously (Mu et al., 2015). An additional 20.4 Pg C are contained in 1-m inventories of permafrost soils in northern China estimated by earlier first-order inventories (Luo et al., 2000) for a total of 35.7 Pg C for this region as a whole.
The second uncounted pool is a reservoir of organic carbon in permafrost stored on the continental shelf under the Arctic Ocean (Brown et al., 1998—revised February 2001; Rogers and Morack 1980). This undersea permafrost carbon initially formed on land as the continental shelf was exposed when sea level was approximately 120 m lower during the last glacial period (Walter et al., 2007). Subsequent inundation of this area at the Pleistocene-Holocene transition started thawing this loess permafrost (Rachold et al., 2007). No reliable published estimates exist for the total organic carbon in this subsea pool (setting aside inorganic CH4 clathrates), but yedoma deposits are thought to have covered much of the shallow shelf during its exposure. Although there are no shelf carbon inventories comparable to those for land, the shallow shelf area exposed as dry land in the area around Alaska and Siberia during the last Ice Age (currently 125 m deep in the ocean) is almost 3 × 10⁶ km2, or about 2.5 times the size of the current terrestrial yedoma region (Brosius et al., 2012; Strauss et al., 2013). At the same time, submergence over thousands of years helped thaw permafrost, exposing organic carbon to decomposition, potentially under anaerobic conditions. These processes and conditions would have converted a portion of the carbon pool to CO2 and CH4, leaving an unknown quantity of organic carbon remaining in both the sediment and the permafrost that persists under the ocean.
Soils in the top 3 m of the rest of Earth’s biomes (excluding Arctic and boreal biomes) contain 2,050 Pg organic carbon (Jobbágy and Jackson 2000). The soil carbon quantified here from the northern circumpolar permafrost zone adds another 50% to this 3-m inventory, even though it occupies only 15% of the total global soil area (Schuur et al., 2015). Making this comparison with deposits deeper than 3 m (such as those in yedoma) is difficult because deeper deposits are not always as systematically quantified in soil carbon inventories outside the permafrost zone. Assuming that permafrost has preserved deep carbon stocks at higher levels than elsewhere on Earth, the proportion of total soil carbon contained in the northern circumpolar permafrost region could be even larger.
11.3.2 Vegetation Carbon Pools
Most carbon stored in the vegetation of northern high latitudes is in boreal forests, which account for one-third of global forests (Pan et al., 2011). Nonsoil carbon pools of the boreal forest consist of deadwood, litter, and above- and belowground live biomass (Pan et al., 2011). The boreal zone, generally defined by latitudes between 45°N and 70°N (Margolis et al., 2015; McGuire et al., 2009; Neigh et al., 2013), is characterized by tundra at the northern boundary and temperate forest, steppe, or prairie at the southern boundary (see Figure 11.4). Spruce, pine, and fir are typical coniferous tree species within the boreal zone mixed with deciduous species of larch, birch, alder, and aspen (Neigh et al., 2013). The North American boreal zone spans a total area of 3.73 × 10⁶ km2, which is one-third of the entire circumpolar boreal zone (11.35 × 10⁶ km2 to 11.93 × 10⁶ km2; see Table 11.2; Neigh et al., 2013; Pan et al., 2011). Biomass estimates for boreal forests mostly exclude root biomass because it is not measured in many inventories. This chapter uses a ratio of 0.27 for root-to-total phytomass (Saugier et al., 2001) and calculates total carbon pools for the boreal zone (see Table 11.2). Numbers are presented for Alaska, eastern and western Canada, and the circumpolar North using the aboveground biomass values reported in Margolis et al. (2015) and Neigh et al., (2013), which combine satellite light detection and ranging (LIDAR), airborne LIDAR, and ground plot estimates.
Table 11.2. Vegetation Carbon Pools for North America and Global Northern High-Latitude Regions
| Vegetation Type | Region/Ecosystem | Vegetation Carbon Pool (Pg C) | Area (× 106 km2) |
|---|---|---|---|
| Boreal Forest | Alaska | ||
| Wetlands | 0.09 | 0.06 | |
| Hardwood | 0.3 | 0.05 | |
| Conifer | 0.79 | 0.21 | |
| Mixed Wood | 0.24 | 0.05 | |
| Burned | 0.02 | 0.01 | |
| Total Alaska | 1.51 | 0.37 | |
| Canada | |||
| Wetlands | 1.61 | 0.78 | |
| Hardwood | 1.84 | 0.27 | |
| Conifer | 6.87 | 1.7 | |
| Mixed Wood | 3.05 | 0.53 | |
| Burned | 0.14 | 0.04 | |
| Total Canada | 13.56 | 3.36 | |
| Circumboreal | |||
| Wetlands | 2.21 | 1.25 | |
| Hardwood | 2.44 | 0.37 | |
| Conifer | 27.6 | 7.28 | |
| Mixed Wood | 19.26 | 2.84 | |
| Burned | 0.48 | 0.18 | |
| Total Circumboreal | 52.05 | 11.93 | |
| Tundra | Alaska | 0.35 | 0.48 |
| Canada | 1.01 | 2.34 | |
| Total Circumpolara | 3.17 | 4.98 | |
Boreal forest vegetation carbon includes carbon in above- (Neigh et al., 2013) and belowground live biomass. Belowground numbers were calculated based on root–to–total biomass ratios (after Saugier et al., 2001). Ratios are 0.27 for boreal forests and 0.62 for tundra biomass. Tundra area data exclude ice caps and large water bodies (Raynolds et al., 2012). Estimates for deadwood carbon and litter carbon pools are reported in the main chapter text. Totals are reported from the original publication (Neigh et al., 2013) and, in some cases, may not match the component sums exactly due to rounding differences.
Notes
a Total circumpolar also includes estimates for Eurasia (data not shown). Eurasia quantities are equivalent to the total minus
Half the carbon in Alaska and Canada’s boreal zone is stored in coniferous forests; this is also true for the entire circumpolar region (7.66 Pg C in North America; see Table 11.2). The second largest forest type is “mixed wood” (i.e., coniferous and deciduous trees) followed by “hardwood” (i.e., deciduous trees), which together account for 35% to 42% of the total boreal vegetation carbon stocks. A small portion of vegetation carbon in the boreal zone is found in the biomass of wetlands (5% to 12%) and in burned areas (about 1%). A separate synthesis reported 14.0 Pg C for all living biomass (both above and below ground) in Canada, covering 2.29 × 10⁶ km2; Pan et al., 2011). Estimates for that synthesis were based on forest inventory data; growth and yield data; and data on natural disturbances, forest management, and land-use change. Because forest inventory data were used, areas covering 1.18 × 10⁶ km2 of unmanaged boreal forest in Canada and 0.51 × 10⁶ km2 of unmanaged forest in Alaska were excluded, but, in general, the stock-based carbon numbers are similar to the remotely sensed estimates for Canada and the circumpolar North. Discrepancies in carbon pools could arise from different measurement approaches and the known limitations of satellite-based LIDAR measurements in steep topography (Margolis et al., 2015).
The Arctic tundra vegetation zone is north of the boreal tree line, extending all the way above 80°N latitude in the Canadian High Arctic and is described in detail in the circumpolar Arctic vegetation map (see Figure 11.4; Walker et al., 2009). Recent estimates quantified a total vegetated area of 4.98 × 10⁶ km2 in the circumpolar tundra zone, of which a little less than half is in Canada and about 10% in Alaska (see Table 11.2; Raynolds et al., 2012). Tundra vegetation mostly consists of shrubland, peaty graminoid tundra, mountain complexes, barrens, graminoid tundra, prostrate shrubs, and wetlands (Walker et al., 2009). Using a relationship of aboveground biomass and the normalized difference vegetation index (NDVI), the North American tundra zone is estimated to contain 1.03 Pg C in aboveground plant biomass (0.27 Pg C in Alaska and 0.76 Pg C in Canada; Raynolds et al., 2012). Assuming that 62% of the total tundra biomass is below ground (Saugier et al., 2001) and half the biomass is carbon (Epstein et al., 2012), there is a total carbon stock of 1.36 Pg C contained in North American tundra vegetation (see Table 11.2). For the entire circumpolar region, this amount is equal to 3.17 Pg C. There is an offset in land area between the soil carbon and vegetation carbon estimates of 0.89 × 10⁶ km2, which is likely either non-Arctic (sub-Arctic or alpine) tundra or sparse conifer forest (taiga). Using tundra carbon pools as a low-end estimate, there could be another 0.57 Pg C in vegetation biomass contained on these lands but not reported in Table 11.2.
Earlier estimates for vegetation carbon in northern high latitudes reported 5 Pg C in Alaska, 12 Pg C in Canada, and 60 to 70 Pg C for the circumpolar North (McGuire et al., 2009). Although previous carbon estimates for Canada and the circumpolar North are relatively similar to the new remotely sensed and inventoried estimates reported here, the 5 Pg C estimate for Alaska is higher. Combining the latest boreal and tundra vegetation estimates, North American high-latitude areas, which are 30% of the entire circumpolar region, contain 16.43 Pg C in vegetation (15.07 Pg C boreal; 1.36 Pg C tundra).
Deadwood and litter are two nonsoil carbon pools poorly constrained by data at regional and continental scales. The deadwood pool has been estimated (in 2007) at 16.1 Pg C for a region of the boreal forest covering 11.35 × 10⁶ km2, again excluding 1.18 × 10⁶ km2 of unmanaged boreal forest in Canada and 0.51 × 10⁶ km2 of unmanaged forest in Alaska (Pan et al., 2011). This same boreal region was estimated to contain a litter carbon pool of 27.0 Pg C, which together with deadwood represents at least 83% of the carbon contained in the living above- and belowground biomass. An older modeling study estimated tundra litter to contribute 2 Pg C at the circumpolar scale (Potter and Klooster 1997).
See Full Chapter & References