<b>Schuur</b>, E. A. G., A. D. <b>McGuire</b>, V. <b>Romanovsky</b>, C. Schädel, and M. Mack, 2018: Chapter 11: Arctic and boreal carbon. In Second State of the Carbon Cycle Report (SOCCR2): A Sustained Assessment Report [Cavallaro, N., G. Shrestha, R. Birdsey, M. A. Mayes, R. G. Najjar, S. C. Reed, P. Romero-Lankao, and Z. Zhu (eds.)]. U.S. Global Change Research Program, Washington, DC, USA, pp. 428-468, https://doi.org/10.7930/ SOCCR2.2018.Ch11.
Arctic and Boreal Carbon
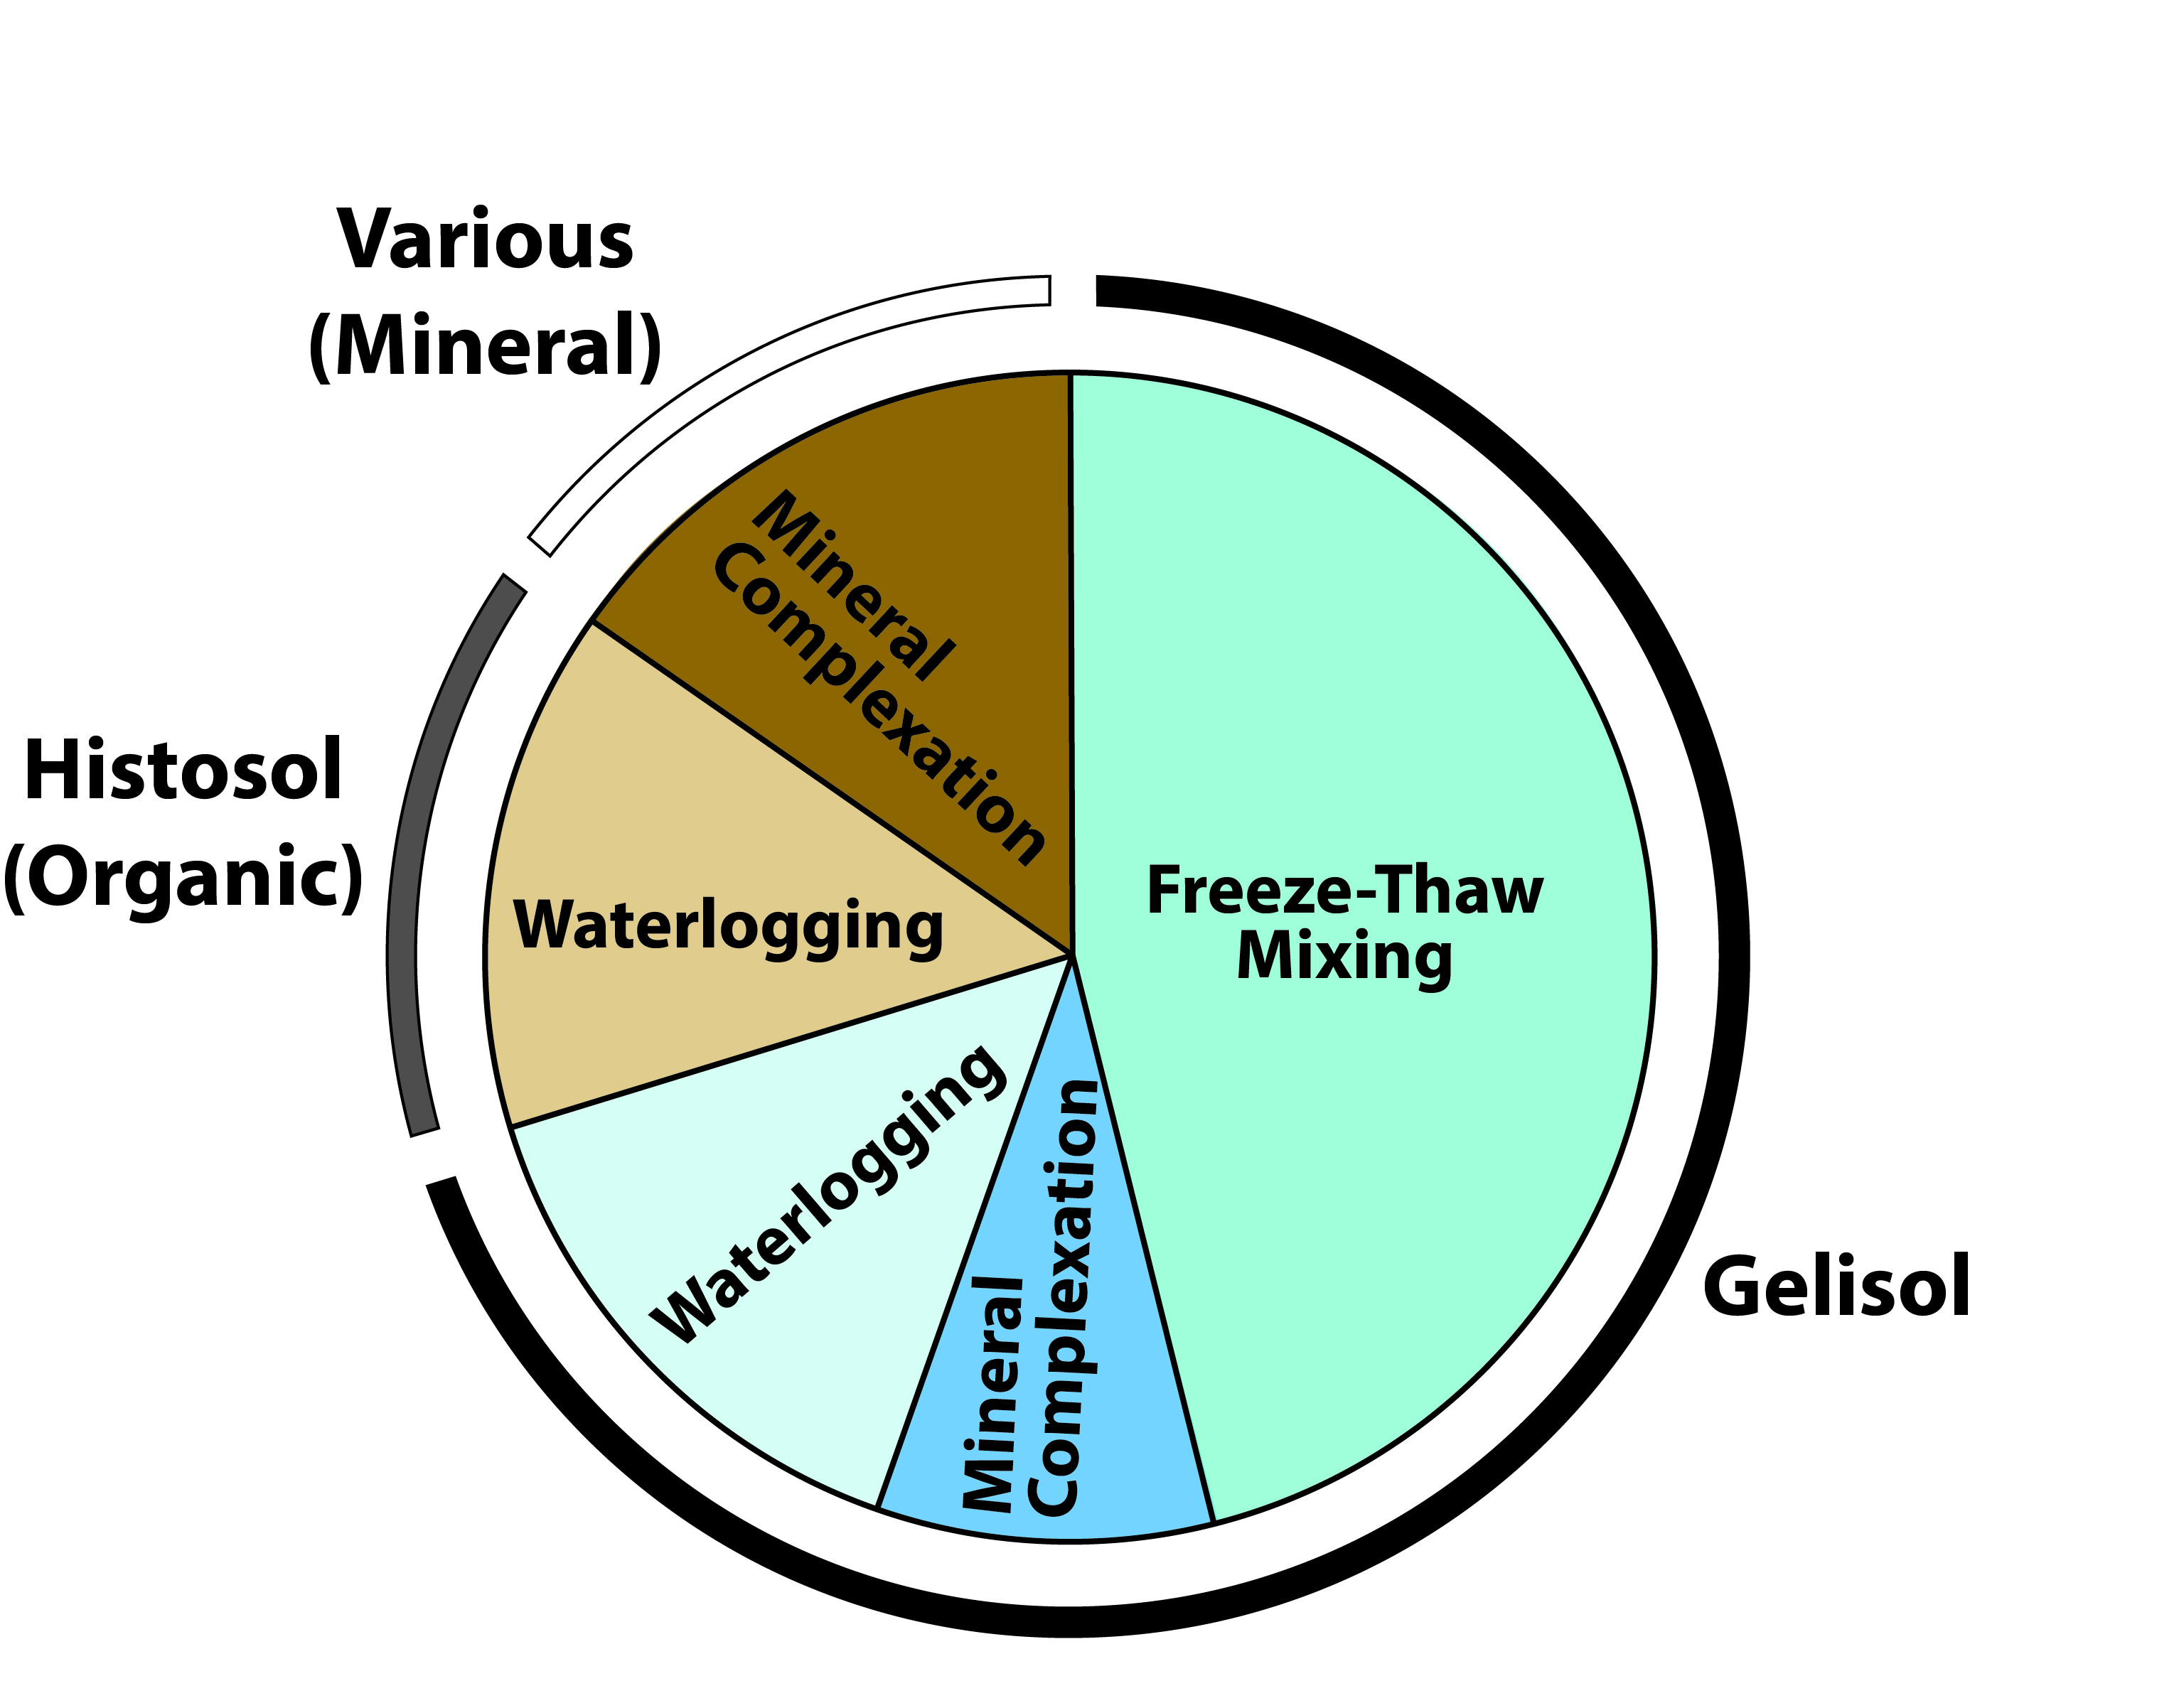
A unique feature of carbon pools in the northern permafrost zone compared with those in other biomes is the predominance of carbon stored in soils as a proportion of the total ecosystem carbon stock (Chapin et al., 2011). This feature partly arises from the harsh environmental conditions and short growing season that limit plant biomass. Boreal forest often is characterized by low tree density (i.e., stems per hectare) and small tree size, while tundra comprises low-statured vegetation including dwarf shrubs and graminoids with an understory of mosses (Dixon et al., 1994). Despite low plant biomass and low primary production (i.e., the amount of new carbon that plants transfer into the ecosystem annually), ecosystem carbon storage can be largely due to the tremendous quantity of carbon stored as soil organic matter. This organic matter is the remains of plants, animals, and microbes that have lived and died in these ecosystems over hundreds to thousands of years. Soil carbon accumulates in all systems (see Ch. 12: Soils), and the overall mechanisms of soil carbon preservation are the same at high latitudes (Post et al., 1982). What makes soil carbon density particularly high in these biomes is the combination of frozen soils (either seasonally in the surface soil active layer or perennially in the permafrost) and waterlogging that restricts the resupply of oxygen below ground (Gorham 1991; Jones et al., 2017; Treat et al., 2016). Cold and water-saturated conditions reduce organic matter decomposition rates, leading to substantial soil carbon accumulation even though annual inputs of new carbon by plants is relatively low (see Figure 11.5; Hobbie et al., 2000). In fact, water-saturated soils are a common feature of high-latitude ecosystems, even beyond those defined as wetlands. This saturation results from restriction of the downward movement of surface water by permafrost, creating a perched water table within the soil profile of mesic and drier upland ecosystems as well as lowland ecosystems. Waterlogged and frozen conditions slow both microbial decomposition and combustion by fire, which are primary mechanisms returning carbon from the soil back to the atmosphere. Both of these environmental conditions that slow decomposition increase in magnitude, intensity, and effect moving down into the soil profile. In addition, soil waterlogging also helps to control whether carbon returns to the atmosphere as carbon dioxide (CO2) or methane (CH4), both of which are important GHGs exchanged between high-latitude terrestrial ecosystems and the atmosphere.
Figure 11.5: Mechanisms of Soil Carbon Stabilization Associated with Different Soil Orders in the Northern Circumpolar Permafrost Zone
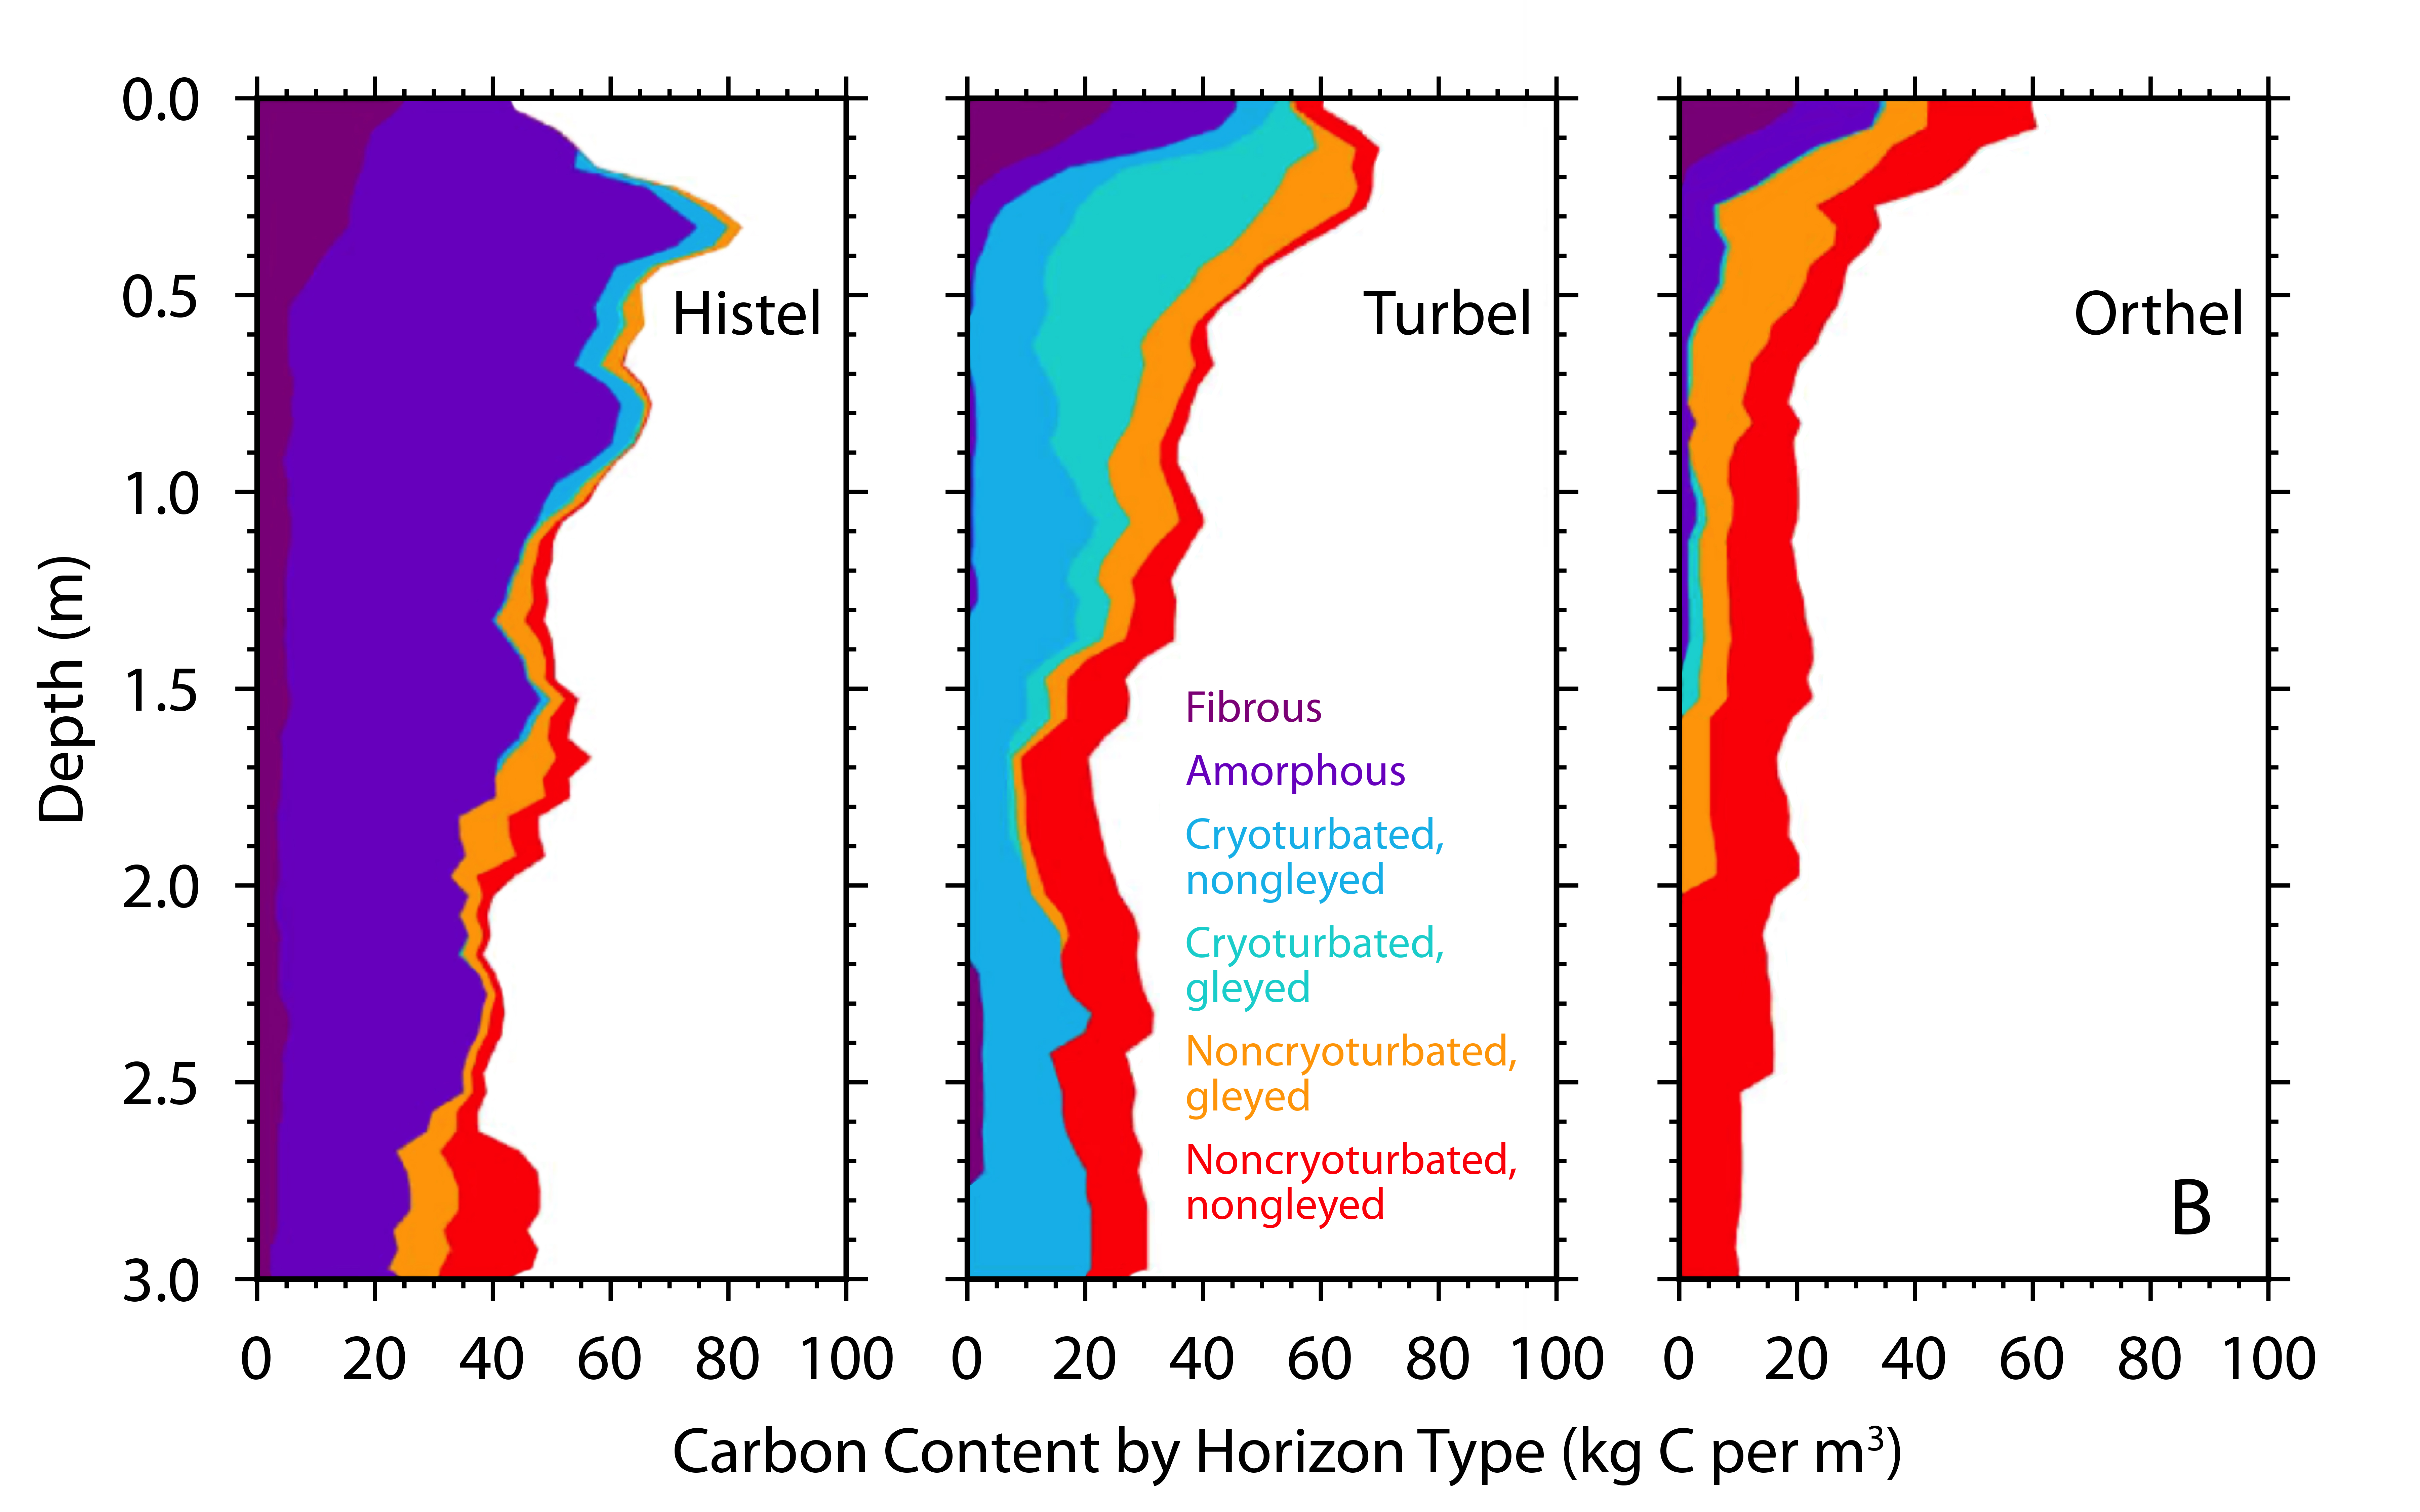
Several features of soil development in the permafrost zone have the effect of transporting carbon from the surface (where it enters the ecosystem through plant tissue turnover and mortality) to depth (see Figure 11.6; Schuur et al., 2008). Freeze-thaw mixing (cryoturbation) occurs in permafrost soils. Cold air temperatures in the fall begin freezing soils from the surface downward, while the permafrost at depth simultaneously refreezes soils at the base of the active layer upward. This process exerts pressure on the middle soil layer that can push soil upward to release pressure through cracks to the surface. As a result, surface carbon is mixed at high concentrations deeper into the soil profile than it otherwise would have been, effectively increasing the limiting factors of temperature and waterlogging on decomposition. Another landscape-level feature of soil development that leads to relatively high carbon at depth is the upward accumulation of soil and permafrost that occurs in high latitudes, particularly regions not covered by ice during the last glacial period, which peaked roughly 20,000 years ago (Schirrmeister et al., 2002). Ice sheets covered large areas of Canada, Eurasia, and Greenland, but in Alaska, Siberia, and Beringia (i.e., the land connection between the two continents that was exposed by lower sea levels), a large swath of land remained free of ice because of dry conditions and low precipitation. These unglaciated areas received deposits of silt material generated at the margins of ice sheets and glaciers and transported by wind and water. Sediment accumulated in some areas at rates of centimeters per year, which effectively increased soil surface elevation. Permafrost depth in these soils is controlled, in part, by the insulating effect of the overlying soil, and, with increased soil elevation, the permafrost table also moved upward, which trapped plant roots and other organic matter at depth into permafrost (Zimov et al., 2006). Additionally, these soils accumulated carbon over tens to hundreds of thousands of years, whereas ecosystems covered by ice sheets in the Last Glacial Maximum only started accumulating their current soil carbon stocks since the transition to the Holocene (Harden et al., 1992). Length of time for carbon accumulation, however, is not as important as some of the direct limits to microbial decomposition, in terms of overall soil carbon stocks. For example, large areas such as the Hudson Bay Lowlands and the Western Siberian peatlands accumulated high carbon stocks since the retreat of ice sheets in the last 10,000 years because of persistent waterlogged conditions (Smith et al., 2004; Loisel et al., 2014). Lastly, the direct human footprint on carbon pools and fluxes in this region is small relative to other biomes. More than 80% of tundra and boreal biomes fall into the land-use categories of “remote forest,” “wild forest,” “sparse trees,” and “barren” (Ellis and Ramankutty 2008). Forest harvest is the primary land-use activity affecting ecosystem carbon, with fire management also playing a role, but both occur on a relatively small proportion of the overall region. More broadly, impacts to the region’s carbon cycle more likely occur indirectly through 1) changes in climate, such as temperature, precipitation, and growing season length; 2) changes in pulse disturbances, such as wildfires, abrupt thaw, and insects; and 3) rising atmospheric CO2, which has the potential to alter ecosystems everywhere.
Figure 11.6: Soil Carbon Distribution in Major Suborders of the Gelisol Soil Order
See Full Chapter & References