<b>Pendall</b>, E., D. Bachelet, R. T. Conant, B. El Masri, L. B. Flanagan, A. K. Knapp, J. Liu, S. Liu, and S. M. Schaeffer, 2018: Chapter 10: Grasslands. In Second State of the Carbon Cycle Report (SOCCR2): A Sustained Assessment Report [Cavallaro, N., G. Shrestha, R. Birdsey, M. A. Mayes, R. G. Najjar, S. C. Reed, P. Romero-Lankao, and Z. Zhu (eds.)]. U.S. Global Change Research Program, Washington, DC, USA, pp. 399-427, https://doi.org/10.7930/SOCCR2.2018.Ch10.
Grasslands
10.2.1 Grassland Carbon Stocks and Fluxes
Key Finding 1 is based on estimates of carbon stocks and fluxes as determined by upscaling inventories with remote-sensing products and modeling approaches. This section of the chapter describes the current understanding of carbon stocks and fluxes, and later sections evaluate the processes responsible for changes in these pools and fluxes.
Continental Scale
Terrestrial biosphere models are important tools for understanding how the carbon cycle responds to changes in climate, nutrient availability, and land use. Modeled rates of uptake or loss are dependent on a given region’s processes and area. A multimodel synthesis study estimated that North American grassland acted as a carbon sink, with an average uptake rate of 38 grams of carbon (g C) per m2 per year during the first 5 years of this century (Raczka et al., 2013). A similar synthesis of 17 land-surface models (LSMs) showed that North American grasslands acted as carbon sinks (see Table 10.1) from 2000 to 2006 (Hayes et al., 2012). Atmospheric inversion models (AIMs) also predicted a carbon sink for North American grasslands but at a rate roughly twice the magnitude compared to that in land-surface models (see Table 10.1; Hayes et al., 2012). At the national level, carbon sinks are proportional to the area in grasslands and reflect different management and climate conditions. U.S. grasslands contribute the continent’s largest sink, followed by those in Canada, with Mexican grasslands approaching carbon-neutral status.
Similar to the modeled estimates, inventory analyses also suggest that Canadian and U.S. grasslands are carbon sinks (see Table 10.1; Hayes et al., 2012). The differences in estimated carbon sink magnitude between these approaches could stem from estimating fluxes using changes in stocks (i.e., inventory methods) versus changes in atmospheric CO2 concentrations (i.e., AIMs) or carbon cycle processes (i.e., LSMs), or from extrapolating fluxes over different land areas. Furthermore, most previous LSMs have not considered effects of land-use change and fire suppression, both which are implicit in AIM analyses. Inventories might miss these effects if they consider only areas that remain as grasslands. Recent LSM simulations indicate that fire suppression reduces areal extent of grasslands in the conterminous United States and allows woody biomass to encroach (Bachelet et al., 2017). A recently developed remote-sensing method discovered 300% more burned areas in the Great Plains than did the previous method for the 1984 to 2013 period (Hawbaker 2017). These examples demonstrate that considering disturbance and land-use effects is key to reducing uncertainties in inventories and model projections of carbon cycling. Section 10.5 discusses these societal impact questions in more detail.
Conterminous United States
Various efforts on scaling up flux tower observations and biogeochemical modeling mostly confirm that U.S. grasslands typically have been a carbon sink in recent years (Liu et al., 2012b, 2014; Xiao et al., 2014; Zhang et al., 2011; Zhu et al., 2011). By scaling up flux tower observations, Zhang et al. (2011) showed that the Great Plains, which makes up the majority of U.S. grasslands, was a net sink from 2000 to 2008, with an average net uptake of 24 ± 14 g C per m2 per year (i.e., annual uptake varied from 0.3 to 47.7 g C per m2 per year). The result was consistent with a similar study over North America that showed U.S. grasslands were a net carbon sink from 2001 to 2012 (Xiao et al., 2014). However, a recent biogeochemical modeling study suggested that U.S. grasslands during 2001 to 2005 lost 3 teragrams of carbon (Tg C) per year, amounting to about 120 g C per m2 averaged over the conterminous United States (Wang et al., 2015). These contrasting results, along with the differences shown in Table 10.1 indicate a discrepancy between modeling estimates and empirical, data-driven values that contribute to uncertainty in grassland carbon cycling rates.
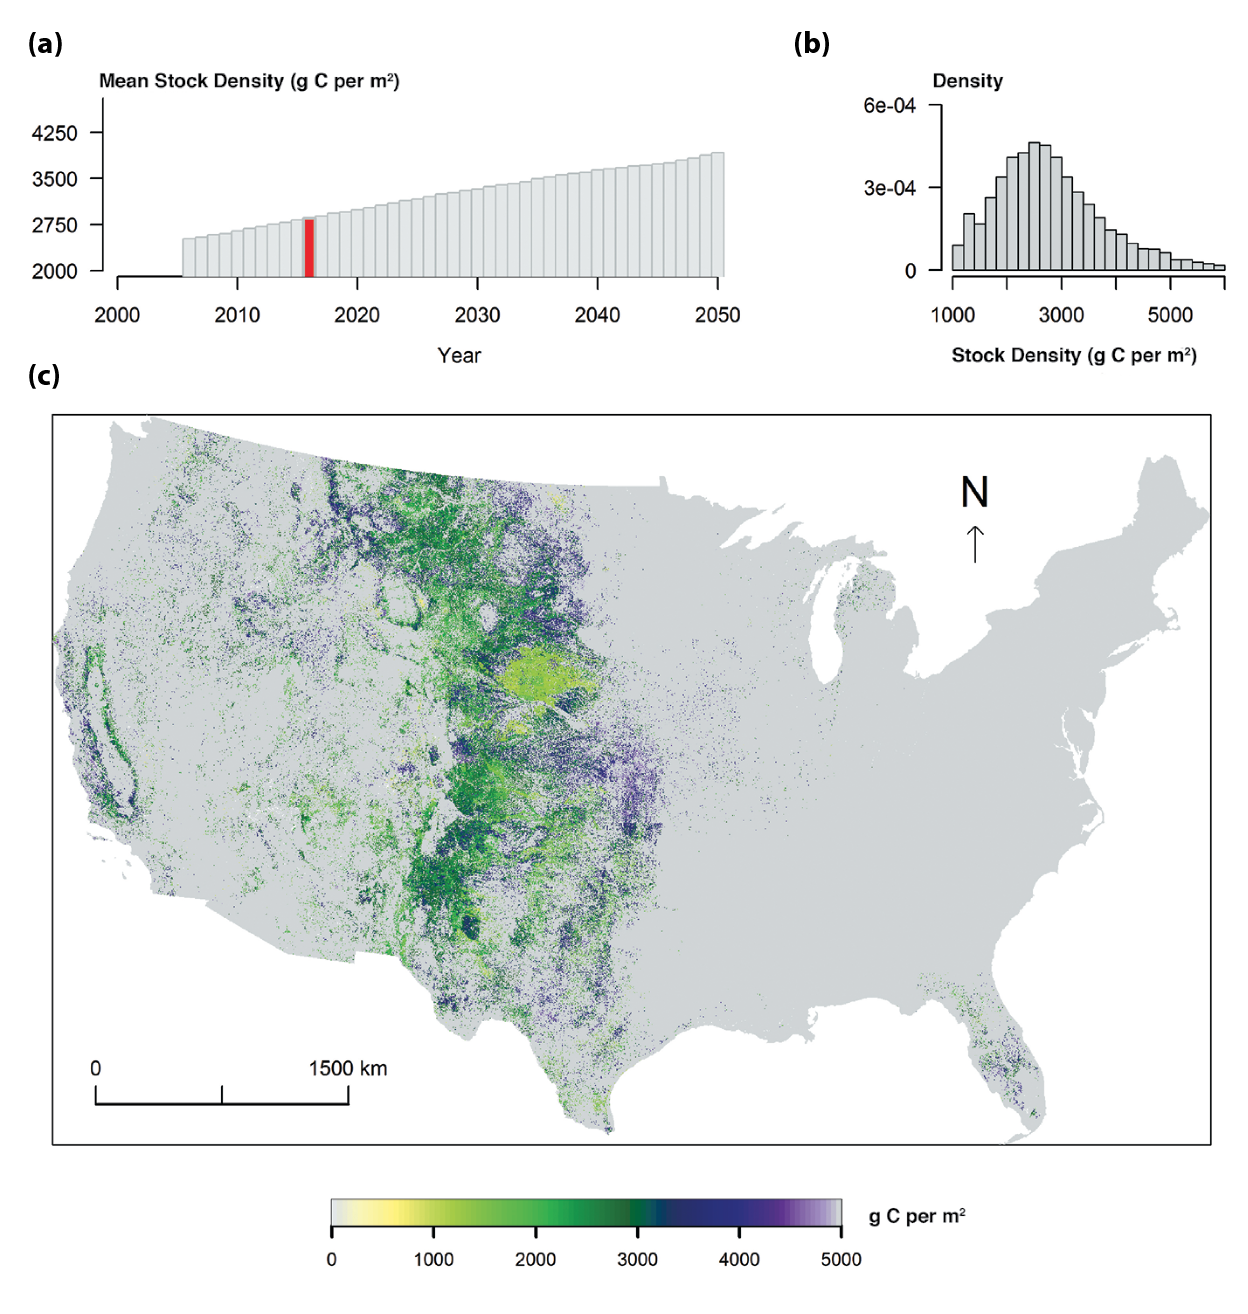
Figure 10.2: Model Simulation of Total Carbon Storage in U.S. Grasslands, 2016
The LandCarbon project (www2.usgs.gov/climate_landuse/land_carbon) provided a national ecosystem carbon sequestration assessment conducted by the U.S. Geological Survey (USGS) in response to requirements of the Energy Independence and Security Act of 2007 (EISA; H.R. 6 — 110th Congress 2007). The objective of the EISA assessment was to evaluate policy-relevant carbon sequestration capacity in terrestrial ecosystems through management or restoration activities. Climate, land-cover change, and fire disturbance were included in the carbon assessment. Grassland and shrubland assessments were combined for this chapter. U.S. national summaries for 2001 to 2005 and 2006 to 2050 are shown in Table 10.2 and Figure 10.2. These projections represent simulation results using:
Table 10.2. Carbon Fluxes and Stocks for Grasslands and Shrublands in the Conterminous United States (Summarized from the LandCarbon Project, landcarbon.org/categories)
| Time Period | Biomassa | Soilb | Otherc | Total | Area (106 km2) | |
|---|---|---|---|---|---|---|
| Annual Flux (Tg C per Year)d | ||||||
| 2000–2005 | +7.2 | –45.5 | –16.3 | –54.7 | 2.66 | |
| 2005–2050 | +5.8 | –20.1 | –7.6 | –21.8 | 2.51 | |
| Total Carbon Stock (Tg C)d | ||||||
| 2005 | 1,362.1 | 5,090.4 | 958.6 | 7,411.1 | 2.66 | |
| 2050 | 1,090.4 | 6,021.8 | 1,072.3 | 8,184.5 | 2.51 | |
Notes
a Biomass includes aboveground and belowground live plant parts.
b Soil stocks consider the top 20 cm.
c Other includes leaf litter and woody debris.
d Values, in teragrams of carbon (Tg C), are averages of the A1B, A2, and B1 climate scenarios and estimated using the FOREcasting SCEnarios of land-use change (FORE-SCE) model and the Erosion-Deposition-Carbon-Model (EDCM), CENTURY,
and PBN carbon models (Liu et al., 2012b, 2014; Zhu et al., 2011). A negative carbon flux represents net ecosystem carbon
uptake, while a positive carbon flux indicates carbon loss from the ecosystem.
Climate change data from the Model for Interdisciplinary Research on Climate (MIROC) general circulation model under three emissions scenarios (i.e., A1B, A2, and B1; IPCC 2000);
Land-cover change data from the FOREcasting SCEnarios of land-use change (FORE-SCE) model (Sohl et al., 2007); and
Three biogeochemistry models: ErosionDeposition-Carbon Model (EDCM), CENTURY, and PBN (Liu et al., 2012b, 2014; Zhu et al., 2011).
Although the USGS LandCarbon Project currently does not include new representative concentration pathway (RCP) scenarios in its biological carbon sequestration assessment, the project considers climate projections for temperature and precipitation to be quite similar between the IPCC (2000) and RCP scenarios (Knutti and Sedláček 2013).
Figure 10.2 shows the estimated spatial pattern of carbon stocks in vegetation and soil in the top 20-cm layer in 2016 and the temporal change of the mean U.S. grassland carbon stock from 2005 to 2050 under the Intergovernmental Panel on Climate Change (IPCC) scenario A1B (IPCC 2000), estimated using the EDCM model (Liu et al., 2011, 2014; Zhu et al., 2011). More information about the methodology and results from other carbon models and scenarios can be found in a series of reports (Zhu and Reed 2012, 2014; Zhu et al., 2011) and the LandCarbon project (www2.usgs.gov/climate_landuse/land_carbon). The majority of U.S. grassland is distributed in the central Great Plains ecoregion, California, and central Florida, with large spatial variability in carbon stocks. At the U.S. national scale, the mean carbon stock was projected to increase over time (see Figure 10.2).
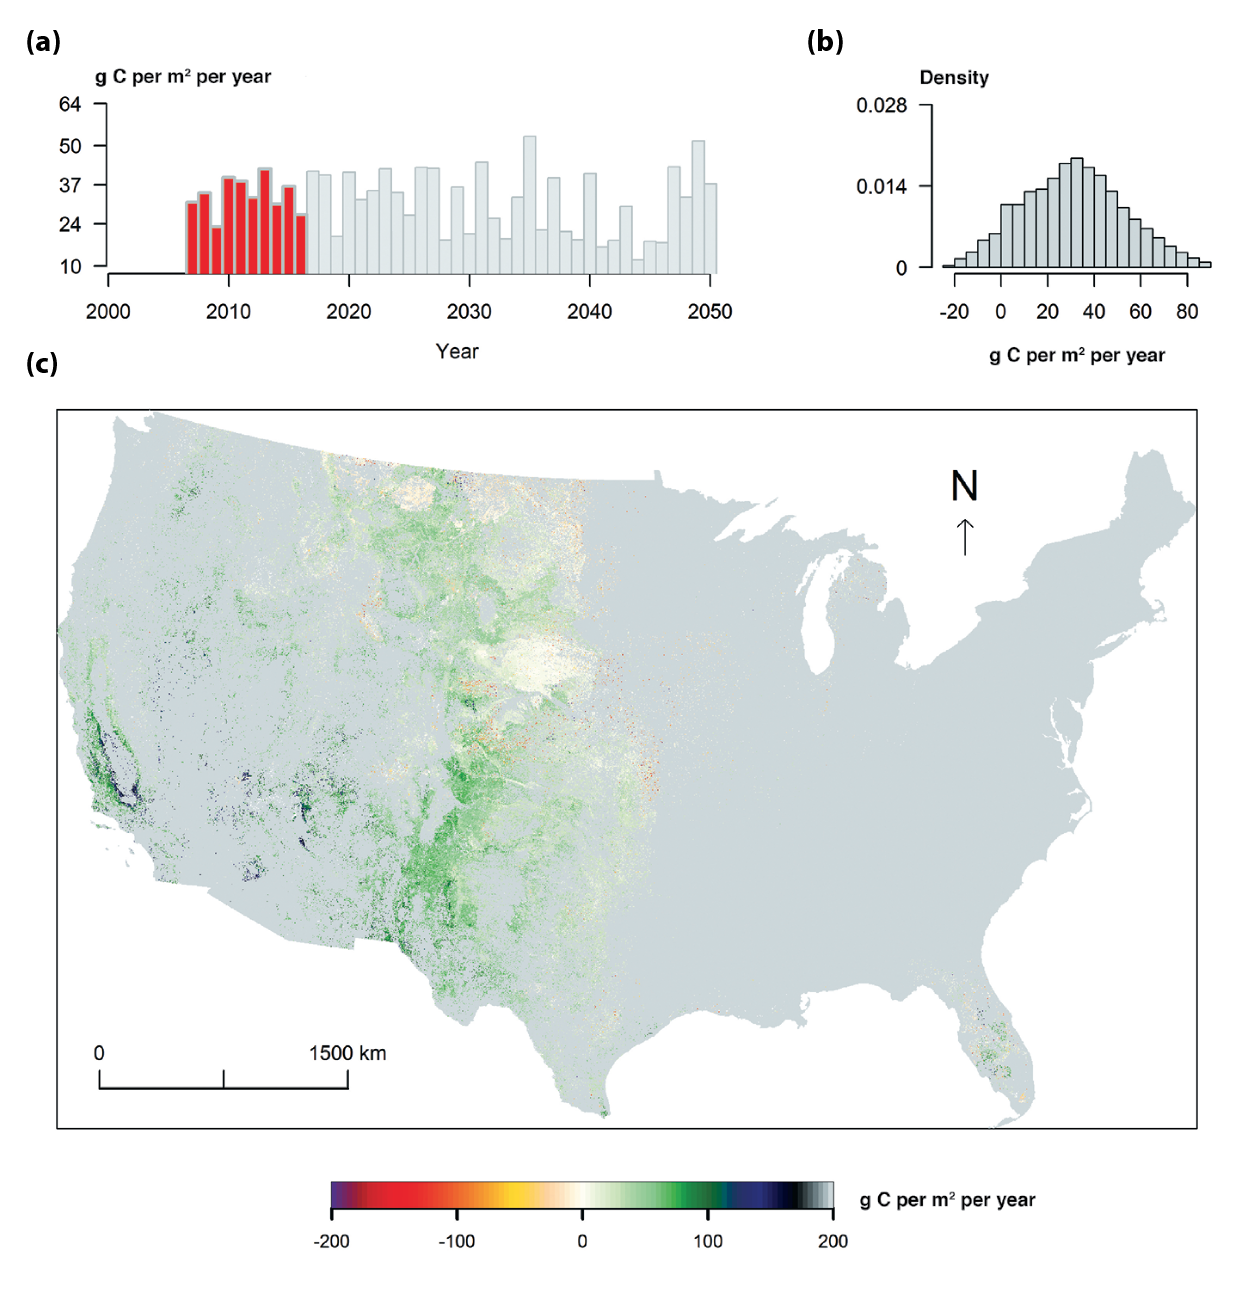
The spatial distribution of the current decadal mean rate of the grassland NECB is shown in Figure 10.3. The average annual carbon uptake varied from 15 to 40 g C per m2 per year with a decreasing trend after 2030 under scenario A1B (see Figure 10.3). Carbon stocks were projected to continue increasing until mid-century despite declining NECB. The clear spatial pattern of the carbon fluxes from 2007 to 2016 is characterized by 1) carbon-neutral status (e.g., the Nebraska Sandhills in the central United States), 2) carbon losses mostly in north-central United States, and 3) carbon uptake mostly in the midwestern United States and California. The carbon dynamics since 2005 were simulated using the MIROC climate projections. Consequently, the simulated NECB and its spatial pattern might be different from reality, especially in the severely drought impacted areas of California in recent years.
Figure 10.3: Model Simulation of Net Ecosystem Carbon Balance (NECB) for U.S. Grasslands in Response to Intergovernmental Panel on Climate Change Scenario A1B
Regional Scale: Great Plains Ecoregion as a Case Study
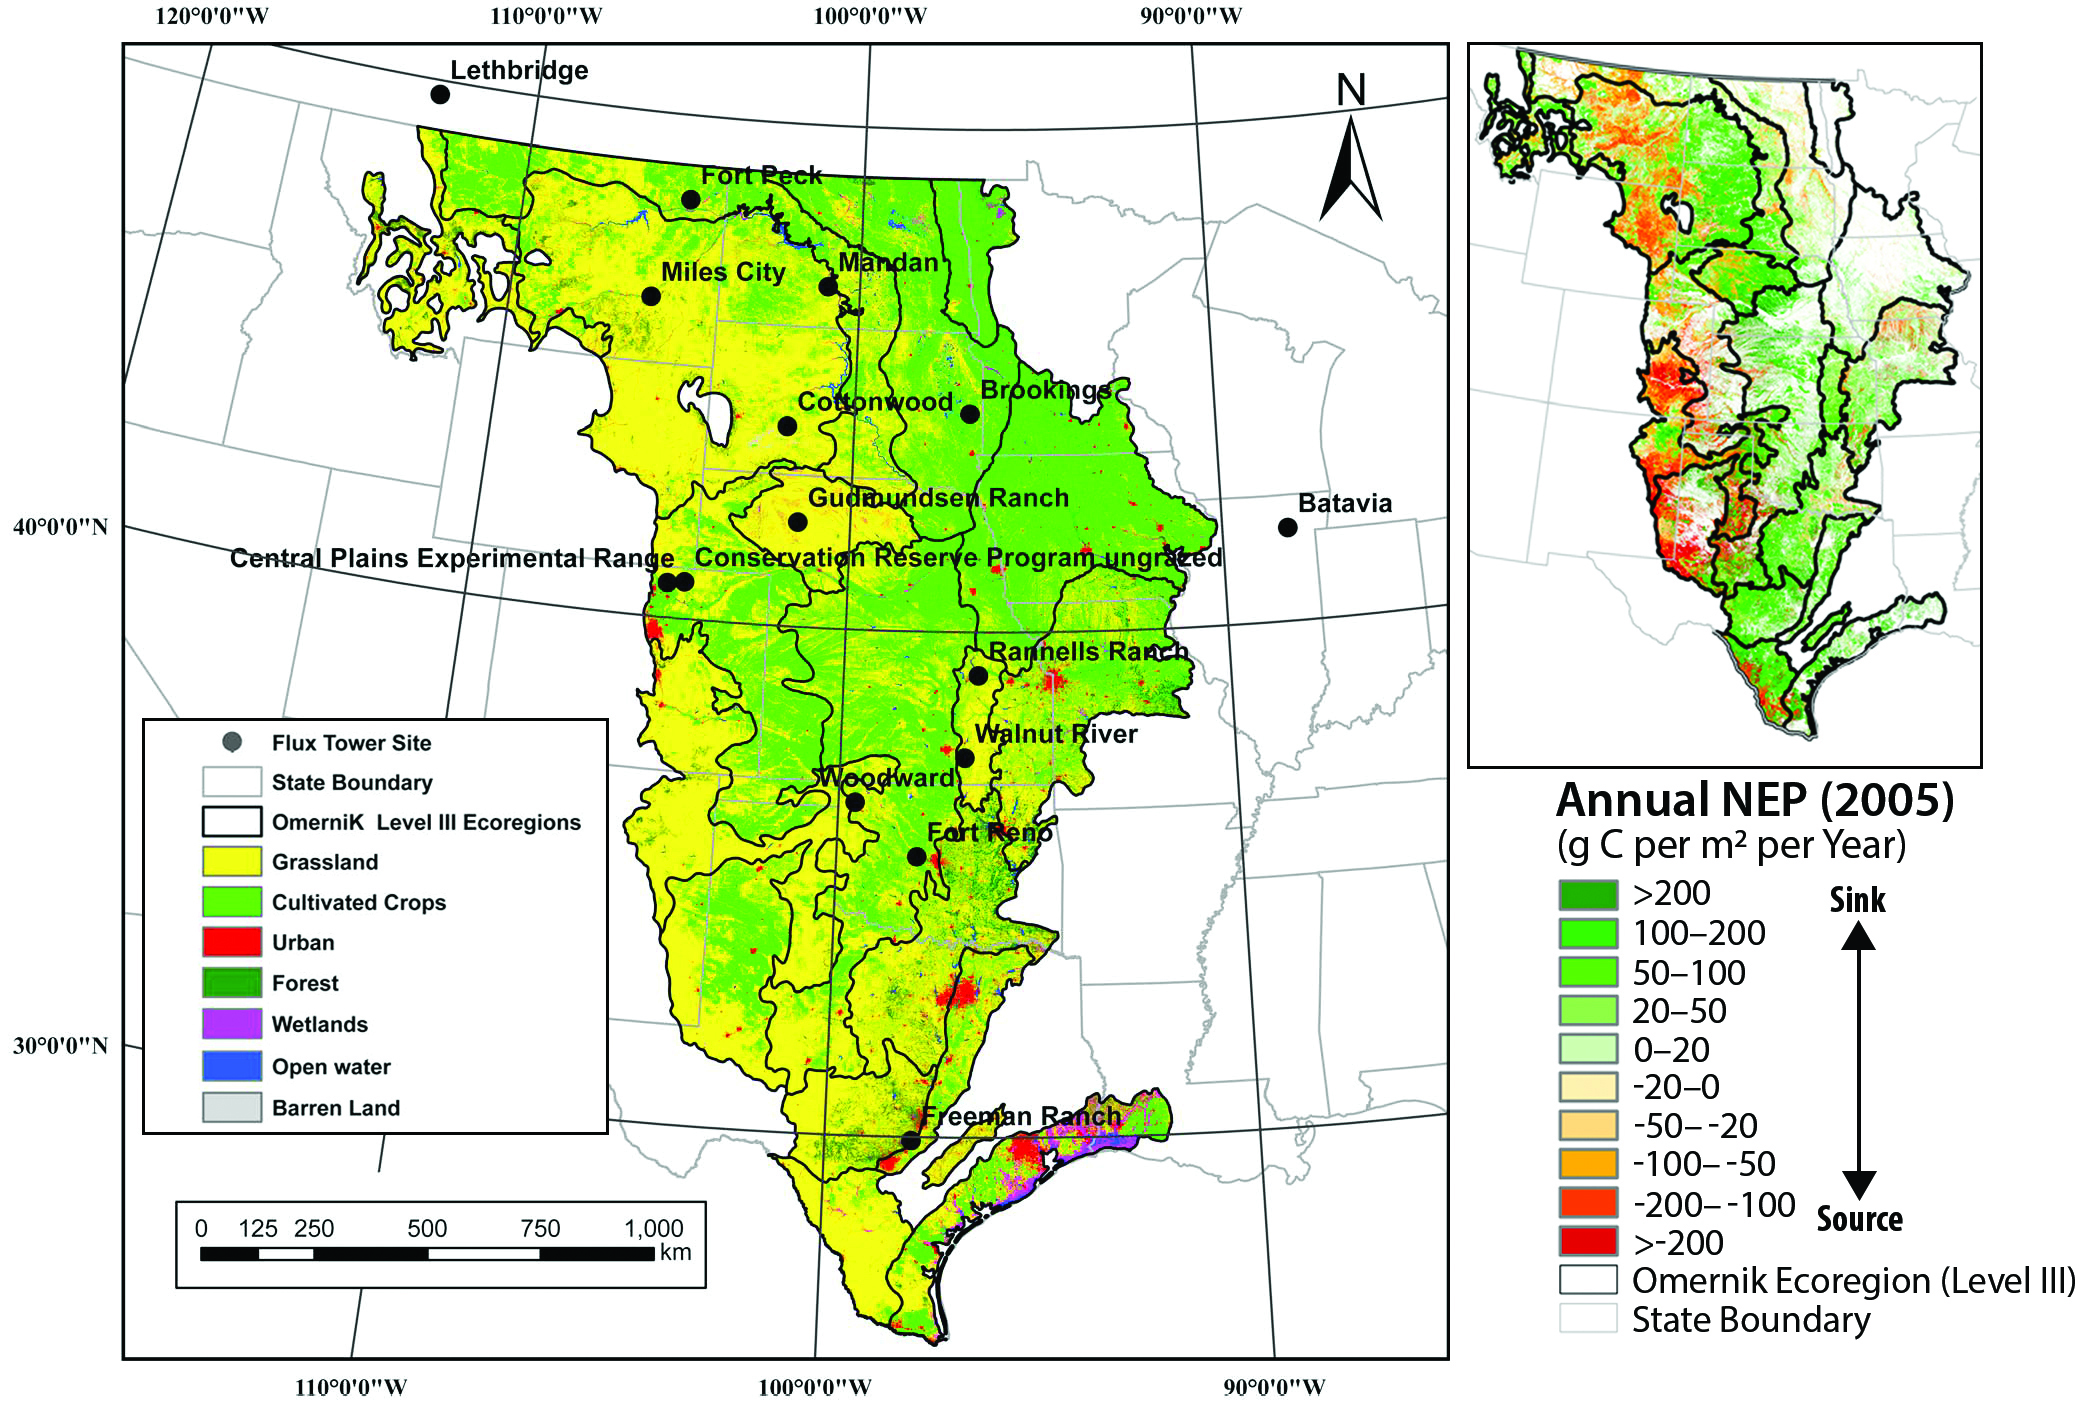
The Great Plains, comprising 2.17 million km2 are dominated by grasslands, interspersed with shrublands, that account for 48% of the total area, while agricultural lands cover 42% of the total area (Zhu et al., 2011; see Figure 10.4). Zhang et al. (2011) integrated remotely sensed vegetation greenness and weather datasets from 2000 to 2008 with NEP data from 15 eddy covariance flux tower sites to scale up and calculate a carbon budget for the Great Plains biome. The entire Great Plains was shown to have an average (± standard deviation) uptake rate of 24 ± 14 g C per m2 per year (i.e., a range of 0.3 to 47.7 g C per m2 per year). While the carbon uptake by the Great Plains was lower in the dry years, the entire biome remained a net carbon sink in 8 of the 9 years (Zhang et al., 2011). This study illustrated that, despite significant interannual and spatial variation, mature native grasslands have the potential to sequester significant amounts of carbon for extended periods of time (see Figure 10.4). A recent regression tree analysis based on remote-sensing and flux tower data estimated a spatially averaged annual uptake by grasslands of 45 g C per m2 per year in the same period (Wylie et al., 2016), confirming previous findings that grasslands are resilient carbon sinks.
Figure 10.4: The Great Plains Ecoregion: Land Cover, Grassland Flux Towers, and Carbon Flux in 2005
10.2.2 Processes Affecting Carbon Stocks and Fluxes in Grasslands
Climate Variability
Key Findings 2 and 3 relate to climate effects on grasslands, which will vary spatially and temporally. Grassland carbon balance is strongly sensitive to precipitation, often resulting in increased carbon losses in dry years or over drought-affected areas, particularly in the southwestern Great Plains (see Figure 10.4; Biederman et al., 2016; Scott et al., 2015; Svejcar et al., 2008; Zhang et al., 2011). These frequent shifts from uptake to emissions in response to reduced precipitation indicate that grasslands are closer to the threshold for net carbon storage than are forests (Scott et al., 2015). This interannual variation in grassland NEP results from interactions between moisture and temperature controls on leaf area production, photosynthesis, and respiration (Flanagan and Adkinson 2011). If moisture is not limiting, carbon storage can increase significantly in response to warmer conditions and rising atmospheric CO2 (see Section 10.3.3). In part, this increase results from flexible timing of grassland plant growth and photosynthesis (Ryan et al., 2016; Zelikova et al., 2015). For example, drought decreased the growing season length and led to reductions in NPP and carbon sequestration in the Canadian Great Plains (Flanagan and Adkinson 2011).
Land-Use and Land-Cover Changes (Grazing and Species Shifts)
Key Finding 4 relates to management impacts on grassland carbon stocks and fluxes. A recent simulation suggests that Great Plains grassland area declined by 16% from 1992 to 2005 due to land-use change, including fire suppression (Bachelet et al., 2017). However, carbon stocks in remaining grasslands are considered to be stable or increasing (Zhu et al., 2011).
Grazing Effects on Grassland Carbon Cycling. Grasslands in North America evolved with native herbivores, historically grazed by livestock with varying intensities. Poor grazing management has been associated with reductions in productivity and soil carbon stocks, but improved management approaches, such as appropriate fertilization or reduced grazing intensity, can restore or even increase the original potential for carbon storage (Conant et al., 2001). Grazing intensity affects species composition and soil carbon content. For instance, heavy grazing can reduce aboveground productivity and root biomass, alter microbial community composition, and increase soil decomposition rates (Klumpp et al., 2009). However, intensive, early spring grazing may improve net carbon uptake by stimulating re-growth of plants later in the growing season, contingent on rainfall seasonality (Owensby et al., 2006; Svejcar et al., 2008). Some studies reported no effect of grazing on grassland carbon exchange (Polley et al., 2008; Risch and Frank 2006), and moderately grazed prairies can remain net carbon sinks (Frank 2004). In one recent study, moderate grazing was associated with average net carbon uptake of nearly 300 g per m2 per year, but this was reduced to zero with heavy grazing (Morgan et al., 2016). Furthermore, low-precipitation years can reduce productivity in grazed ecosystems (Ingram et al., 2008; Polley et al., 2008), leading to net carbon losses in combination with heavy grazing (Morgan et al., 2016). In intensively managed, fertilized pastures on degraded former croplands in the mesic southeastern United States, soil carbon stocks returned to their preagricultural levels within about 6 years, because of high NPP and rapid belowground carbon cycling (Machmuller et al., 2015). In mesic Texas rangelands, adaptive management, using high stocking rates for short durations across multiple paddocks, increased soil carbon relative to continuous heavy grazing (Teague et al., 2011). These studies suggest that grassland carbon cycling is resilient to appropriately managed grazing (see Figure 10.1). However, a global meta-analysis indicates that grazing impacts on carbon storage are contingent on many factors, including precipitation, soil texture, plant species competition, and grazing intensity; for example, grazing stimulated carbon storage in C4 grasslands by 67% but decreased it in C3 grasslands by 18% (McSherry and Ritchie 2013).
Species Shifts: Invasive Grasses and Woody Encroachment. The species composition, productivity, and carbon storage in grasslands are partly controlled by fire regimes, whether managed or unmanaged. Reduced fire frequency is associated with encroachment of woody plants into grassland ecosystems, while expansion of non-native, annual grasses such as cheatgrass can lead to increased fire frequency (see Figure 10.1 Jones et al., 2015). Species shifts from perennial to annual vegetation may lead to reductions in productivity and carbon storage (Prater et al., 2006). For example, net carbon losses averaging 150 g per m2 per year were observed for cheatgrass, mainly from increased decomposition rates (Verburg et al., 2004). Cheatgrass enhanced greenhouse gas (GHG) emissions, especially nitrous oxide (N2O), and carbon cycling rates, compared with those for native perennial grasses (Norton et al., 2008). Further expansion of cheatgrass is expected to occur in response to rising temperatures across the western United States (Blumenthal et al., 2016).
Woody plant encroachment, with its increasing abundance of shrubs and trees, is one of the greatest threats to grasslands in North America, particularly with regard to changes in the magnitude and distribution of carbon stored in major terrestrial pools (Archer et al., 2001; Barger et al., 2011; Jackson et al., 2002; Knapp et al., 2008b). Changes in ecosystem carbon storage accompanying increases in woody plants in grasslands represent a potentially significant but highly uncertain component of the carbon budget for North America (Houghton et al., 1999; Pacala et al., 2007), with positive, neutral, or negative effects documented (Barger et al., 2011). The most recent synthesis of studies quantifying the carbon consequences of woody plant encroachment in grasslands suggests that carbon in aboveground pools decreases in more water limited regions (i.e., mean annual precipitation < 330 mm) but increases in regions with greater precipitation (Barger et al., 2011; Knapp et al., 2008a). In the U.S. Great Plains, fire suppression with its associated woody encroachment from 1971 to 2005 is estimated to have increased total carbon stocks by an extra 5% relative to a nonfire-suppression scenario, with gains in woody biomes more than exceeding losses in grasslands (Bachelet et al., 2017). Changes in soil carbon from woody encroachment were not strongly related to aboveground carbon. However, loss of soil carbon is most likely to occur in humid grasslands, with increases in soil carbon apparent in arid regions (Barger et al., 2011; Jackson et al., 2002). Combining major aboveground and belowground pools, Barger et al. (2011) concluded woody plant encroachment generally would result in a net increase in ecosystem carbon stocks. Although some shrub-dominated ecosystems are more likely to lose carbon during drought periods than nearby grass-dominated systems (Scott et al., 2015), other areas indicate shrubs can maintain net carbon uptake despite drought (Petrie et al., 2015).
Woody plants are still increasing in many grasslands as a result of reduced fire frequency, rising CO2, and increased precipitation intensity (Kulmatiski and Beard 2013). Because changes in carbon pools occur at very different rates above and below ground, ecosystem carbon changes driven by woody plant encroachment are likely to remain dynamic in the future. Overall, shifts in plant species composition and ecosystem structure represent a significant source of uncertainty in predicting future carbon cycling in grasslands.
See Full Chapter & References