<b>Pendall</b>, E., D. Bachelet, R. T. Conant, B. El Masri, L. B. Flanagan, A. K. Knapp, J. Liu, S. Liu, and S. M. Schaeffer, 2018: Chapter 10: Grasslands. In Second State of the Carbon Cycle Report (SOCCR2): A Sustained Assessment Report [Cavallaro, N., G. Shrestha, R. Birdsey, M. A. Mayes, R. G. Najjar, S. C. Reed, P. Romero-Lankao, and Z. Zhu (eds.)]. U.S. Global Change Research Program, Washington, DC, USA, pp. 399-427, https://doi.org/10.7930/SOCCR2.2018.Ch10.
Grasslands
Grasslands cover 30% of North America and provide a wealth of essential ecosystem services, such as wildlife habitat, hydrological buffering, soil stabilization, carbon storage, and forage production. Grassland ecosystems are characterized by herbaceous vegetation, including grasses and nongrass species, with a minor component of woody vegetation in most regions. Most grasslands in North America are dominated by perennial vegetation, or species that continue growing for many years, although in parts of California and the Intermountain West, nonnative annual grasses now dominate. Grasses allocate 40% to 80% of net primary production (NPP) to roots (Hui and Jackson 2006), so most carbon storage takes place below ground (Silver et al., 2010; Smith et al., 2008; Soussana et al., 2004). Grasslands across North America occupy over 7 million km2 (see Table 10.1) and contain 10 to 90 megagrams of carbon (Mg C) per hectare in the top 20 cm of soil (Burke et al., 1989; Potter and Derner 2006; Silver et al., 2010).
Table 10.1. Average Modeled Net Ecosystem Production (In Tg C per Year During 2000 to 2006)
| Country | Approximate Grassland Area (km2)a | Analysisb, c | Atmospheric Inversion Modelsc, d | Land-Surface Modelsc, d |
|---|---|---|---|---|
| Canada | 3,920,000 | –3.06 | –51.2 | –29.3 |
| United States | 2,580,000 | –13.2 | –266.2 | –104.8 |
| Mexico | 760,000 | –9.06 | –15.1 | +3.6 |
| North America | 7,260,000 | –25.2 | –332.5 | –130.5 |
This table, adapted from Hayes et al. (2012), presents three different approaches for estimating net ecosystem production (NEP): inventory analysis, atmospheric inversion models, and land-surface models.
Notes
a Approximate grassland area is derived from www.statista.com/statistics/201761/projection-for-total-us-grassland-area-from-2010.
b Inventory analysis estimates, in teragrams of carbon (Tg C) per year, are the sum of livestock methane (CH4) emissions, livestock carbon dioxide (CO2) emissions, and grassland net ecosystem exchange (NEE) for Canada
and the United States. For Mexico, the NEP value for “Others” was used from Table S10 in Hayes et al. (2012).
c A negative flux represents net ecosystem carbon uptake, while a positive flux indicates carbon loss from
the ecosystem.
d Atmospheric inversion models and land-surface models are from Table 2 in Hayes et al. (2012) and exclude CH4 emissions and human settlement emissions.
Carbon storage, defined as the net uptake of carbon by a given pool or reservoir (IPCC 2013), can be quantified as the change in stocks measured over time, or as annual net ecosystem production (NEP), which can be measured as NPP minus losses from soil organic matter (SOM) decomposition (Chapin et al., 2006). NEP is also estimated from the sum of high-frequency net carbon dioxide (CO2) exchange (NEE) measurements from eddy covariance “flux tower” methods. By contrast, net ecosystem carbon balance (NECB) accounts for all carbon uptake and loss processes, including harvest, natural disturbance, leaching, and trace gas species in addition to CO2 (Chapin et al., 2006).
This chapter is relevant to both the Northern and Southern Plains National Climate Assessment regions, as well as the Southwest and Midwest regions. The spatial scope of this chapter encompasses the major North American grassland regions, which can be defined by climatic limitations. Grasslands occur where potential evaporation exceeds precipitation, such as in central North America from Canada through Mexico and in mountain rain shadows in the western United States (Sims and Risser 2000). They also occur in more mesic (wet) regions where disturbance, management, or soil conditions prevent woody growth, such as in central Florida (Stephenson 2011). North American grasslands generally increase in productivity and carbon storage as precipitation increases, from west to east (Sims and Risser 2000). This pattern is observed in Canada and to a lesser extent in Mexico. Mixed-grass prairie is extensive in south-central Canada, while more arid desert grassland and shortgrass steppe extend through the southwestern United States into Mexico (Sims and Risser 2000). Grasslands at the more arid extreme are considered more vulnerable to diminished productivity in a future warmer climate (Hufkens et al., 2016), whereas grasslands in more mesic climates may be vulnerable to woody encroachment (Knapp et al., 2008a).
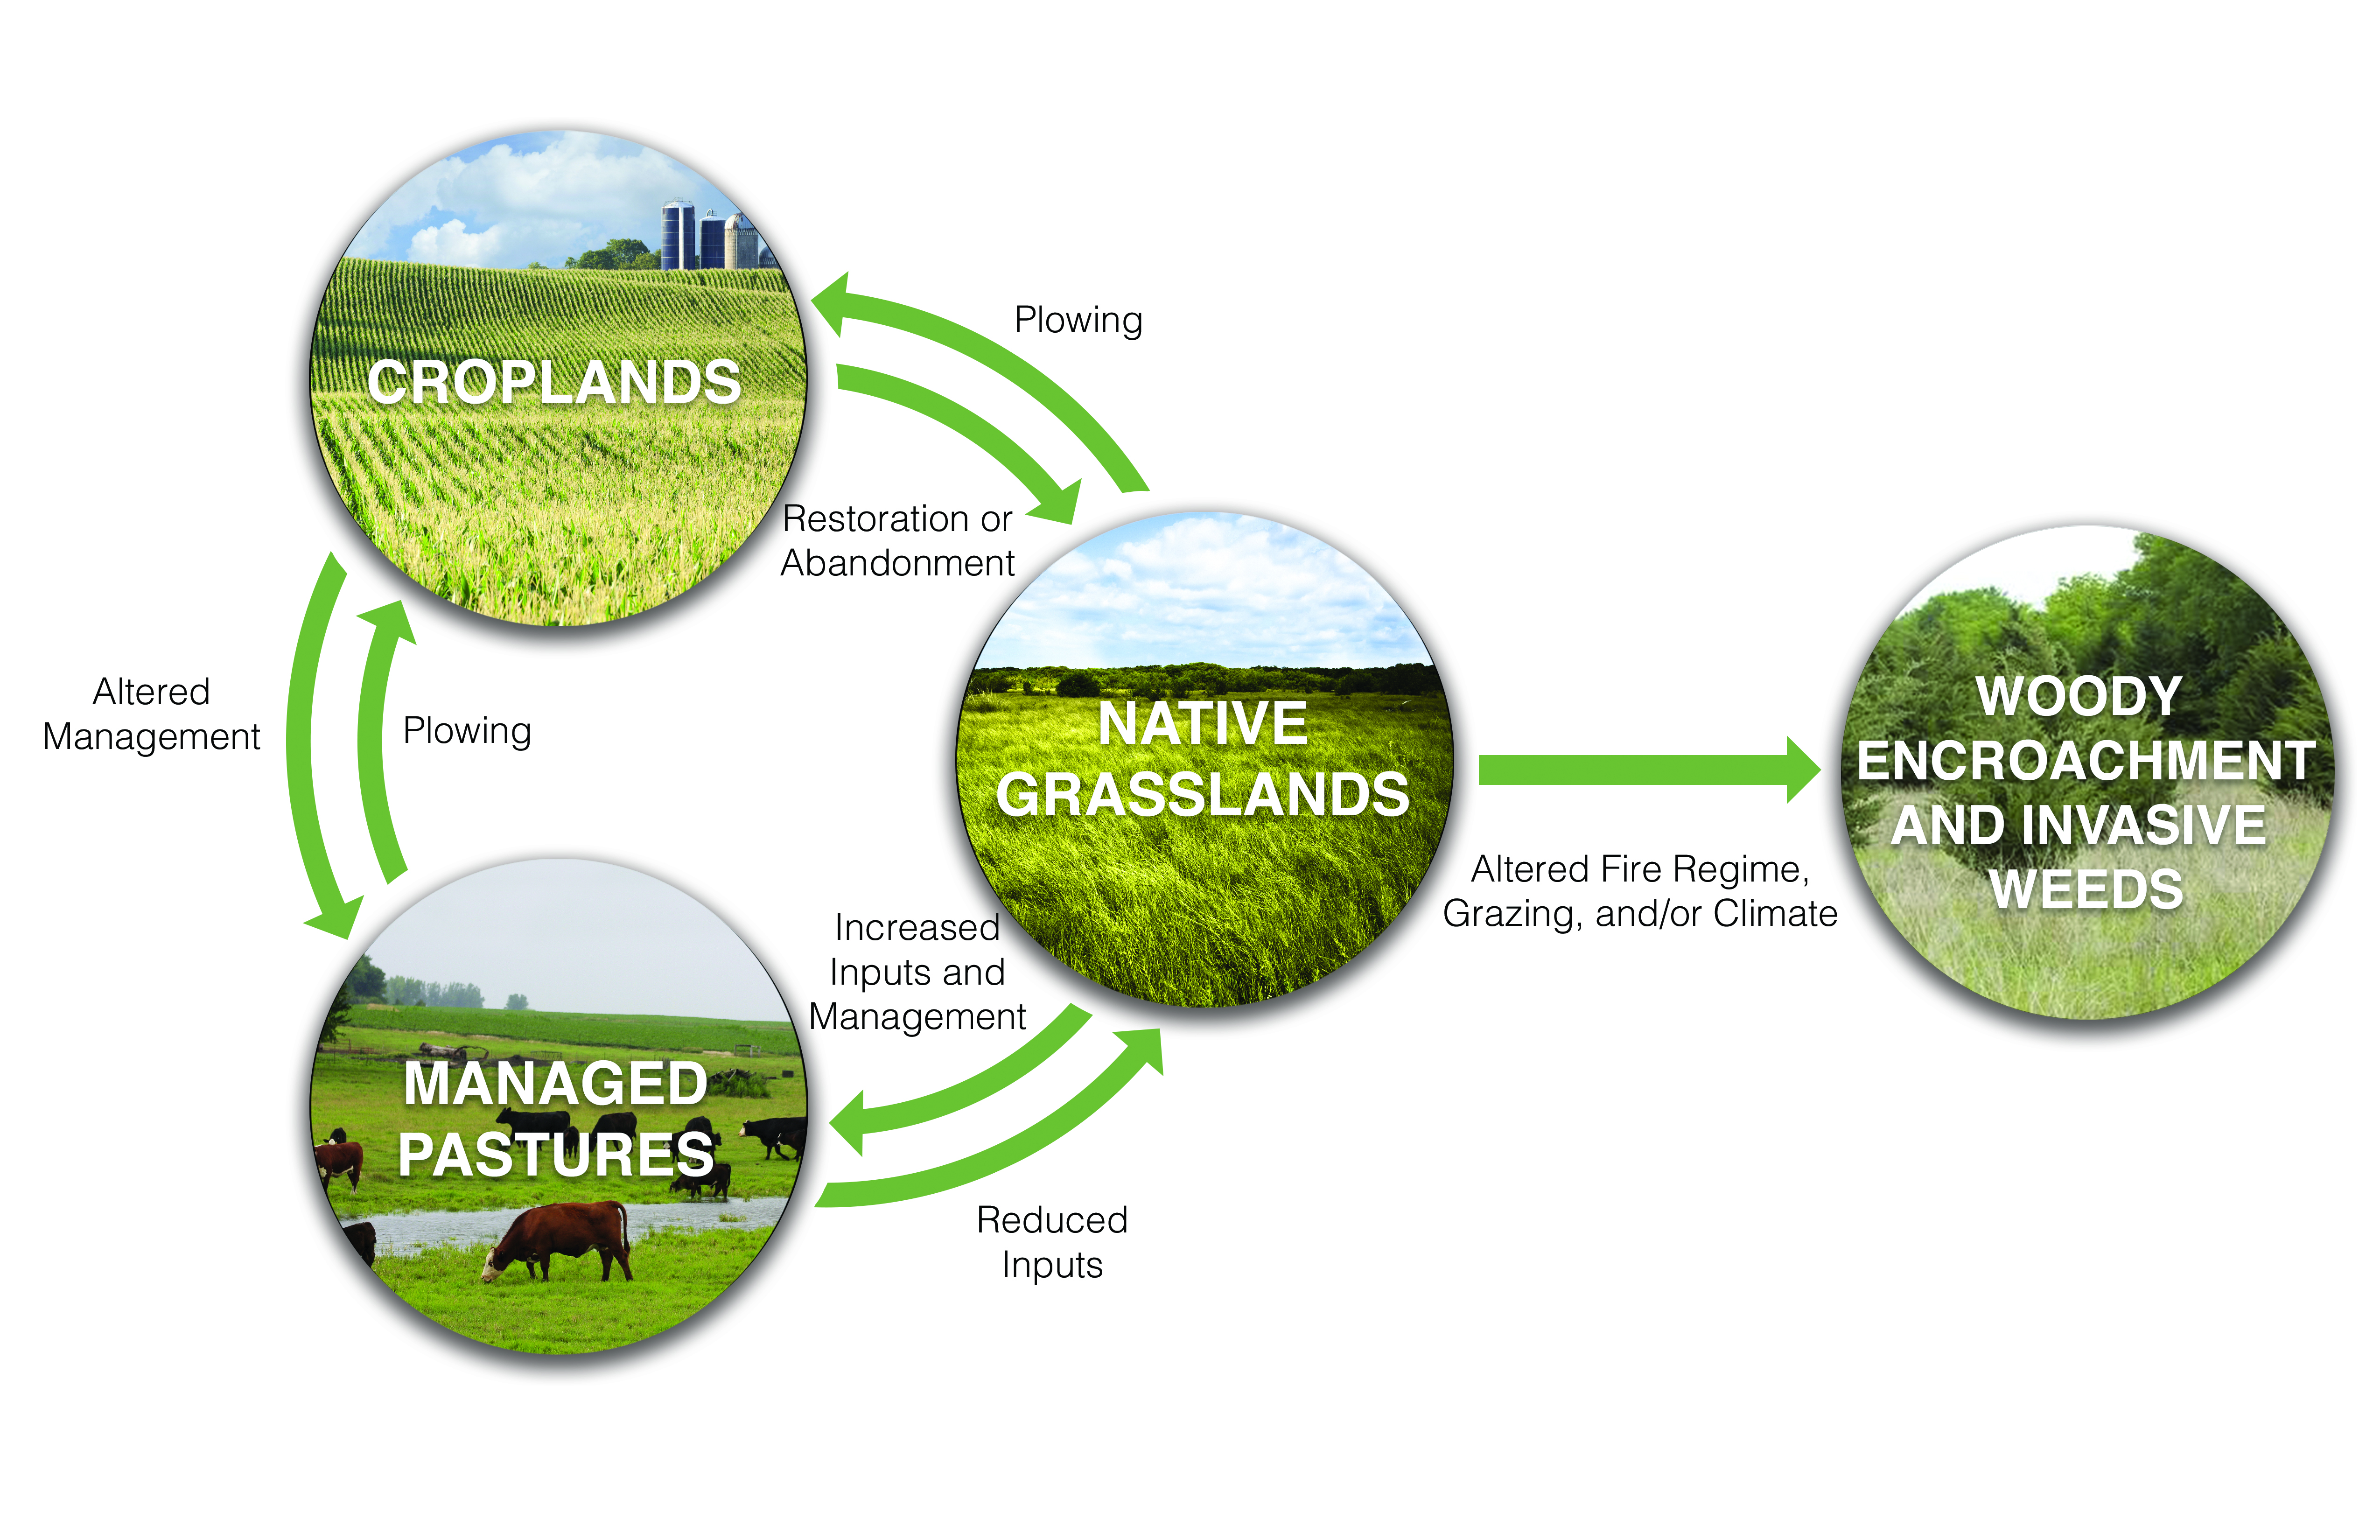
Land management strongly affects productivity and carbon cycling in grasslands (see Figure 10.1). In the conterminous United States, grasslands, shrublands, rangelands, and pastures make up at least 40% of land cover (Reeves and Mitchell 2012; see Figure 10.1). Most areas of highly productive grasslands have been converted to agriculture (see Ch. 5: Agriculture for more details; Bachelet et al., 2017).
Figure 10.1: Management Activities and Their Effects on Grassland Carbon Cycling