<b>Bruhwiler</b>, L., A. M. <b>Michalak</b>, R. Birdsey, J. B. Fisher, R. A. Houghton, D. N. Huntzinger, and J. B. Miller, 2018: Chapter 1: Overview of the global carbon cycle. In Second State of the Carbon Cycle Report (SOCCR2): A Sustained Assessment Report [Cavallaro, N., G. Shrestha, R. Birdsey, M. A. Mayes, R. G. Najjar, S. C. Reed, P. Romero-Lankao, and Z. Zhu (eds.)]. U.S. Global Change Research Program, Washington, DC, USA, pp. 42-70, https://doi.org/10.7930/SOCCR2.2018.Ch1.
Overview of the Global Carbon Cycle
The carbon cycle undergoes perturbations caused by a variety of natural processes such as wildfires, droughts, insect infestations, and disease. These processes can themselves be affected by human activities, for example through GHG emissions that change climate, wildfire suppression, and land-use change. During longer periods, variations in the Earth’s orbit also drive significant perturbations to the global carbon cycle. Over the recent several centuries, human activity has resulted in perturbations to the carbon cycle that have no precedent in geological records. Anthropogenic emissions also can directly alter the chemistry of the atmosphere, possibly affecting its ability to remove pollutants. These human-caused carbon cycle perturbations are discussed in this section.
Since the dawn of the Industrial Age over 250 years ago, humans have significantly altered the global carbon cycle, chiefly by combustion of fossil fuels, but also by perturbing the natural carbon cycle. An example is the large-scale conversion of forests to agricultural land and rangeland. As a result, atmospheric concentrations of CO2 and CH4 have increased dramatically. Atmospheric CO2 has increased from a preindustrial abundance of 280 ppm of dry air (MacFarling Meure et al., 2006) to more than 400 ppm in recent years (NOAA-ESRL-GMD Trends 2017),2 an increase of 43%. Methane has increased from a preindustrial abundance of about 700 ppb of dry air to current values of over 1,850 ppb, an increase of over 160%. Current understanding of the sources and sinks of atmospheric carbon supports the dominant role played by human activities, especially fossil fuel combustion, in the rapid rise of atmospheric carbon. For example, Tans (2009) demonstrated that accumulated carbon in the atmospheric and oceanic reservoirs since preindustrial times is approximately equivalent to the total amount emitted by fossil fuel combustion. If fossil fuel emissions were abruptly terminated, 20% to 40% of this carbon would remain airborne for millennia (Archer et al., 2009; Archer and Brovkin 2008; Solomon et al., 2009). Increases in atmospheric carbon, along with smaller contributions from other GHGs emitted by humans, have led to annual global mean temperatures that have risen by 0.85°C during 1880 to 2012 (IPCC 2013). If recent years are included, the global average temperature has increased by about 1.25°C since 1880 (Hansen et al., 2017).
1.3.1 Anthropogenic Emissions
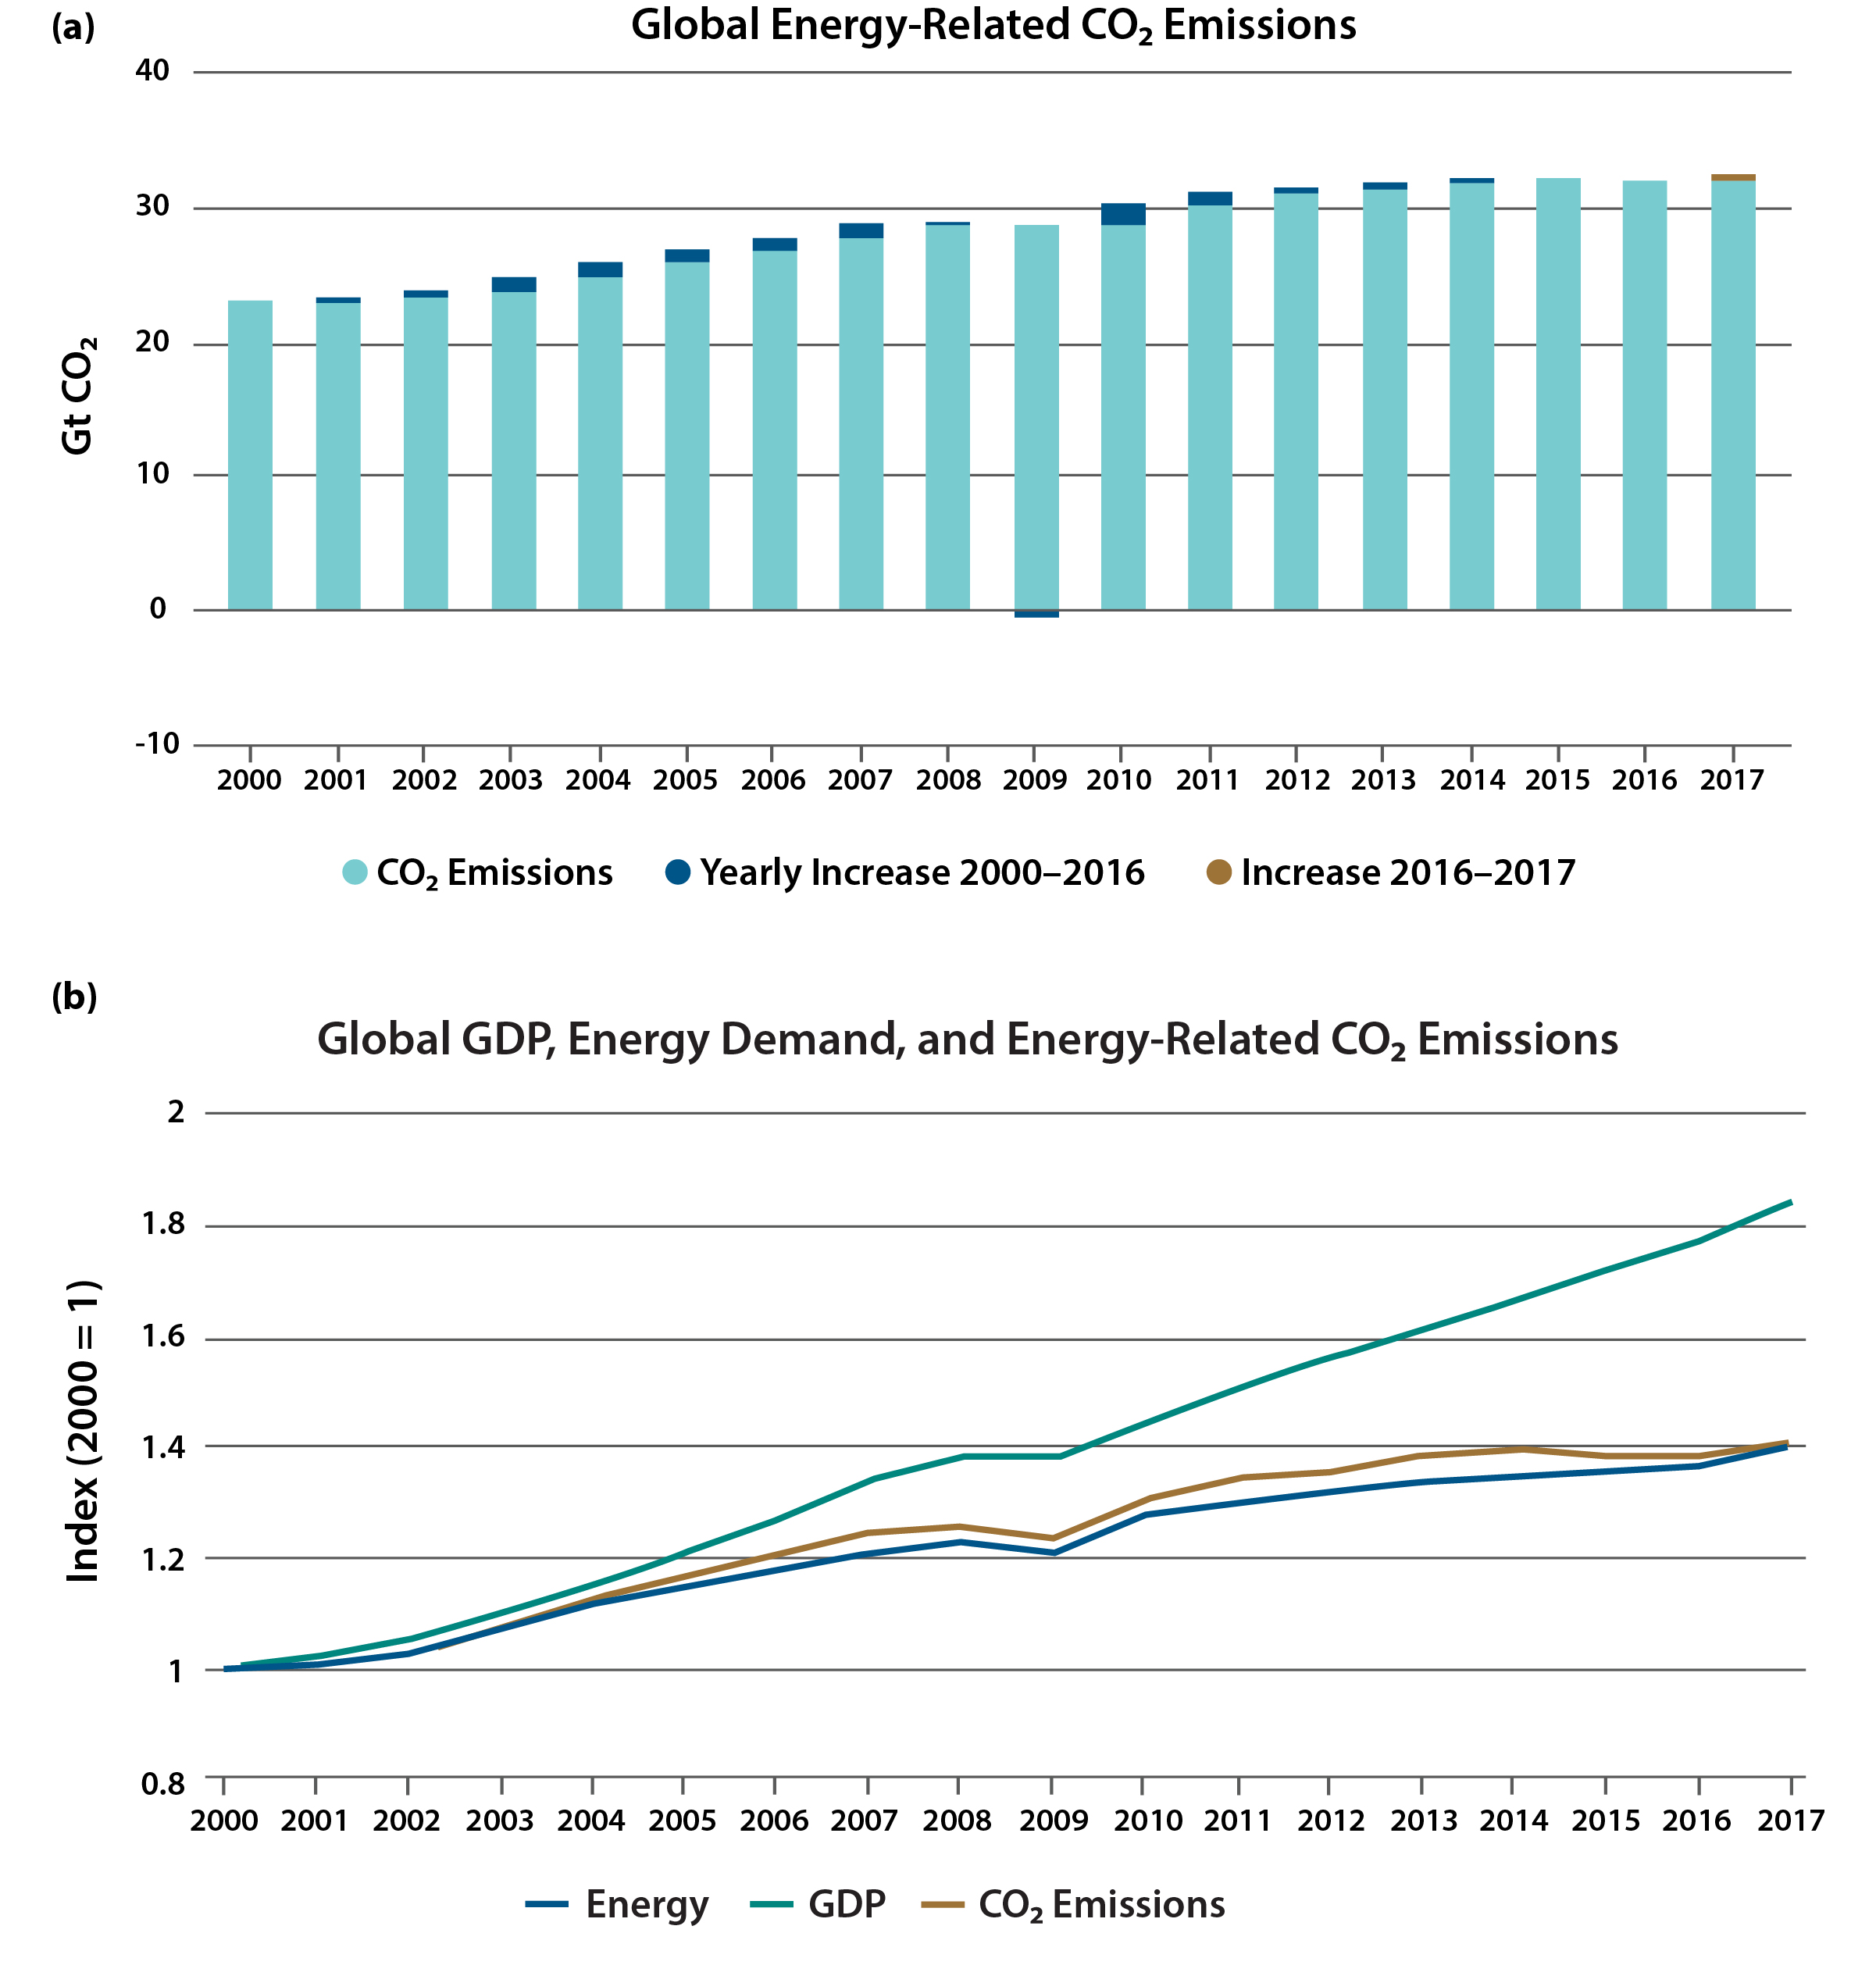
By burning coal, oil, and gas, humans are accelerating the part of the geological carbon cycle that transfers carbon in rocks and sediments to the atmosphere. From 1870 to 2017, humans emitted 430 ± 20 Pg C as CO2 to the atmosphere (Le Quéré et al., 2018). Global fossil fuel emissions of CO2 increased at a rate of about 4% per year from 2000 to 2012, when emissions growth decreased to about 1% per year. In subsequent years, the growth of CO2 emissions continued to decline, leveling off in 2015 (see Figure 1.4; Le Quéré et al., 2018), when global carbon emissions from fossil fuel use and cement production—an industry which releases CO2 as a by-product of the chemical process that produces lime from limestone—was estimated to total 9.9 Pg C (about 100 times faster than natural geological fluxes; see Figure 1.2). This leveling off of emissions occurred even as the global economy was expanding (see Figure 1.5). In 2017, global CO2 emissions rose again by an estimated 2%, likely due to faster economic growth and lower fossil fuel prices (Le Quéré et al., 2018).
Figure 1.5: Global Energy-Related Carbon Dioxide (CO2) Emission
Humans also can affect the global carbon cycle through land-use change, mainly by conversion of forests to agricultural land. Often deforestation is accomplished through use of fire. Emitted during the land-use conversion process from forest to other uses, CO2 thereafter reduces carbon uptake. Reforestation of formerly agricultural land can cause increased carbon uptake over time. Cumulative emissions of carbon from land-use change (mainly clearing of land for agriculture) since 1750 are estimated at 225 ± 75 Pg C (Le Quéré et al., 2018).
Atmospheric CH4 also is influenced by diverse human activities, ranging from food production (e.g., ruminants and rice) to waste (e.g., sewage and landfills) to fossil fuel production (e.g., coal, oil, and gas). Future increases in population likely will increase CH4 emissions from agriculture and waste as demand rises for more food production. Furthermore, the current boom in shale oil and gas exploitation has focused attention on leakage from drilling, storage, and transport of fossil fuel (e.g., Peischl et al., 2015; Pétron et al., 2014). Chemical reaction with OH accounts for about 90% of the total CH4 sink (Ehhalt 1974). These OH radicals, produced through the photolysis of ozone (O3) in the presence of water vapor, are destroyed by reactions with CH4 and other compounds. Uncertainty in the sink due to chemical loss by OH is 10% to 20%, because the OH distribution remains uncertain at regional to global scales (Saunois et al., 2016).
Relative to CO2, CH4 and other short-lived climate forcers such as black carbon have short atmospheric lifetimes; thus, estimates project that their mitigation potentially could reduce global mean warming by about 0.5°C by 2050, with air quality and agricultural productivity as co-benefits. Such mitigation, however, would not significantly limit maximum warming beyond 2050 (Shindell et al., 2012; Rogelj et al., 2014; National Academies of Sciences, Engineering, and Medicine 2018). Various strategies are possible for reducing emissions or enhancing the CH4 sink. For example, some increases in agricultural and waste emissions possibly could be avoided through improved practices and changed dietary trends (Hall et al., 2009; see Ch. 5: Agriculture for more information on agricultural and food emissions). In addition, humans potentially can alter the chemical lifetime of CH4 through emissions that affect the abundance of OH. Naik et al. (2013) found that OH might be about 10% lower than in preindustrial times, although with large uncertainty.
Current estimates reported by Saunois et al. (2016) for anthropogenic emissions average 328 Tg CH4 per year (ranging from 259 to 370 Tg CH4 per year). Extraction and processing of fossil fuels account for 32% to 34% of all anthropogenic emissions. Livestock, agriculture, landfills, and sewage together account for another 55% to 57%, with the remainder due to biomass and biofuel burning. A recent study using observations of the isotopic composition of CH4 suggests that emissions from fossil fuel production and geological emissions may be 20% to 60% higher than previously thought. This increase would require a compensating reduction in microbial emissions from natural and anthropogenic sources (Schwietzke et al., 2016) for the atmosphere to be in balance with the observed global average CH4 abundance.
Current CH4 levels are unprecedented in over at least 800,000 years (Loulergue et al., 2008). Recent National Oceanic and Atmospheric Administration atmospheric network observations have shown that global CH4 increased rapidly through the late 1990s, leveled off during the early 2000s, and began to increase again in 2007 (Dlugokencky et al., 2009; Rigby et al., 2008). These changes in global CH4 are not well understood and are under debate. Although Dlugokencky et al. (1998, 2003) suggested that the plateau in CH4 growth resulted from an approximate balance between global sources and sinks, some studies suggested that decreases in anthropogenic emissions (Aydin et al., 2011; Kai et al., 2011; Simpson et al., 2012) led to the period of slow CH4 growth. Isotopic evidence points toward increased emissions from microbial sources as an explanation for the recent rise in global CH4 (Nisbet et al., 2016; Schaefer et al., 2016; Schwietzke et al., 2016). However, increases in anthropogenic emissions also have been proposed (Rice et al., 2016), as well as decreases in the chemical loss (Rigby et al., 2017; Turner et al., 2017). Worden et al. (2017) have recently suggested a significant role for fossil fuel emissions in the recent growth of atmospheric CH4 based on decreases in biomass burning that could change the interpretation of methane isotope observations. This result is based on space-based observations of atmospheric CO, which itself may be responding to changes in other sources besides biomass burning.
Figure 1.1 shows that CH4 contributed just over 0.5 W/m2 in 2017 to global total anthropogenic radiative forcing, an amount which is about one-fourth of that from CO2. Although CH4 is much more effective at absorbing infrared radiation (Hofmann et al., 2006; Myhre et al., 2013),3 it is about a hundred times less abundant in the atmosphere than CO2.
1.3.2 North American Emissions in a Global Context
Historically, North America has been one of the world’s largest producers of human-caused CO2 emissions. Between 1850 and 2011, the United States has added 27% of the cumulative emissions, compared with 25% from European Union (EU) countries and 11% from China, currently the world’s largest emitter (World Resources Institute et al., 2014).4 In 2015, North America emitted almost 15% (1.5 Pg C) of the 9.9 Pg C emitted globally (Olivier et al., 2016). Of North America’s annual total emissions, a majority (84%) came from the United States, while Canada and Mexico emitted 8.7% and 7.3%, respectively. Since the 2007 publication of the First State of the Carbon Cycle Report (SOCCR1), China has replaced the United States as the world’s top emitter of CO2, adding 2.8 Pg C to the atmosphere in 2014, about twice U.S. emissions (Olivier et al., 2016). In terms of cumulative emissions, the United States is responsible for 100 Pg C out of a global total of 378 Pg C (UNFCCC 2013; World Resources Institute 2017). If land-use change and forestry are taken into account, U.S. contributions have totaled 134 Pg C out of a global total of 572 Pg C of net emissions. For comparison, historical emissions (including land-use change and forestry) of EU countries and China are 114 and 74 Pg C, respectively.
Both inventory (i.e., field measurements) and modeling techniques have been used to estimate land-based carbon sinks for North America (King et al., 2015). These estimates show that human-caused carbon emissions in North America are significantly higher than the land’s capacity to absorb and store them. For example, estimates suggest that between 2000 and 2009, only 15% to 49% (with a mean estimate of 26%) of North American fossil fuel emissions were absorbed by North American lands (King et al., 2015). As a result, North America is considered to be an overall net source of carbon to the atmosphere. However, the ability of North American land to take up and store carbon is significant. Globally, estimates suggest that over the past decade (2006 to 2015) 2.4 ± 0.5 Pg C per year were taken up by the ocean and 3.0 ± 0.8 Pg C per year were taken up by the terrestrial biosphere (Le Quéré et al., 2017). Of these totals, the amount taken up by the terrestrial biosphere in North America is estimated to be about 0.47 Pg C per year (King et al., 2015), or 15% of global terrestrial uptake.
Carbon uptake by North American lands is driven largely by the regrowth and recovery of forests from earlier human-driven changes in land cover and land use, such as forest clearing and harvesting (King et al., 2015), as well as increases in forest area from improved forest management practices (Melillo et al., 2014). Environmental influences on plant growth, such as the fertilizing effects of rising concentrations of atmospheric CO2 and nitrogen, along with changes in climate including longer growing seasons in northern midlatitude regions also have contributed to increased carbon uptake in North America over the past two decades (King et al., 2015; Melillo et al., 2014; see Ch. 2: The North American Carbon Budget).
However, the emissions of other GHGs, primarily CH4 and N2O, partially offset the potential climate cooling induced by the uptake of CO2 in North America (Tian et al., 2016). North America accounts for about 10% of natural (e.g., wetlands) and 12% of human-driven (e.g., agriculture and fossil fuels) global CH4 emissions (Kirschke et al., 2013; see Ch. 2: The North American Carbon Budget).
2National Oceanic and Atmospheric Administration Global Monitoring Division, Trends in Atmospheric Carbon Dioxide
3Hofmann et al. (2006), updated at www.esrl.noaa.gov/gmd/aggi/
4World Resources Institute
See Full Chapter & References